Air Ionizer Market: A Deep Dive Into Factors that will Help Vendors Stay Ahead of Competitors - Technavio

Vendors are deploying organic and inorganic growth strategies to compete in the market
NEW YORK, Sept. 15, 2022 /PRNewswire/ -- One of the key vendors operating in the air ionizer market is BONECO AG. The company offers a diffuser and Ionizer P50, which is designed to reduce the particles in the air. The market also has the presence of a few other major players, such as Coway Co. Ltd., Daikin Industries Ltd, Eureka Forbes Ltd., Faraday Ozone Products Pvt. Ltd, and Havells India Ltd.
The air ionizer market is fragmented. The market consists of numerous regional and international vendors. International vendors face stiff competition from many regional vendors. Moreover, factors such as the development of low-cost air ionizer solutions may impede the market growth.
Key strategies used by vendors to overcome the above challenges have been identified by Technavio. Well-established, reputed vendors are finding ways to distinguish their products in the global market to gain market share. They are investing in the development of innovative designs for air purification and new and improved features. Advances in air purification technology will lead to a shift in the use of air ionizers as standalone devices to integrated devices featuring multiple air purification systems.
Technavio's reports provide key strategic initiatives used by vendors, along with key news and the latest developments. View our FREE PDF Sample Report Now
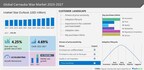
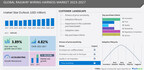
The air ionizer market size is expected to grow by USD 900.2 million from 2021 to 2026. In addition, the growth momentum of the market will accelerate at a CAGR of 7.14% during the forecast period.
Technavio provides a comprehensive report summary describing the market size and forecast along with research methodology. The sample report is available in PDF format
Vendors in the air ionizer market can take advantage of a few factors that will work in their favor. The growing demand for air ionizers is one of these factors. There is a rising demand for air ionizers amid concerns regarding air pollution. China is the largest adopter of air ionizers among major emerging economies, with sales of more than 7.5 million units in 2018. Moreover, the adoption of air ionizers is increasing in developed economies in North America. Air ionizers are becoming an integral part of multi-filtration air ionizers. Hence, the increasing adoption of air ionizers is a key driver for the growth of the market.
Technavio has identified key trends, drivers, and challenges in the market, which will help vendors improve their strategies to stay ahead of their competitors. View our FREE PDF Sample Report
Portable Air Purifier Market Growth, Size, Trends, Analysis Report by Type, Application, Region, and Segment Forecast 2022-2026: Factors such as the presence of counterfeit products may impede market growth.
Air Purifier Market Growth, Size, Trends, Analysis Report by Type, Application, Region, and Segment Forecast 2022-2026: Factors such as the presence of counterfeit products may impede market growth.
Air Ionizer Market Scope |
|
Report Coverage |
Details |
Page number |
120 |
Base year |
2021 |
Forecast period |
2022-2026 |
Growth momentum & CAGR |
Accelerate at a CAGR of 7.14% |
Market growth 2022-2026 |
USD 900.2 million |
Market structure |
Fragmented |
YoY growth (%) |
6.15 |
Regional analysis |
North America, APAC, Europe, South America, and Middle East and Africa |
Performing market contribution |
APAC at 41% |
Key consumer countries |
US, Canada, China, Japan, and UK |
Competitive landscape |
Leading companies, Competitive strategies, Consumer engagement scope |
Key companies profiled |
Air Oasis LLC, Blue Star Ltd, BONECO AG, Coway Co. Ltd., Daikin Industries Ltd, Eureka Forbes Ltd., Faraday Ozone Products Pvt. Ltd, Havells India Ltd, Honeywell International Inc., INCEN AG, KENT RO Systems Ltd., Livpure Pvt. Ltd., OION Technologies, Panasonic Corp, Rabbit Air, Samsung Electronics Co. Ltd., Sharp Corp., Unilever Group, Wein Products Inc, and Winix America Inc. |
Market dynamics |
Parent market analysis, market growth inducers and obstacles, fast-growing and slow-growing segment analysis, COVID-19 impact and recovery analysis and future consumer dynamics, and Market condition analysis for the forecast period. |
Customization purview |
If our report has not included the data that you are looking for, you can reach out to our analysts and get segments customized. |
Browse Consumer Discretionary Market Reports
1 Executive Summary
- 1.1 Market overview
- Exhibit 01: Executive Summary – Chart on Market Overview
- Exhibit 02: Executive Summary – Data Table on Market Overview
- Exhibit 03: Executive Summary – Chart on Global Market Characteristics
- Exhibit 04: Executive Summary – Chart on Market by Geography
- Exhibit 05: Executive Summary – Chart on Market Segmentation by End-user
- Exhibit 06: Executive Summary – Chart on Incremental Growth
- Exhibit 07: Executive Summary – Data Table on Incremental Growth
- Exhibit 08: Executive Summary – Chart on Vendor Market Positioning
2 Market Landscape
- 2.1 Market ecosystem
- Exhibit 09: Parent market
- Exhibit 10: Market Characteristics
3 Market Sizing
- 3.1 Market definition
- Exhibit 11: Offerings of vendors included in the market definition
- 3.2 Market segment analysis
- Exhibit 12: Market segments
- 3.3 Market size 2021
- 3.4 Market outlook: Forecast for 2021-2026
- Exhibit 13: Chart on Global - Market size and forecast 2021-2026 ($ million)
- Exhibit 14: Data Table on Global - Market size and forecast 2021-2026 ($ million)
- Exhibit 15: Chart on Global Market: Year-over-year growth 2021-2026 (%)
- Exhibit 16: Data Table on Global Market: Year-over-year growth 2021-2026 (%)
4 Five Forces Analysis
- 4.1 Five forces summary
- Exhibit 17: Five forces analysis - Comparison between 2021 and 2026
- 4.2 Bargaining power of buyers
- Exhibit 18: Chart on Bargaining power of buyers – Impact of key factors 2021 and 2026
- 4.3 Bargaining power of suppliers
- Exhibit 19: Bargaining power of suppliers – Impact of key factors in 2021 and 2026
- 4.4 Threat of new entrants
- Exhibit 20: Threat of new entrants – Impact of key factors in 2021 and 2026
- 4.5 Threat of substitutes
- Exhibit 21: Threat of substitutes – Impact of key factors in 2021 and 2026
- 4.6 Threat of rivalry
- Exhibit 22: Threat of rivalry – Impact of key factors in 2021 and 2026
- 4.7 Market condition
- Exhibit 23: Chart on Market condition - Five forces 2021 and 2026
5 Market Segmentation by End-user
- 5.1 Market segments
- Exhibit 24: Chart on End-user - Market share 2021-2026 (%)
- Exhibit 25: Data Table on End-user - Market share 2021-2026 (%)
- 5.2 Comparison by End-user
- Exhibit 26: Chart on Comparison by End-user
- Exhibit 27: Data Table on Comparison by End-user
- 5.3 Residential - Market size and forecast 2021-2026
- Exhibit 28: Chart on Residential - Market size and forecast 2021-2026 ($ million)
- Exhibit 29: Data Table on Residential - Market size and forecast 2021-2026 ($ million)
- Exhibit 30: Chart on Residential - Year-over-year growth 2021-2026 (%)
- Exhibit 31: Data Table on Residential - Year-over-year growth 2021-2026 (%)
- 5.4 Commercial - Market size and forecast 2021-2026
- Exhibit 32: Chart on Commercial - Market size and forecast 2021-2026 ($ million)
- Exhibit 33: Data Table on Commercial - Market size and forecast 2021-2026 ($ million)
- Exhibit 34: Chart on Commercial - Year-over-year growth 2021-2026 (%)
- Exhibit 35: Data Table on Commercial - Year-over-year growth 2021-2026 (%)
- 5.5 Market opportunity by End-user
- Exhibit 36: Market opportunity by End-user ($ million)
6 Customer Landscape
- 6.1 Customer landscape overview
- Exhibit 37: Analysis of price sensitivity, lifecycle, customer purchase basket, adoption rates, and purchase criteria
7 Geographic Landscape
- 7.1 Geographic segmentation
- Exhibit 38: Chart on Market share by geography 2021-2026 (%)
- Exhibit 39: Data Table on Market share by geography 2021-2026 (%)
- 7.2 Geographic comparison
- Exhibit 40: Chart on Geographic comparison
- Exhibit 41: Data Table on Geographic comparison
- 7.3 APAC - Market size and forecast 2021-2026
- Exhibit 42: Chart on APAC - Market size and forecast 2021-2026 ($ million)
- Exhibit 43: Data Table on APAC - Market size and forecast 2021-2026 ($ million)
- Exhibit 44: Chart on APAC - Year-over-year growth 2021-2026 (%)
- Exhibit 45: Data Table on APAC - Year-over-year growth 2021-2026 (%)
- 7.4 North America - Market size and forecast 2021-2026
- Exhibit 46: Chart on North America - Market size and forecast 2021-2026 ($ million)
- Exhibit 47: Data Table on North America - Market size and forecast 2021-2026 ($ million)
- Exhibit 48: Chart on North America - Year-over-year growth 2021-2026 (%)
- Exhibit 49: Data Table on North America - Year-over-year growth 2021-2026 (%)
- 7.5 Europe - Market size and forecast 2021-2026
- Exhibit 50: Chart on Europe - Market size and forecast 2021-2026 ($ million)
- Exhibit 51: Data Table on Europe - Market size and forecast 2021-2026 ($ million)
- Exhibit 52: Chart on Europe - Year-over-year growth 2021-2026 (%)
- Exhibit 53: Data Table on Europe - Year-over-year growth 2021-2026 (%)
- 7.6 South America - Market size and forecast 2021-2026
- Exhibit 54: Chart on South America - Market size and forecast 2021-2026 ($ million)
- Exhibit 55: Data Table on South America - Market size and forecast 2021-2026 ($ million)
- Exhibit 56: Chart on South America - Year-over-year growth 2021-2026 (%)
- Exhibit 57: Data Table on South America - Year-over-year growth 2021-2026 (%)
- 7.7 Middle East and Africa - Market size and forecast 2021-2026
- Exhibit 58: Chart on Middle East and Africa - Market size and forecast 2021-2026 ($ million)
- Exhibit 59: Data Table on Middle East and Africa - Market size and forecast 2021-2026 ($ million)
- Exhibit 60: Chart on Middle East and Africa - Year-over-year growth 2021-2026 (%)
- Exhibit 61: Data Table on Middle East and Africa - Year-over-year growth 2021-2026 (%)
- 7.8 US - Market size and forecast 2021-2026
- Exhibit 62: Chart on US - Market size and forecast 2021-2026 ($ million)
- Exhibit 63: Data Table on US - Market size and forecast 2021-2026 ($ million)
- Exhibit 64: Chart on US - Year-over-year growth 2021-2026 (%)
- Exhibit 65: Data Table on US - Year-over-year growth 2021-2026 (%)
- 7.9 China - Market size and forecast 2021-2026
- Exhibit 66: Chart on China - Market size and forecast 2021-2026 ($ million)
- Exhibit 67: Data Table on China - Market size and forecast 2021-2026 ($ million)
- Exhibit 68: Chart on China - Year-over-year growth 2021-2026 (%)
- Exhibit 69: Data Table on China - Year-over-year growth 2021-2026 (%)
- 7.10 Japan - Market size and forecast 2021-2026
- Exhibit 70: Chart on Japan - Market size and forecast 2021-2026 ($ million)
- Exhibit 71: Data Table on Japan - Market size and forecast 2021-2026 ($ million)
- Exhibit 72: Chart on Japan - Year-over-year growth 2021-2026 (%)
- Exhibit 73: Data Table on Japan - Year-over-year growth 2021-2026 (%)
- 7.11 UK - Market size and forecast 2021-2026
- Exhibit 74: Chart on UK - Market size and forecast 2021-2026 ($ million)
- Exhibit 75: Data Table on UK - Market size and forecast 2021-2026 ($ million)
- Exhibit 76: Chart on UK - Year-over-year growth 2021-2026 (%)
- Exhibit 77: Data Table on UK - Year-over-year growth 2021-2026 (%)
- 7.12 Canada - Market size and forecast 2021-2026
- Exhibit 78: Chart on Canada - Market size and forecast 2021-2026 ($ million)
- Exhibit 79: Data Table on Canada - Market size and forecast 2021-2026 ($ million)
- Exhibit 80: Chart on Canada - Year-over-year growth 2021-2026 (%)
- Exhibit 81: Data Table on Canada - Year-over-year growth 2021-2026 (%)
- 7.13 Market opportunity by geography
- Exhibit 82: Market opportunity by geography ($ million)
8 Drivers, Challenges, and Trends
- 8.1 Market drivers
- 8.2 Market challenges
- 8.3 Impact of drivers and challenges
- Exhibit 83: Impact of drivers and challenges in 2021 and 2026
- 8.4 Market trends
9 Vendor Landscape
- 9.1 Overview
- 9.2 Vendor landscape
- Exhibit 84: Overview on Criticality of inputs and Factors of differentiation
- 9.3 Landscape disruption
- Exhibit 85: Overview on factors of disruption
- 9.4 Industry risks
- Exhibit 86: Impact of key risks on business
10 Vendor Analysis
- 10.1 Vendors covered
- Exhibit 87: Vendors covered
- 10.2 Market positioning of vendors
- Exhibit 88: Matrix on vendor position and classification
- 10.3 BONECO AG
- Exhibit 89: BONECO AG - Overview
- Exhibit 90: BONECO AG - Product / Service
- Exhibit 91: BONECO AG - Key offerings
- 10.4 Coway Co. Ltd.
- Exhibit 92: Coway Co. Ltd. - Overview
- Exhibit 93: Coway Co. Ltd. - Product / Service
- Exhibit 94: Coway Co. Ltd. - Key offerings
- 10.5 Daikin Industries Ltd
- Exhibit 95: Daikin Industries Ltd - Overview
- Exhibit 96: Daikin Industries Ltd - Business segments
- Exhibit 97: Daikin Industries Ltd - Key news
- Exhibit 98: Daikin Industries Ltd - Key offerings
- Exhibit 99: Daikin Industries Ltd - Segment focus
- 10.6 Honeywell International Inc.
- Exhibit 100: Honeywell International Inc. - Overview
- Exhibit 101: Honeywell International Inc. - Business segments
- Exhibit 102: Honeywell International Inc. - Key news
- Exhibit 103: Honeywell International Inc. - Key offerings
- Exhibit 104: Honeywell International Inc. - Segment focus
- 10.7 OION Technologies
- Exhibit 105: OION Technologies - Overview
- Exhibit 106: OION Technologies - Product / Service
- Exhibit 107: OION Technologies - Key offerings
- 10.8 Panasonic Corp
- Exhibit 108: Panasonic Corp - Overview
- Exhibit 109: Panasonic Corp - Business segments
- Exhibit 110: Panasonic Corp - Key news
- Exhibit 111: Panasonic Corp - Key offerings
- Exhibit 112: Panasonic Corp - Segment focus
- 10.9 Samsung Electronics Co. Ltd.
- Exhibit 113: Samsung Electronics Co. Ltd. - Overview
- Exhibit 114: Samsung Electronics Co. Ltd. - Business segments
- Exhibit 115: Samsung Electronics Co. Ltd. - Key news
- Exhibit 116: Samsung Electronics Co. Ltd. - Key offerings
- Exhibit 117: Samsung Electronics Co. Ltd. - Segment focus
- 10.10 Unilever Group
- Exhibit 118: Unilever Group - Overview
- Exhibit 119: Unilever Group - Business segments
- Exhibit 120: Unilever Group - Key news
- Exhibit 121: Unilever Group - Key offerings
- Exhibit 122: Unilever Group - Segment focus
- 10.11 Wein Products Inc
- Exhibit 123: Wein Products Inc - Overview
- Exhibit 124: Wein Products Inc - Product / Service
- Exhibit 125: Wein Products Inc - Key offerings
- 10.12 Winix America Inc.
- Exhibit 126: Winix America Inc. - Overview
- Exhibit 127: Winix America Inc. - Product / Service
- Exhibit 128: Winix America Inc. - Key offerings
11 Appendix
- 11.1 Scope of the report
- 11.2 Inclusions and exclusions checklist
- Exhibit 129: Inclusions checklist
- Exhibit 130: Exclusions checklist
- 11.3 Currency conversion rates for US$
- Exhibit 131: Currency conversion rates for US$
- 11.4 Research methodology
- Exhibit 132: Research methodology
- Exhibit 133: Validation techniques employed for market sizing
- Exhibit 134: Information sources
- 11.5 List of abbreviations
- Exhibit 135: List of abbreviations
Technavio is a leading global technology research and advisory company. Their research and analysis focus on emerging market trends and provide actionable insights to help businesses identify market opportunities and develop effective strategies to optimize their market positions. With over 500 specialized analysts, Technavio's report library consists of more than 17,000 reports and counting, covering 800 technologies, spanning across 50 countries. Their client base consists of enterprises of all sizes, including more than 100 Fortune 500 companies. This growing client base relies on Technavio's comprehensive coverage, extensive research, and actionable market insights to identify opportunities in existing and potential markets and assess their competitive positions within changing market scenarios.
Technavio Research
Jesse Maida
Media & Marketing Executive
US: +1 844 364 1100
UK: +44 203 893 3200
Email: [email protected]
Website: www.technavio.com/
SOURCE Technavio


Share this article