Automotive On-Board Diagnostics (OBD) Market Size to Grow by USD 35,638.36 Million From 2022 to 2027: A Descriptive Analysis of Customer Landscape, Vendor Assessment, and Market Dynamics - Technavio

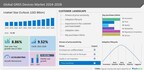
NEW YORK, Nov. 29, 2022 /PRNewswire/ -- Technavio categorizes the global automotive on-board diagnostics (OBD) market as a part of the automotive components and accessories market, the parent market. The automotive components and accessories market covers companies engaged in the production of parts and accessories for automobiles such as passenger cars (PCs), electric vehicles (EVs), commercial vehicles (CVs), heavy-duty vehicles, off-road vehicles, motorcycles, scooters, quad bikes, and three-wheelers. The global automotive on-board diagnostics (OBD) market size is estimated to increase by USD 35,638.36 million from 2022 to 2027. The market's growth momentum will accelerate at a CAGR of 18.29%.
Discover some insights on market size before buying the full report. Request a Free Sample
To help companies evaluate and develop growth strategies, the report outlines –
- Key purchase criteria
- Adoption rates
- Adoption lifecycle
- Drivers of price sensitivity
Vendor Landscape - The global automotive OBD systems market is moderately competitive, marked by the presence of a few international vendors. A few prominent vendors that offer automotive on-board diagnostics (OBD) in the market are Autel Intelligent Technology Co., AVL DiTEST GmbH, Bridgestone Corp, Continental AG, General Motors Co, Hearst Communications Inc., Innova Electronics Corp., Intel Corp., iWave Systems Technologies Pvt. Ltd., Marelli Holdings Co. Ltd., and others.
The international players in the market are focusing on increasing their customer base and R&D investments. The competition in the market is expected to intensify with advances in technology. The market is also witnessing the entry of many new players that focus on niche technologies. The new players provide innovative systems that have advanced technologies with many features and functionalities, while international players offer standardized systems.
Vendor Offerings -
- Autel Intelligent Technology Co.: The company offers automotive OBD such as MaxiSYS ultra EV, MaxiSYS MS909EV, EV diagnostics kit, and MaxiSYS pro model.
- AVL DiTEST GmbH: The company offers automotive OBD such as MDS drive 188, MDS 105, and XDS 1000.
- Bridgestone Corp: The company offers automotive OBD under the brand of Azuga Fleet, which ensures boarding safety, tracking, and cost management issues.
- Continental AG: The company offers an automotive OBD named Continental autodiagnos Pro OBD2 with a scanning system.
- For Details on vendors and their offerings – Buy report!
Geography Overview
Based on geography, the global automotive on-board diagnostics (OBD) market is segmented into North America, Europe, APAC, South America, and the Middle East and Africa. The report provides actionable insights and an accurate estimation of the contribution of all regions to the growth of the global automotive on-board diagnostics (OBD) market.
- North America held 32% of the global automotive on-board diagnostics (OBD) market in 2022. Many new companies are innovating in terms of automotive OBD connectivity, embedded display systems, and telematics. Therefore, remote vehicle diagnostics have gained traction. Feature upgrades and newer business models aimed at developing additional revenue streams for OEMs will drive the growth of the regional market during the forecast period.
Segment Overview
Based on product, the global automotive on-board diagnostics (OBD) market is segmented into allied services and OBD port.
- The market share growth of the allied services segment will be higher than the other segments during the forecast period. Passenger cars dominated the global automotive OBD market in 2022, as they have the first-mover advantage. As connected car offerings were introduced initially in the luxury vehicle segment, remote diagnostics achieved maximum penetration in this segment in the form of bundled offerings.
- Impactful Driver - The increase in the adoption of usage-based insurance (UBI) using OBD as a measurement parameter is driving the growth of the market. UBI is gaining popularity among insurance providers. In this method, an insurance provider defines the premium for the insurance subscription based on the driving pattern of the driver, which is measured by the data provided by an OBD system. The integration of telematics, along with OBD, enables insurers to procure adequate information, which helps in obtaining accurate data based on usage.
- Key Trend - The growing focus on remote diagnostics is a key trend in the market. Remote OBD systems diagnose a potential malfunction in the component of a vehicle and transmit the relevant data to a remote data center. Remote diagnostics helps in preventive maintenance and scheduling vehicle service cycles. The use of remote diagnostics is increasing among OBD system manufacturers owing to the increasing demand for these systems from fleet operators of passenger cars and commercial vehicles.
- Major Challenge - The increase in the cost of integrating telematics is a major challenge in the market. OEMs have to offer OBD systems along with other connected car offerings. However, the reluctance of customers to pay for such technologies poses a significant challenge. Both the mid-level and mass vehicle segments may offer remote vehicle diagnostics as an optional offering, which may not be preferred by buyers.
Driver, Trends, and Challenges are the factors of market dynamics that state about consequences and sustainability of businesses. Find a few insights from a free sample report!
What are the key data covered in this automotive on-board diagnostics (OBD) market report?
- CAGR of the market during the forecast period
- Detailed information on factors that will drive the growth of the automotive on-board diagnostics (OBD) market between 2023 and 2027
- Precise estimation of the size of the automotive on-board diagnostics (OBD) market size and its contribution to the parent market
- Accurate predictions about upcoming trends and changes in consumer behavior
- Growth of the automotive on-board diagnostics (OBD) market across APAC, North America, Europe, Middle East and Africa, and South America
- Thorough analysis of the market's competitive landscape and detailed information about vendors
- Comprehensive analysis of factors that will challenge the growth of automotive on-board diagnostics (OBD) market vendors
Register for a free trial today and gain instant access to 17,000+ market research reports.
Technavio's SUBSCRIPTION platform
Related Reports:
- The automotive e-compressor market size is forecasted to increase by USD 7.45 billion. The market is segmented by application (passenger cars and commercial vehicles) and geography (North America, Europe, APAC, South America, and the Middle East and Africa).
- The automotive paddle shifter system market is estimated to grow at a CAGR of 6.74%. The size of the market is forecasted to increase by 9.01 billion units. The market is segmented by application (passenger cars and LCVs) and geography (North America, Europe, APAC, the Middle East and Africa, and South America).
Automotive On-Board Diagnostics (OBD) Market Scope |
|
Report Coverage |
Details |
Page number |
120 |
Base year |
2022 |
Historic period |
2017-2021 |
Forecast Period |
2023 -2027 |
Growth momentum & CAGR |
Accelerate at a CAGR of 18.29% |
Market growth 2023-2027 |
USD 35,638.36 million |
Market structure |
Fragmented |
YoY growth (%) |
17.52 |
Regional analysis |
North America, Europe, APAC, South America, and Middle East and Africa |
Performing contribution |
North America at 32% |
Key countries |
US, China, Japan, Germany, and UK |
Competitive landscape |
Leading Companies, Market Positioning of Vendors, Competitive Strategies, and Industry Risks |
Key companies profiled |
Autel Intelligent Technology Co., AVL DiTEST GmbH, Bridgestone Corp, Continental AG, General Motors Co, Hearst Communications Inc., Innova Electronics Corp., Intel Corp., iWave Systems Technologies Pvt. Ltd., Marelli Holdings Co. Ltd., Mercedes Benz Group AG, Moj.io Inc., OBD Solutions LLC, Robert Bosch GmbH, Vector Informatik GmbH, Verizon Communications Inc., Zubie Inc., Dashboard Labs Corps., Denso Corp., and HELLA GmbH & Co. KG |
Market dynamics |
Parent Market Analysis; Market growth inducers and obstacles; Fast-growing and slow-growing segment analysis for the forecast period |
Customization purview |
If our report has not included the data that you are looking for, you can reach out to our analysts and get segments customized. |
Browse Consumer Discretionary Market Reports
Table Of Contents:
1 Executive Summary
- 1.1 Market overview
- Exhibit 01: Executive Summary – Chart on Market Overview
- Exhibit 02: Executive Summary – Data Table on Market Overview
- Exhibit 03: Executive Summary – Chart on Global Market Characteristics
- Exhibit 04: Executive Summary – Chart on Market by Geography
- Exhibit 05: Executive Summary – Chart on Market Segmentation by Product
- Exhibit 06: Executive Summary – Chart on Market Segmentation by Vehicle Type
- Exhibit 07: Executive Summary – Chart on Incremental Growth
- Exhibit 08: Executive Summary – Data Table on Incremental Growth
- Exhibit 09: Executive Summary – Chart on Vendor Market Positioning
2 Market Landscape
- 2.1 Market ecosystem
- Exhibit 10: Parent market
- Exhibit 11: Market Characteristics
3 Market Sizing
- 3.1 Market definition
- Exhibit 12: Offerings of vendors included in the market definition
- 3.2 Market segment analysis
- Exhibit 13: Market segments
- 3.3 Market size 2022
- 3.4 Market outlook: Forecast for 2022-2027
- Exhibit 14: Chart on Global - Market size and forecast 2022-2027 ($ million)
- Exhibit 15: Data Table on Global - Market size and forecast 2022-2027 ($ million)
- Exhibit 16: Chart on Global Market: Year-over-year growth 2022-2027 (%)
- Exhibit 17: Data Table on Global Market: Year-over-year growth 2022-2027 (%)
4 Historic Market Size
- 4.1 Global automotive on-board diagnostics (OBD) market 2017 - 2021
- Exhibit 18: Historic Market Size – Data Table on Global automotive on-board diagnostics (OBD) market 2017 - 2021 ($ million)
- 4.2 Product Segment Analysis 2017 - 2021
- Exhibit 19: Historic Market Size – Product Segment 2017 - 2021 ($ million)
- 4.3 Vehicle type Segment Analysis 2017 - 2021
- Exhibit 20: Historic Market Size – Vehicle type Segment 2017 - 2021 ($ million)
- 4.4 Geography Segment Analysis 2017 - 2021
- Exhibit 21: Historic Market Size – Geography Segment 2017 - 2021 ($ million)
- 4.5 Country Segment Analysis 2017 - 2021
- Exhibit 22: Historic Market Size – Country Segment 2017 - 2021 ($ million)
5 Five Forces Analysis
- 5.1 Five forces summary
- Exhibit 23: Five forces analysis - Comparison between2022 and 2027
- 5.2 Bargaining power of buyers
- Exhibit 24: Chart on Bargaining power of buyers – Impact of key factors 2022 and 2027
- 5.3 Bargaining power of suppliers
- Exhibit 25: Bargaining power of suppliers – Impact of key factors in 2022 and 2027
- 5.4 Threat of new entrants
- Exhibit 26: Threat of new entrants – Impact of key factors in 2022 and 2027
- 5.5 Threat of substitutes
- Exhibit 27: Threat of substitutes – Impact of key factors in 2022 and 2027
- 5.6 Threat of rivalry
- Exhibit 28: Threat of rivalry – Impact of key factors in 2022 and 2027
- 5.7 Market condition
- Exhibit 29: Chart on Market condition - Five forces 2022 and 2027
6 Market Segmentation by Product
- 6.1 Market segments
- Exhibit 30: Chart on Product - Market share 2022-2027 (%)
- Exhibit 31: Data Table on Product - Market share 2022-2027 (%)
- 6.2 Comparison by Product
- Exhibit 32: Chart on Comparison by Product
- Exhibit 33: Data Table on Comparison by Product
- 6.3 Allied services - Market size and forecast 2022-2027
- Exhibit 34: Chart on Allied services - Market size and forecast 2022-2027 ($ million)
- Exhibit 35: Data Table on Allied services - Market size and forecast 2022-2027 ($ million)
- Exhibit 36: Chart on Allied services - Year-over-year growth 2022-2027 (%)
- Exhibit 37: Data Table on Allied services - Year-over-year growth 2022-2027 (%)
- 6.4 OBD port - Market size and forecast 2022-2027
- Exhibit 38: Chart on OBD port - Market size and forecast 2022-2027 ($ million)
- Exhibit 39: Data Table on OBD port - Market size and forecast 2022-2027 ($ million)
- Exhibit 40: Chart on OBD port - Year-over-year growth 2022-2027 (%)
- Exhibit 41: Data Table on OBD port - Year-over-year growth 2022-2027 (%)
- 6.5 Market opportunity by Product
- Exhibit 42: Market opportunity by Product ($ million)
7 Market Segmentation by Vehicle Type
- 7.1 Market segments
- Exhibit 43: Chart on Vehicle Type - Market share 2022-2027 (%)
- Exhibit 44: Data Table on Vehicle Type - Market share 2022-2027 (%)
- 7.2 Comparison by Vehicle Type
- Exhibit 45: Chart on Comparison by Vehicle Type
- Exhibit 46: Data Table on Comparison by Vehicle Type
- 7.3 IC engine - Market size and forecast 2022-2027
- Exhibit 47: Chart on IC engine - Market size and forecast 2022-2027 ($ million)
- Exhibit 48: Data Table on IC engine - Market size and forecast 2022-2027 ($ million)
- Exhibit 49: Chart on IC engine - Year-over-year growth 2022-2027 (%)
- Exhibit 50: Data Table on IC engine - Year-over-year growth 2022-2027 (%)
- 7.4 Electric vehicle - Market size and forecast 2022-2027
- Exhibit 51: Chart on Electric vehicle - Market size and forecast 2022-2027 ($ million)
- Exhibit 52: Data Table on Electric vehicle - Market size and forecast 2022-2027 ($ million)
- Exhibit 53: Chart on Electric vehicle - Year-over-year growth 2022-2027 (%)
- Exhibit 54: Data Table on Electric vehicle - Year-over-year growth 2022-2027 (%)
- 7.5 Market opportunity by Vehicle Type
- Exhibit 55: Market opportunity by Vehicle Type ($ million)
8 Customer Landscape
- 8.1 Customer landscape overview
- Exhibit 56: Analysis of price sensitivity, lifecycle, customer purchase basket, adoption rates, and purchase criteria
9 Geographic Landscape
- 9.1 Geographic segmentation
- Exhibit 57: Chart on Market share by geography 2022-2027 (%)
- Exhibit 58: Data Table on Market share by geography 2022-2027 (%)
- 9.2 Geographic comparison
- Exhibit 59: Chart on Geographic comparison
- Exhibit 60: Data Table on Geographic comparison
- 9.3 North America - Market size and forecast 2022-2027
- Exhibit 61: Chart on North America - Market size and forecast 2022-2027 ($ million)
- Exhibit 62: Data Table on North America - Market size and forecast 2022-2027 ($ million)
- Exhibit 63: Chart on North America - Year-over-year growth 2022-2027 (%)
- Exhibit 64: Data Table on North America - Year-over-year growth 2022-2027 (%)
- 9.4 APAC - Market size and forecast 2022-2027
- Exhibit 65: Chart on APAC - Market size and forecast 2022-2027 ($ million)
- Exhibit 66: Data Table on APAC - Market size and forecast 2022-2027 ($ million)
- Exhibit 67: Chart on APAC - Year-over-year growth 2022-2027 (%)
- Exhibit 68: Data Table on APAC - Year-over-year growth 2022-2027 (%)
- 9.5 Europe - Market size and forecast 2022-2027
- Exhibit 69: Chart on Europe - Market size and forecast 2022-2027 ($ million)
- Exhibit 70: Data Table on Europe - Market size and forecast 2022-2027 ($ million)
- Exhibit 71: Chart on Europe - Year-over-year growth 2022-2027 (%)
- Exhibit 72: Data Table on Europe - Year-over-year growth 2022-2027 (%)
- 9.6 Middle East and Africa - Market size and forecast 2022-2027
- Exhibit 73: Chart on Middle East and Africa - Market size and forecast 2022-2027 ($ million)
- Exhibit 74: Data Table on Middle East and Africa - Market size and forecast 2022-2027 ($ million)
- Exhibit 75: Chart on Middle East and Africa - Year-over-year growth 2022-2027 (%)
- Exhibit 76: Data Table on Middle East and Africa - Year-over-year growth 2022-2027 (%)
- 9.7 South America - Market size and forecast 2022-2027
- Exhibit 77: Chart on South America - Market size and forecast 2022-2027 ($ million)
- Exhibit 78: Data Table on South America - Market size and forecast 2022-2027 ($ million)
- Exhibit 79: Chart on South America - Year-over-year growth 2022-2027 (%)
- Exhibit 80: Data Table on South America - Year-over-year growth 2022-2027 (%)
- 9.8 US - Market size and forecast 2022-2027
- Exhibit 81: Chart on US - Market size and forecast 2022-2027 ($ million)
- Exhibit 82: Data Table on US - Market size and forecast 2022-2027 ($ million)
- Exhibit 83: Chart on US - Year-over-year growth 2022-2027 (%)
- Exhibit 84: Data Table on US - Year-over-year growth 2022-2027 (%)
- 9.9 China - Market size and forecast 2022-2027
- Exhibit 85: Chart on China - Market size and forecast 2022-2027 ($ million)
- Exhibit 86: Data Table on China - Market size and forecast 2022-2027 ($ million)
- Exhibit 87: Chart on China - Year-over-year growth 2022-2027 (%)
- Exhibit 88: Data Table on China - Year-over-year growth 2022-2027 (%)
- 9.10 Germany - Market size and forecast 2022-2027
- Exhibit 89: Chart on Germany - Market size and forecast 2022-2027 ($ million)
- Exhibit 90: Data Table on Germany - Market size and forecast 2022-2027 ($ million)
- Exhibit 91: Chart on Germany - Year-over-year growth 2022-2027 (%)
- Exhibit 92: Data Table on Germany - Year-over-year growth 2022-2027 (%)
- 9.11 Japan - Market size and forecast 2022-2027
- Exhibit 93: Chart on Japan - Market size and forecast 2022-2027 ($ million)
- Exhibit 94: Data Table on Japan - Market size and forecast 2022-2027 ($ million)
- Exhibit 95: Chart on Japan - Year-over-year growth 2022-2027 (%)
- Exhibit 96: Data Table on Japan - Year-over-year growth 2022-2027 (%)
- 9.12 UK - Market size and forecast 2022-2027
- Exhibit 97: Chart on UK - Market size and forecast 2022-2027 ($ million)
- Exhibit 98: Data Table on UK - Market size and forecast 2022-2027 ($ million)
- Exhibit 99: Chart on UK - Year-over-year growth 2022-2027 (%)
- Exhibit 100: Data Table on UK - Year-over-year growth 2022-2027 (%)
- 9.13 Market opportunity by geography
- Exhibit 101: Market opportunity by geography ($ million)
10 Drivers, Challenges, and Trends
- 10.1 Market drivers
- 10.2 Market challenges
- 10.3 Impact of drivers and challenges
- Exhibit 102: Impact of drivers and challenges in 2022 and 2027
- 10.4 Market trends
11 Vendor Landscape
- 11.1 Overview
- 11.2 Vendor landscape
- Exhibit 103: Overview on Criticality of inputs and Factors of differentiation
- 11.3 Landscape disruption
- Exhibit 104: Overview on factors of disruption
- 11.4 Industry risks
- Exhibit 105: Impact of key risks on business
12 Vendor Analysis
- 12.1 Vendors covered
- Exhibit 106: Vendors covered
- 12.2 Market positioning of vendors
- Exhibit 107: Matrix on vendor position and classification
- 12.3 Autel Intelligent Technology Co.
- Exhibit 108: Autel Intelligent Technology Co. - Overview
- Exhibit 109: Autel Intelligent Technology Co. - Product / Service
- Exhibit 110: Autel Intelligent Technology Co. - Key offerings
- 12.4 AVL DiTEST GmbH
- Exhibit 111: AVL DiTEST GmbH - Overview
- Exhibit 112: AVL DiTEST GmbH - Product / Service
- Exhibit 113: AVL DiTEST GmbH - Key offerings
- 12.5 Bridgestone Corp
- Exhibit 114: Bridgestone Corp - Overview
- Exhibit 115: Bridgestone Corp - Business segments
- Exhibit 116: Bridgestone Corp - Key news
- Exhibit 117: Bridgestone Corp - Key offerings
- Exhibit 118: Bridgestone Corp - Segment focus
- 12.6 Continental AG
- Exhibit 119: Continental AG - Overview
- Exhibit 120: Continental AG - Business segments
- Exhibit 121: Continental AG - Key offerings
- Exhibit 122: Continental AG - Segment focus
- 12.7 Dashboard Labs Corps.
- Exhibit 123: Dashboard Labs Corps. - Overview
- Exhibit 124: Dashboard Labs Corps. - Product / Service
- Exhibit 125: Dashboard Labs Corps. - Key offerings
- 12.8 Denso Corp.
- Exhibit 126: Denso Corp. - Overview
- Exhibit 127: Denso Corp. - Business segments
- Exhibit 128: Denso Corp. - Key news
- Exhibit 129: Denso Corp. - Key offerings
- Exhibit 130: Denso Corp. - Segment focus
- 12.9 Hearst Communications Inc.
- Exhibit 131: Hearst Communications Inc. - Overview
- Exhibit 132: Hearst Communications Inc. - Business segments
- Exhibit 133: Hearst Communications Inc. - Key news
- Exhibit 134: Hearst Communications Inc. - Key offerings
- Exhibit 135: Hearst Communications Inc. - Segment focus
- 12.10 HELLA GmbH and Co. KG
- Exhibit 136: HELLA GmbH and Co. KG - Overview
- Exhibit 137: HELLA GmbH and Co. KG - Business segments
- Exhibit 138: HELLA GmbH and Co. KG - Key offerings
- Exhibit 139: HELLA GmbH and Co. KG - Segment focus
- 12.11 Innova Electronics Corp.
- Exhibit 140: Innova Electronics Corp. - Overview
- Exhibit 141: Innova Electronics Corp. - Product / Service
- Exhibit 142: Innova Electronics Corp. - Key offerings
- 12.12 Intel Corp.
- Exhibit 143: Intel Corp. - Overview
- Exhibit 144: Intel Corp. - Business segments
- Exhibit 145: Intel Corp. - Key news
- Exhibit 146: Intel Corp. - Key offerings
- Exhibit 147: Intel Corp. - Segment focus
- 12.13 iWave Systems Technologies Pvt. Ltd.
- Exhibit 148: iWave Systems Technologies Pvt. Ltd. - Overview
- Exhibit 149: iWave Systems Technologies Pvt. Ltd. - Product / Service
- Exhibit 150: iWave Systems Technologies Pvt. Ltd. - Key offerings
- 12.14 Mercedes Benz Group AG
- Exhibit 151: Mercedes Benz Group AG - Overview
- Exhibit 152: Mercedes Benz Group AG - Business segments
- Exhibit 153: Mercedes Benz Group AG - Key offerings
- Exhibit 154: Mercedes Benz Group AG - Segment focus
- 12.15 Moj.io Inc.
- Exhibit 155: Moj.io Inc. - Overview
- Exhibit 156: Moj.io Inc. - Product / Service
- Exhibit 157: Moj.io Inc. - Key offerings
- 12.16 Robert Bosch GmbH
- Exhibit 158: Robert Bosch GmbH - Overview
- Exhibit 159: Robert Bosch GmbH - Business segments
- Exhibit 160: Robert Bosch GmbH - Key news
- Exhibit 161: Robert Bosch GmbH - Key offerings
- Exhibit 162: Robert Bosch GmbH - Segment focus
- 12.17 Zubie Inc.
- Exhibit 163: Zubie Inc. - Overview
- Exhibit 164: Zubie Inc. - Product / Service
- Exhibit 165: Zubie Inc. - Key offerings
13 Appendix
- 13.1 Scope of the report
- 13.2 Inclusions and exclusions checklist
- Exhibit 166: Inclusions checklist
- Exhibit 167: Exclusions checklist
- 13.3 Currency conversion rates for US$
- Exhibit 168: Currency conversion rates for US$
- 13.4 Research methodology
- Exhibit 169: Research methodology
- Exhibit 170: Validation techniques employed for market sizing
- Exhibit 171: Information sources
- 13.5 List of abbreviations
- Exhibit 172: List of abbreviations
Technavio is a leading global technology research and advisory company. Their research and analysis focus on emerging market trends and provide actionable insights to help businesses identify market opportunities and develop effective strategies to optimize their market positions. With over 500 specialized analysts, Technavio's report library consists of more than 17,000 reports and counting, covering 800 technologies, spanning across 50 countries. Their client base consists of enterprises of all sizes, including more than 100 Fortune 500 companies. This growing client base relies on Technavio's comprehensive coverage, extensive research, and actionable market insights to identify opportunities in existing and potential markets and assess their competitive positions within changing market scenarios.
Technavio Research
Jesse Maida
Media & Marketing Executive
US: +1 844 364 1100
UK: +44 203 893 3200
Email: [email protected]
Website: www.technavio.com/
SOURCE Technavio

Share this article