To know the exact growth variance and the Y-O-Y growth rate - Request a free sample report.
Bacterial Disease Diagnostics Market 2022-2026: Scope
Our bacterial disease diagnostics market report covers the following areas:
Bacterial Disease Diagnostics Market 2022-2026: Drivers & Challenges
The key factor driving the global bacterial disease diagnostics market growth is the integration of digital health in rapid diagnostics for bacterial disease. Vendors are focusing on developing mobile applications that support portable rapid diagnostic systems. For instance, ODK Diagnostics is a smartphone application that supports healthcare professionals by facilitating automatically interpreted test results using computer vision algorithms that can run on a mobile phone and deliver diagnostic results to healthcare professionals. Digital health connectivity is trending in the medical devices industry, as health and diagnostic-related mobile applications are widely being accepted in major developed countries such as the US, the UK, Germany, Japan, and France. Even in the low- and middle-income countries, the use of smartphones and mobile technology capabilities is getting accelerated and leading to the transformation of healthcare, as digital health technologies are improving accuracy and accessibility. Such factors will drive the market growth during the forecast period.
However, the key challenge to the global bacterial disease diagnostics market growth is the limitations of electrophoresis systems. Although electrophoresis systems have many significances, they are only suitable for macromolecules such as proteins, DNA, and RNA (ribonucleic acid) and cannot separate macromolecules such as amino acids lipids, and carbohydrates. In addition, the number of different macromolecules that can be clearly resolved is limited, even when using 2D gel electrophoresis or bigger, longer gels. Moreover, it is difficult to find the same band occurring at the same position in the gel repeatedly. Hence, these limitations of electrophoresis systems might reduce their demand for the diagnosis of bacterial diseases, which will restrict the market growth during the forecast period.
To know about more drivers, challenges along with the upcoming trends - Download a free sample now!
Bacterial Disease Diagnostics Market 2022-2026: Segmentation
- Product
- Geography
- North America
- Europe
- Asia
- Rest Of World (ROW)
Bacterial Disease Diagnostics Market 2022-2026: Revenue Generating Segment & Regional Analysis
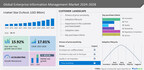
- The bacterial disease diagnostics market share growth by the instruments segment will be significant during the forecast period. The growth is attributed to the instruments being increasingly used for diagnostic laboratory procedures to determine the concentrations of several bacteria, which require validation for the accurate diagnosis of patient conditions.
- 49% of the market's growth will originate from North America during the forecast period. US and Canada are the key markets for bacterial disease diagnostics in North America. Market growth in this region will be faster than the growth of the market in Europe and ROW. The increase in the prevalence of bacterial diseases such as TB, meningitis, and pneumonia will facilitate the bacterial disease diagnostics market growth in North America over the forecast period.
To know the contribution of each segment - Download a free sample now!
Bacterial Disease Diagnostics Market 2022-2026: Key Highlights
- CAGR of the market during the forecast period 2022-2026
- Detailed information on factors that will assist bacterial disease diagnostics market growth during the next five years
- Estimation of the bacterial disease diagnostics market size and its contribution to the parent market
- Predictions on upcoming trends and changes in consumer behavior
- The growth of the bacterial disease diagnostics market
- Analysis of the market's competitive landscape and detailed information on vendors
- Comprehensive details of factors that will challenge the growth of bacterial disease diagnostics market vendors
Subscribe to our "Lite Plan" billed annually at USD 3000 which enables you to download 3 reports/year and view 3 reports/month.
Related Reports:
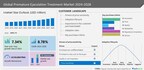
- The ear infection treatment market share is expected to increase by USD 3.67 billion from 2021 to 2026, and the market's growth momentum will accelerate at a CAGR of 5.44%. Download a free sample now!
- The bronchitis treatment market share is expected to increase by USD 1.12 billion from 2021 to 2026, and the market's growth momentum will accelerate at a CAGR of 4.76. Download a free sample now!
Bacterial Disease Diagnostics Market Scope |
Report Coverage |
Details |
Page number |
120 |
Base year |
2021 |
Forecast period |
2022-2026 |
Growth momentum & CAGR |
Accelerate at a CAGR of 6.07% |
Market growth 2022-2026 |
USD 3.29 billion |
Market structure |
Fragmented |
YoY growth (%) |
5.65 |
Performing market contribution |
North America at 49% |
Competitive landscape |
Leading companies, competitive strategies, consumer engagement scope |
Companies profiled |
Abbott Laboratories, Accelerate Diagnostics Inc., Becton Dickinson and Co., Bio Rad Laboratories Inc., bioMerieux SA, Danaher Corp., DiaSorin Molecular LLC, EKF Diagnostics Holdings Plc, GenMark Diagnostics Inc., Great Basin Scientific, Hologic Inc., Meridian Bioscience Inc., PerkinElmer Inc., QIAGEN NV, Quest Diagnostics Inc., T2 Biosystems Inc., F. Hoffmann La Roche Ltd., Siemens Healthineers AG, and Takara Bio Inc. |
Market Dynamics |
Parent market analysis, Market growth inducers and obstacles, Fast-growing and slow-growing segment analysis, COVID 19 impact and future consumer dynamics, market condition analysis for the forecast period, |
Customization purview |
If our report has not included the data that you are looking for, you can reach out to our analysts and get segments customized. |
Table Of Contents :
1 Executive Summary
- 1.1 Market overview
- Exhibit 01: Executive Summary – Chart on Market Overview
- Exhibit 02: Executive Summary – Data Table on Market Overview
- Exhibit 03: Executive Summary – Chart on Global Market Characteristics
- Exhibit 04: Executive Summary – Chart on Market by Geography
- Exhibit 05: Executive Summary – Chart on Market Segmentation by Product
- Exhibit 06: Executive Summary – Chart on Incremental Growth
- Exhibit 07: Executive Summary – Data Table on Incremental Growth
- Exhibit 08: Executive Summary – Chart on Vendor Market Positioning
2 Market Landscape
- 2.1 Market ecosystem
- Exhibit 09: Parent market
- Exhibit 10: Market Characteristics
3 Market Sizing
- 3.1 Market definition
- Exhibit 11: Offerings of vendors included in the market definition
- 3.2 Market segment analysis
- Exhibit 12: Market segments
- 3.4 Market outlook: Forecast for 2021-2026
- Exhibit 13: Chart on Global - Market size and forecast 2021-2026 ($ million)
- Exhibit 14: Data Table on Global - Market size and forecast 2021-2026 ($ million)
- Exhibit 15: Chart on Global Market: Year-over-year growth 2021-2026 (%)
- Exhibit 16: Data Table on Global Market: Year-over-year growth 2021-2026 (%)
4 Five Forces Analysis
- 4.1 Five forces summary
- Exhibit 17: Five forces analysis - Comparison between 2021 and 2026
- 4.2 Bargaining power of buyers
- Exhibit 18: Bargaining power of buyers – Impact of key factors in 2021 and 2026
- 4.3 Bargaining power of suppliers
- Exhibit 19: Bargaining power of suppliers – Impact of key factors in 2021 and 2026
- 4.4 Threat of new entrants
- Exhibit 20: Threat of new entrants – Impact of key factors in 2021 and 2026
- 4.5 Threat of substitutes
- Exhibit 21: Threat of substitutes – Impact of key factors in 2021 and 2026
- 4.6 Threat of rivalry
- Exhibit 22: Threat of rivalry – Impact of key factors in 2021 and 2026
- 4.7 Market condition
- Exhibit 23: Chart on Market condition - Five forces 2021 and 2026
5 Market Segmentation by Product
- 5.1 Market segments
- Exhibit 24: Chart on Product - Market share 2021-2026 (%)
- Exhibit 25: Data Table on Product - Market share 2021-2026 (%)
- 5.2 Comparison by Product
- Exhibit 26: Chart on Comparison by Product
- Exhibit 27: Data Table on Comparison by Product
- 5.3 Instruments - Market size and forecast 2021-2026
- Exhibit 28: Chart on Instruments - Market size and forecast 2021-2026 ($ million)
- Exhibit 29: Data Table on Instruments - Market size and forecast 2021-2026 ($ million)
- Exhibit 30: Chart on Instruments - Year-over-year growth 2021-2026 (%)
- Exhibit 31: Data Table on Instruments - Year-over-year growth 2021-2026 (%)
- 5.4 Consumables - Market size and forecast 2021-2026
- Exhibit 32: Chart on Consumables - Market size and forecast 2021-2026 ($ million)
- Exhibit 33: Data Table on Consumables - Market size and forecast 2021-2026 ($ million)
- Exhibit 34: Chart on Consumables - Year-over-year growth 2021-2026 (%)
- Exhibit 35: Data Table on Consumables - Year-over-year growth 2021-2026 (%)
- 5.5 Market opportunity by Product
- Exhibit 36: Market opportunity by Product ($ million)
6 Customer Landscape
- 6.1 Customer landscape overview
- Exhibit 37: Analysis of price sensitivity, lifecycle, customer purchase basket, adoption rates, and purchase criteria
7 Geographic Landscape
- 7.1 Geographic segmentation
- Exhibit 38: Chart on Market share by geography 2021-2026 (%)
- Exhibit 39: Data Table on Market share by geography 2021-2026 (%)
- 7.2 Geographic comparison
- Exhibit 40: Chart on Geographic comparison
- Exhibit 41: Data Table on Geographic comparison
- 7.3 North America - Market size and forecast 2021-2026
- Exhibit 42: Chart on North America - Market size and forecast 2021-2026 ($ million)
- Exhibit 43: Data Table on North America - Market size and forecast 2021-2026 ($ million)
- Exhibit 44: Chart on North America - Year-over-year growth 2021-2026 (%)
- Exhibit 45: Data Table on North America - Year-over-year growth 2021-2026 (%)
- 7.4 Europe - Market size and forecast 2021-2026
- Exhibit 46: Chart on Europe - Market size and forecast 2021-2026 ($ million)
- Exhibit 47: Data Table on Europe - Market size and forecast 2021-2026 ($ million)
- Exhibit 48: Chart on Europe - Year-over-year growth 2021-2026 (%)
- Exhibit 49: Data Table on Europe - Year-over-year growth 2021-2026 (%)
- 7.5 Asia - Market size and forecast 2021-2026
- Exhibit 50: Chart on Asia - Market size and forecast 2021-2026 ($ million)
- Exhibit 51: Data Table on Asia - Market size and forecast 2021-2026 ($ million)
- Exhibit 52: Chart on Asia - Year-over-year growth 2021-2026 (%)
- Exhibit 53: Data Table on Asia - Year-over-year growth 2021-2026 (%)
- 7.6 Rest of World (ROW) - Market size and forecast 2021-2026
- Exhibit 54: Chart on Rest of World (ROW) - Market size and forecast 2021-2026 ($ million)
- Exhibit 55: Data Table on Rest of World (ROW) - Market size and forecast 2021-2026 ($ million)
- Exhibit 56: Chart on Rest of World (ROW) - Year-over-year growth 2021-2026 (%)
- Exhibit 57: Data Table on Rest of World (ROW) - Year-over-year growth 2021-2026 (%)
- 7.7 US - Market size and forecast 2021-2026
- Exhibit 58: Chart on US - Market size and forecast 2021-2026 ($ million)
- Exhibit 59: Data Table on US - Market size and forecast 2021-2026 ($ million)
- Exhibit 60: Chart on US - Year-over-year growth 2021-2026 (%)
- Exhibit 61: Data Table on US - Year-over-year growth 2021-2026 (%)
- 7.8 Canada - Market size and forecast 2021-2026
- Exhibit 62: Chart on Canada - Market size and forecast 2021-2026 ($ million)
- Exhibit 63: Data Table on Canada - Market size and forecast 2021-2026 ($ million)
- Exhibit 64: Chart on Canada - Year-over-year growth 2021-2026 (%)
- Exhibit 65: Data Table on Canada - Year-over-year growth 2021-2026 (%)
- 7.9 Germany - Market size and forecast 2021-2026
- Exhibit 66: Chart on Germany - Market size and forecast 2021-2026 ($ million)
- Exhibit 67: Data Table on Germany - Market size and forecast 2021-2026 ($ million)
- Exhibit 68: Chart on Germany - Year-over-year growth 2021-2026 (%)
- Exhibit 69: Data Table on Germany - Year-over-year growth 2021-2026 (%)
- 7.10 UK - Market size and forecast 2021-2026
- Exhibit 70: Chart on UK - Market size and forecast 2021-2026 ($ million)
- Exhibit 71: Data Table on UK - Market size and forecast 2021-2026 ($ million)
- Exhibit 72: Chart on UK - Year-over-year growth 2021-2026 (%)
- Exhibit 73: Data Table on UK - Year-over-year growth 2021-2026 (%)
- 7.11 Japan - Market size and forecast 2021-2026
- Exhibit 74: Chart on Japan - Market size and forecast 2021-2026 ($ million)
- Exhibit 75: Data Table on Japan - Market size and forecast 2021-2026 ($ million)
- Exhibit 76: Chart on Japan - Year-over-year growth 2021-2026 (%)
- Exhibit 77: Data Table on Japan - Year-over-year growth 2021-2026 (%)
- 7.12 Market opportunity by geography
- Exhibit 78: Market opportunity by geography ($ million)
8 Drivers, Challenges, and Trends
- 8.3 Impact of drivers and challenges
- Exhibit 79: Impact of drivers and challenges in 2021 and 2026
9 Vendor Landscape
- 9.2 Vendor landscape
- Exhibit 80: Overview on Criticality of inputs and Factors of differentiation
- 9.3 Landscape disruption
- Exhibit 81: Overview on factors of disruption
- 9.4 Industry risks
- Exhibit 82: Impact of key risks on business
10 Vendor Analysis
- 10.1 Vendors covered
- Exhibit 83: Vendors covered
- 10.2 Market positioning of vendors
- Exhibit 84: Matrix on vendor position and classification
- 10.3 Abbott Laboratories
- Exhibit 85: Abbott Laboratories - Overview
- Exhibit 86: Abbott Laboratories - Business segments
- Exhibit 87: Abbott Laboratories - Key news
- Exhibit 88: Abbott Laboratories - Key offerings
- Exhibit 89: Abbott Laboratories - Segment focus
- 10.4 Bio Rad Laboratories Inc.
- Exhibit 90: Bio Rad Laboratories Inc. - Overview
- Exhibit 91: Bio Rad Laboratories Inc. - Business segments
- Exhibit 92: Bio Rad Laboratories Inc. - Key news
- Exhibit 93: Bio Rad Laboratories Inc. - Key offerings
- Exhibit 94: Bio Rad Laboratories Inc. - Segment focus
- 10.5 bioMerieux SA
- Exhibit 95: bioMerieux SA - Overview
- Exhibit 96: bioMerieux SA - Product / Service
- Exhibit 97: bioMerieux SA - Key news
- Exhibit 98: bioMerieux SA - Key offerings
- 10.6 Danaher Corp.
- Exhibit 99: Danaher Corp. - Overview
- Exhibit 100: Danaher Corp. - Business segments
- Exhibit 101: Danaher Corp. - Key news
- Exhibit 102: Danaher Corp. - Key offerings
- Exhibit 103: Danaher Corp. - Segment focus
- 10.7 EKF Diagnostics Holdings Plc
- Exhibit 104: EKF Diagnostics Holdings Plc - Overview
- Exhibit 105: EKF Diagnostics Holdings Plc - Business segments
- Exhibit 106: EKF Diagnostics Holdings Plc - Key offerings
- Exhibit 107: EKF Diagnostics Holdings Plc - Segment focus
- 10.8 F. Hoffmann La Roche Ltd.
- Exhibit 108: F. Hoffmann La Roche Ltd. - Overview
- Exhibit 109: F. Hoffmann La Roche Ltd. - Business segments
- Exhibit 110: F. Hoffmann La Roche Ltd. - Key news
- Exhibit 111: F. Hoffmann La Roche Ltd. - Key offerings
- Exhibit 112: F. Hoffmann La Roche Ltd. - Segment focus
- 10.9 PerkinElmer Inc.
- Exhibit 113: PerkinElmer Inc. - Overview
- Exhibit 114: PerkinElmer Inc. - Business segments
- Exhibit 115: PerkinElmer Inc. - Key news
- Exhibit 116: PerkinElmer Inc. - Key offerings
- Exhibit 117: PerkinElmer Inc. - Segment focus
- 10.10 QIAGEN NV
- Exhibit 118: QIAGEN NV - Overview
- Exhibit 119: QIAGEN NV - Business segments
- Exhibit 120: QIAGEN NV - Key news
- Exhibit 121: QIAGEN NV - Key offerings
- Exhibit 122: QIAGEN NV - Segment focus
- 10.11 Quest Diagnostics Inc.
- Exhibit 123: Quest Diagnostics Inc. - Overview
- Exhibit 124: Quest Diagnostics Inc. - Business segments
- Exhibit 125: Quest Diagnostics Inc. - Key offerings
- Exhibit 126: Quest Diagnostics Inc. - Segment focus
- 10.12 Takara Bio Inc.
- Exhibit 127: Takara Bio Inc. - Overview
- Exhibit 128: Takara Bio Inc. - Business segments
- Exhibit 129: Takara Bio Inc. - Key offerings
- Exhibit 130: Takara Bio Inc. - Segment focus
11 Appendix
- 11.2 Inclusions and exclusions checklist
- Exhibit 131: Inclusions checklist
- Exhibit 132: Exclusions checklist
- 11.3 Currency conversion rates for US$
- Exhibit 133: Currency conversion rates for US$
- 11.4 Research methodology
- Exhibit 134: Research methodology
- Exhibit 135: Validation techniques employed for market sizing
- Exhibit 136: Information sources
- 11.5 List of abbreviations
- Exhibit 137: List of abbreviations
About Us
Technavio is a leading global technology research and advisory company. Their research and analysis focus on emerging market trends and provides actionable insights to help businesses identify market opportunities and develop effective strategies to optimize their market positions. With over 500 specialized analysts, Technavio's report library consists of more than 17,000 reports and counting, covering 800 technologies, spanning across 50 countries. Their client base consists of enterprises of all sizes, including more than 100 Fortune 500 companies. This growing client base relies on Technavio's comprehensive coverage, extensive research, and actionable market insights to identify opportunities in existing and potential markets and assess their competitive positions within changing market scenarios.
Contact
Technavio Research
Jesse Maida
Media & Marketing Executive
US: +1 844 364 1100
UK: +44 203 893 3200
Email: [email protected]
Website: www.technavio.com/
SOURCE Technavio


Share this article