Brushed DC motors cost less when compared with brushless DC motors, which is driving the brushed DC motors market. The manufacturing of brushed DC motors is simple as these are made up of components such as rotor, commutator, stator, and brushes. The brushes slide onto the different segments on the axle of the motors, which have sleeves. Unlike the brushless DC motors, which lack brushes and have hall sensors to identify the position of the rotor, which makes the motors costly, brushed DC motors do not have any sensors and work based on electromagnetic principle. Such factors make them less expensive compared to brushless DC motors.
View market report outlook to learn more about factors influencing the market.
Brushed DC Motors Market: Key Challenges
Brushless DC motors are preferred over brushed DC motors. Brushless DC motors are more efficient than magnetic motors or induction motors due to the lack of brushes and physical commutators. Therefore, there are few chances that brushless DC motors will be damaged due to wear and tear. Brushless DC motors help overcome the problems faced in brushed DC motors and have a longer operational life. In addition, the brushed DC motors market saw a major dip in sales in 2016. Such factors are expected to negatively impact the growth of the brushed DC motors market during the forecast period.
Product Insights and News
The brushed DC motors market forecast report offers in-depth insights into key vendor profiles. The profiles include information on the production, sustainability, and prospects of the leading companies. For instance, ABB Ltd., a leading vendor offers brushed DC motors with features such as longer brush wear lengths and extended speed range capabilities. The company also designs and manufactures electric motors, drives, generators, and services, as well as offers, integrated digital powertrain solutions.
Learn more about the vendors in the market as you download your sample copy
APAC's Contribution to Brushed DC Motors Market
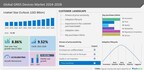
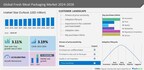
The increase in demand for motors due to their application areas such as oil and gas, metallurgy equipment, power, and chemical industries is expected to propel the brushed DC motors market in APAC. The region is expected to contribute 55% of market growth as countries such as China and Japan are the key markets for brushed DC motors market.
Download your sample copy and know more about the market contribution in APAC
Brushed DC Motors Market Scope |
Report Coverage |
Details |
Page number |
120 |
Base year |
2021 |
Forecast period |
2022-2026 |
Growth momentum & CAGR |
Decelerate at a CAGR of 7.83% |
Market growth 2022-2026 |
$ 5.45 billion |
Market structure |
Fragmented |
YoY growth (%) |
9.14 |
Regional analysis |
APAC, North America, Europe, South America, and Middle East and Africa |
Performing market contribution |
APAC at 55% |
Key consumer countries |
US, China, Japan, Germany, and UK |
Competitive landscape |
Leading companies, Competitive strategies, Consumer engagement scope |
Key companies profiled |
ABB Ltd., Allied Motion Technologies Inc., American Precision Industries Inc., AMETEK Inc., Asmo GmbH, Buhler Motor GmbH, Delta Line SA, ElectroCraft Inc., FAULHABER MICROMO LLC, Jamieson Equipment Co., Johnson Electric Holdings Ltd., Kollmorgen Corp., maxon motor AG, MinebeaMitsumi Inc., Moog Inc., Nidec Corp., Precision Microdrives Ltd., Rebeck Enterprise Co. Ltd., RS Components Pte Ltd., and Siemens AG |
Market dynamics |
Parent market analysis, Market growth inducers and obstacles, Fast-growing and slow-growing segment analysis, COVID 19 impact and recovery analysis and future consumer dynamics, Market condition analysis for forecast period |
Customization purview |
If our report has not included the data that you are looking for, you can reach out to our analysts and get segments customized. |
Get your report sample copy to unlock scope and parent market analysis insights
Vendor Insights
The report identifies the following as the dominant vendors in the market:
- ABB Ltd.
- Allied Motion Technologies Inc.
- American Precision Industries Inc.
- AMETEK Inc.
- Asmo GmbH
- Buhler Motor GmbH
- Delta Line SA
- ElectroCraft Inc.
- FAULHABER MICROMO LLC
- Jamieson Equipment Co.
- Johnson Electric Holdings Ltd.
- Kollmorgen Corp.
- Maxon motor AG
- MinebeaMitsumi Inc.
- Moog Inc.
- Nidec Corp.
- Precision Microdrives Ltd.
- Rebeck Enterprise Co. Ltd.
- RS Components Pte Ltd.
- Siemens AG
Market Segmentation
The brushed DC motors market is segmented by power rating into between 37.5 W to 750 W segment, between 750 W to 375 kW segment, and more than 375 kW segment. The 37.5 W and 750 W segment will be the major contributor to the brushed DC motors market as discrete industries such as automotive and consumer durables mostly use brushed DC motors wih power ratings between 37.5 W and 750 W as these are affordable and easy to control.
Key Highlights
- CAGR of the market during the forecast period 2022-2026
- Accurate predictions on upcoming trends and changes in consumer behavior
- Comprehensive details of factors that will challenge the growth of brushed DC motors market vendors
- Precise estimation of the brushed DC motors market size and its contribution to the parent market
- The growth of the brushed DC motors industry across APAC, North America, Europe, South America, and Middle East and Africa
- A thorough analysis of the market's competitive landscape and detailed information on vendors
Related Reports:
Micro Programmable Logic Controller (PLC) Market by Product, End-user, and Geography - Forecast and Analysis 2022-2026 Download your sample
Gas Sensors Market by Type and Geography - Forecast and Analysis 2022-2026 Download your sample
Table of Contents
1 Executive Summary
- 1.1 Market overview
- Exhibit 01: Executive Summary – Chart on Market Overview
- Exhibit 02: Executive Summary – Data Table on Market Overview
- Exhibit 03: Executive Summary – Chart on Global Market Characteristics
- Exhibit 04: Executive Summary – Chart on Market by Geography
- Exhibit 05: Executive Summary – Chart on Market Segmentation by Power Rating
- Exhibit 06: Executive Summary – Chart on Market Segmentation by End-user
- Exhibit 07: Executive Summary – Chart on Incremental Growth
- Exhibit 08: Executive Summary – Data Table on Incremental Growth
- Exhibit 09: Executive Summary – Chart on Vendor Market Positioning
2 Market Landscape
- 2.1 Market ecosystem
- Exhibit 10: Parent market
- Exhibit 11: Market Characteristics
3 Market Sizing
- 3.1 Market definition
- Exhibit 12: Offerings of vendors included in the market definition
- 3.2 Market segment analysis
- Exhibit 13: Market segments
- 3.4 Market outlook: Forecast for 2021-2026
- Exhibit 14: Chart on Global - Market size and forecast 2021-2026 ($ million)
- Exhibit 15: Data Table on Global - Market size and forecast 2021-2026 ($ million)
- Exhibit 16: Chart on Global Market: Year-over-year growth 2021-2026 (%)
- Exhibit 17: Data Table on Global Market: Year-over-year growth 2021-2026 (%)
4 Five Forces Analysis
- 4.1 Five forces summary
- Exhibit 18: Five forces analysis - Comparison between2021 and 2026
- 4.2 Bargaining power of buyers
- Exhibit 19: Chart on Bargaining power of buyers – Impact of key factors 2021 and 2026
- 4.3 Bargaining power of suppliers
- Exhibit 20: Bargaining power of suppliers – Impact of key factors in 2021 and 2026
- 4.4 Threat of new entrants
- Exhibit 21: Threat of new entrants – Impact of key factors in 2021 and 2026
- 4.5 Threat of substitutes
- Exhibit 22: Threat of substitutes – Impact of key factors in 2021 and 2026
- 4.6 Threat of rivalry
- Exhibit 23: Threat of rivalry – Impact of key factors in 2021 and 2026
- 4.7 Market condition
- Exhibit 24: Chart on Market condition - Five forces 2021 and 2026
5 Market Segmentation by Power Rating
- 5.1 Market segments
- Exhibit 25: Chart on Power Rating - Market share 2021-2026 (%)
- Exhibit 26: Data Table on Power Rating - Market share 2021-2026 (%)
- 5.2 Comparison by Power Rating
- Exhibit 27: Chart on Comparison by Power Rating
- Exhibit 28: Data Table on Comparison by Power Rating
- 5.3 Between 37.5 W and 750 W - Market size and forecast 2021-2026
- Exhibit 29: Chart on Between 37.5 W and 750 W - Market size and forecast 2021-2026 ($ million)
- Exhibit 30: Data Table on Between 37.5 W and 750 W - Market size and forecast 2021-2026 ($ million)
- Exhibit 31: Chart on Between 37.5 W and 750 W - Year-over-year growth 2021-2026 (%)
- Exhibit 32: Data Table on Between 37.5 W and 750 W - Year-over-year growth 2021-2026 (%)
- 5.4 Between 750 W and 375 kW - Market size and forecast 2021-2026
- Exhibit 33: Chart on Between 750 W and 375 kW - Market size and forecast 2021-2026 ($ million)
- Exhibit 34: Data Table on Between 750 W and 375 kW - Market size and forecast 2021-2026 ($ million)
- Exhibit 35: Chart on Between 750 W and 375 kW - Year-over-year growth 2021-2026 (%)
- Exhibit 36: Data Table on Between 750 W and 375 kW - Year-over-year growth 2021-2026 (%)
- 5.5 More than 375 kW - Market size and forecast 2021-2026
- Exhibit 37: Chart on More than 375 kW - Market size and forecast 2021-2026 ($ million)
- Exhibit 38: Data Table on More than 375 kW - Market size and forecast 2021-2026 ($ million)
- Exhibit 39: Chart on More than 375 kW - Year-over-year growth 2021-2026 (%)
- Exhibit 40: Data Table on More than 375 kW - Year-over-year growth 2021-2026 (%)
- 5.6 Market opportunity by Power Rating
- Exhibit 41: Market opportunity by Power Rating ($ million)
6 Market Segmentation by End-user
- 6.1 Market segments
- Exhibit 42: Chart on End-user - Market share 2021-2026 (%)
- Exhibit 43: Data Table on End-user - Market share 2021-2026 (%)
- 6.2 Comparison by End-user
- Exhibit 44: Chart on Comparison by End-user
- Exhibit 45: Data Table on Comparison by End-user
- 6.3 Process industry - Market size and forecast 2021-2026
- Exhibit 46: Chart on Process industry - Market size and forecast 2021-2026 ($ million)
- Exhibit 47: Data Table on Process industry - Market size and forecast 2021-2026 ($ million)
- Exhibit 48: Chart on Process industry - Year-over-year growth 2021-2026 (%)
- Exhibit 49: Data Table on Process industry - Year-over-year growth 2021-2026 (%)
- 6.4 Discrete industry - Market size and forecast 2021-2026
- Exhibit 50: Chart on Discrete industry - Market size and forecast 2021-2026 ($ million)
- Exhibit 51: Data Table on Discrete industry - Market size and forecast 2021-2026 ($ million)
- Exhibit 52: Chart on Discrete industry - Year-over-year growth 2021-2026 (%)
- Exhibit 53: Data Table on Discrete industry - Year-over-year growth 2021-2026 (%)
- 6.5 Market opportunity by End-user
- Exhibit 54: Market opportunity by End-user ($ million)
7 Customer Landscape
- 7.1 Customer landscape overview
- Exhibit 55: Analysis of price sensitivity, lifecycle, customer purchase basket, adoption rates, and purchase criteria
8 Geographic Landscape
- 8.1 Geographic segmentation
- Exhibit 56: Chart on Market share by geography 2021-2026 (%)
- Exhibit 57: Data Table on Market share by geography 2021-2026 (%)
- 8.2 Geographic comparison
- Exhibit 58: Chart on Geographic comparison
- Exhibit 59: Data Table on Geographic comparison
- 8.3 APAC - Market size and forecast 2021-2026
- Exhibit 60: Chart on APAC - Market size and forecast 2021-2026 ($ million)
- Exhibit 61: Data Table on APAC - Market size and forecast 2021-2026 ($ million)
- Exhibit 62: Chart on APAC - Year-over-year growth 2021-2026 (%)
- Exhibit 63: Data Table on APAC - Year-over-year growth 2021-2026 (%)
- 8.4 North America - Market size and forecast 2021-2026
- Exhibit 64: Chart on North America - Market size and forecast 2021-2026 ($ million)
- Exhibit 65: Data Table on North America - Market size and forecast 2021-2026 ($ million)
- Exhibit 66: Chart on North America - Year-over-year growth 2021-2026 (%)
- Exhibit 67: Data Table on North America - Year-over-year growth 2021-2026 (%)
- 8.5 Europe - Market size and forecast 2021-2026
- Exhibit 68: Chart on Europe - Market size and forecast 2021-2026 ($ million)
- Exhibit 69: Data Table on Europe - Market size and forecast 2021-2026 ($ million)
- Exhibit 70: Chart on Europe - Year-over-year growth 2021-2026 (%)
- Exhibit 71: Data Table on Europe - Year-over-year growth 2021-2026 (%)
- 8.6 South America - Market size and forecast 2021-2026
- Exhibit 72: Chart on South America - Market size and forecast 2021-2026 ($ million)
- Exhibit 73: Data Table on South America - Market size and forecast 2021-2026 ($ million)
- Exhibit 74: Chart on South America - Year-over-year growth 2021-2026 (%)
- Exhibit 75: Data Table on South America - Year-over-year growth 2021-2026 (%)
- 8.7 Middle East and Africa - Market size and forecast 2021-2026
- Exhibit 76: Chart on Middle East and Africa - Market size and forecast 2021-2026 ($ million)
- Exhibit 77: Data Table on Middle East and Africa - Market size and forecast 2021-2026 ($ million)
- Exhibit 78: Chart on Middle East and Africa - Year-over-year growth 2021-2026 (%)
- Exhibit 79: Data Table on Middle East and Africa - Year-over-year growth 2021-2026 (%)
- 8.8 China - Market size and forecast 2021-2026
- Exhibit 80: Chart on China - Market size and forecast 2021-2026 ($ million)
- Exhibit 81: Data Table on China - Market size and forecast 2021-2026 ($ million)
- Exhibit 82: Chart on China - Year-over-year growth 2021-2026 (%)
- Exhibit 83: Data Table on China - Year-over-year growth 2021-2026 (%)
- 8.9 US - Market size and forecast 2021-2026
- Exhibit 84: Chart on US - Market size and forecast 2021-2026 ($ million)
- Exhibit 85: Data Table on US - Market size and forecast 2021-2026 ($ million)
- Exhibit 86: Chart on US - Year-over-year growth 2021-2026 (%)
- Exhibit 87: Data Table on US - Year-over-year growth 2021-2026 (%)
- 8.10 Japan - Market size and forecast 2021-2026
- Exhibit 88: Chart on Japan - Market size and forecast 2021-2026 ($ million)
- Exhibit 89: Data Table on Japan - Market size and forecast 2021-2026 ($ million)
- Exhibit 90: Chart on Japan - Year-over-year growth 2021-2026 (%)
- Exhibit 91: Data Table on Japan - Year-over-year growth 2021-2026 (%)
- 8.11 Germany - Market size and forecast 2021-2026
- Exhibit 92: Chart on Germany - Market size and forecast 2021-2026 ($ million)
- Exhibit 93: Data Table on Germany - Market size and forecast 2021-2026 ($ million)
- Exhibit 94: Chart on Germany - Year-over-year growth 2021-2026 (%)
- Exhibit 95: Data Table on Germany - Year-over-year growth 2021-2026 (%)
- 8.12 UK - Market size and forecast 2021-2026
- Exhibit 96: Chart on UK - Market size and forecast 2021-2026 ($ million)
- Exhibit 97: Data Table on UK - Market size and forecast 2021-2026 ($ million)
- Exhibit 98: Chart on UK - Year-over-year growth 2021-2026 (%)
- Exhibit 99: Data Table on UK - Year-over-year growth 2021-2026 (%)
- 8.13 Market opportunity by geography
- Exhibit 100: Market opportunity by geography ($ million)
9 Drivers, Challenges, and Trends
- 9.3 Impact of drivers and challenges
- Exhibit 101: Impact of drivers and challenges in 2021 and 2026
10 Vendor Landscape
- 10.2 Vendor landscape
- Exhibit 102: Overview on Criticality of inputs and Factors of differentiation
- 10.3 Landscape disruption
- Exhibit 103: Overview on factors of disruption
- 10.4 Industry risks
- Exhibit 104: Impact of key risks on business
11 Vendor Analysis
- 11.1 Vendors covered
- Exhibit 105: Vendors covered
- 11.2 Market positioning of vendors
- Exhibit 106: Matrix on vendor position and classification
- 11.3 ABB Ltd.
- Exhibit 107: ABB Ltd. - Overview
- Exhibit 108: ABB Ltd. - Business segments
- Exhibit 109: ABB Ltd. - Key offerings
- Exhibit 110: ABB Ltd. - Segment focus
- 11.4 Allied Motion Technologies Inc.
- Exhibit 111: Allied Motion Technologies Inc. - Overview
- Exhibit 112: Allied Motion Technologies Inc. - Business segments
- Exhibit 113: Allied Motion Technologies Inc. - Key offerings
- Exhibit 114: Allied Motion Technologies Inc. - Segment focus
- 11.5 AMETEK Inc.
- Exhibit 115: AMETEK Inc. - Overview
- Exhibit 116: AMETEK Inc. - Business segments
- Exhibit 117: AMETEK Inc. - Key offerings
- Exhibit 118: AMETEK Inc. - Segment focus
- 11.6 Asmo GmbH
- Exhibit 119: Asmo GmbH - Overview
- Exhibit 120: Asmo GmbH - Product / Service
- Exhibit 121: Asmo GmbH - Key offerings
- 11.7 FAULHABER MICROMO LLC
- Exhibit 122: FAULHABER MICROMO LLC - Overview
- Exhibit 123: FAULHABER MICROMO LLC - Product / Service
- Exhibit 124: FAULHABER MICROMO LLC - Key news
- Exhibit 125: FAULHABER MICROMO LLC - Key offerings
- 11.8 Johnson Electric Holdings Ltd.
- Exhibit 126: Johnson Electric Holdings Ltd. - Overview
- Exhibit 127: Johnson Electric Holdings Ltd. - Business segments
- Exhibit 128: Johnson Electric Holdings Ltd. - Key offerings
- Exhibit 129: Johnson Electric Holdings Ltd. - Segment focus
- 11.9 maxon motor AG
- Exhibit 130: maxon motor AG - Overview
- Exhibit 131: maxon motor AG - Product / Service
- Exhibit 132: maxon motor AG - Key offerings
- 11.10 MinebeaMitsumi Inc.
- Exhibit 133: MinebeaMitsumi Inc. - Overview
- Exhibit 134: MinebeaMitsumi Inc. - Business segments
- Exhibit 135: MinebeaMitsumi Inc. - Key news
- Exhibit 136: MinebeaMitsumi Inc. - Key offerings
- Exhibit 137: MinebeaMitsumi Inc. - Segment focus
- 11.11 Nidec Corp.
- Exhibit 138: Nidec Corp. - Overview
- Exhibit 139: Nidec Corp. - Business segments
- Exhibit 140: Nidec Corp. - Key news
- Exhibit 141: Nidec Corp. - Key offerings
- Exhibit 142: Nidec Corp. - Segment focus
- 11.12 Siemens AG
- Exhibit 143: Siemens AG - Overview
- Exhibit 144: Siemens AG - Business segments
- Exhibit 145: Siemens AG - Key news
- Exhibit 146: Siemens AG - Key offerings
- Exhibit 147: Siemens AG - Segment focus
12 Appendix
- 12.2 Inclusions and exclusions checklist
- Exhibit 148: Inclusions checklist
- Exhibit 149: Exclusions checklist
- 12.3 Currency conversion rates for US$
- Exhibit 150: Currency conversion rates for US$
- 12.4 Research methodology
- Exhibit 151: Research methodology
- Exhibit 152: Validation techniques employed for market sizing
- Exhibit 153: Information sources
- 12.5 List of abbreviations
- Exhibit 154: List of abbreviations
About Us
Technavio is a leading global technology research and advisory company. Their research and analysis focus on emerging market trends and provide actionable insights to help businesses identify market opportunities and develop effective strategies to optimize their market positions. With over 500 specialized analysts, Technavio's report library and its client base consist of enterprises of all sizes, including more than 100 Fortune 500 companies. This growing client base relies on Technavio's comprehensive coverage, extensive research, and actionable market insights to identify opportunities in existing and potential markets and assess their competitive positions within changing market scenarios.
Contact
Technavio Research
Jesse Maida
Media & Marketing Executive
US: +1 844 364 1100
UK: +44 203 893 3200
Email:[email protected]
Website: www.technavio.com/
SOURCE Technavio


Share this article