Dark Fiber Market Size to Grow by USD 3.94 Bn, Vendors to Deploy Organic and Inorganic Growth Strategies - Technavio

NEW YORK, Oct. 17, 2022 /PRNewswire/ -- The dark fiber market is fragmented, and the vendors are deploying inorganic and organic growth strategies to compete in the market. The competition among vendors is high due to evolving standards, significant changes in smart technologies, rising product awareness among end users, and product launches. Vendors are focusing on launching new and innovative products, cost-effective production cycles, and technological developments.
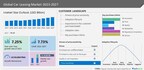
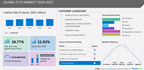
The dark fiber market size is expected to grow by USD 3.94 billion from 2021 to 2026. In addition, the growth momentum of the market will accelerate at a CAGR of 11.34% during the forecast period, according to Technavio.
The report offers an up-to-date analysis regarding the overall market environment, the latest trends and drivers, and the current market scenario. Request Latest FREE PDF Sample Report
Dark Fiber Market 2022-2026: Scope
The dark fiber market report includes the following areas:
Subscribe to our "Basic Plan" billed annually at USD 5000 that enables you to download 5 reports and view 100 reports every month
Dark Fiber Market 2022-2026: Segmentation
- Service
- Long-haul Services
- Short-haul Services
- Colocation Facilities Services
- Type
- Multi-mode
- Single-mode
- Geography
- North America
- Europe
- APAC
- Middle East And Africa
- South America
Dark Fiber Market 2022-2026: Revenue-generating Service Segment
The long-haul services segment will be the largest contributor to market growth during the forecast period. The growth of the market is attributed to factors such as the rising investments in long-haul dark fiber network infrastructure to expand network capacity using dark fiber connectivity.
Dark Fiber Market 2022-2026: Regional Analysis
North America will account for 38% of the market's growth during the forecast period. This growth is attributed to factors such as the implementation of automation, increasing investments in smart city initiatives, the rise in the use of IoT, and the growing use of social networking platforms. However, market growth in this region will be slower than the growth of the market in Europe and APAC. The US is the key country for the dark fiber market in North America.
Dark Fiber Market 2022-2026: Vendor Analysis
AT and T Inc., AiNET, Consolidated Communications Holdings Inc, Colt Technology Services Group Ltd., Crown Castle International Corp, Conterra Ultra Broadband LLC, Eurofiber Nederland B.V., Fatbeam LLC, DataWeb BV, FiberLight LLC, Fibrenoire Inc., GTT Communications Inc., Frontier Communications Parent Inc, Neos Network Ltd, Lumen Technologies Inc., Sterlite Power Transmission Ltd, NTT Communications Corp., Windstream Intellectual Property Services LLC, Verizon Communications Inc., and Zayo Group LLC are among some of the major market participants.
Find key strategic initiatives used by vendors, along with the latest developments and key news. View our FREE PDF Sample Report Now
Dark Fiber Market 2022-2026: Key Highlights
- CAGR of the market during 2022-2026
- Detailed information on factors that will help the dark fiber market grow during the next five years
- Estimation of the size of the dark fiber market and its contribution to the parent market
- Forecasts on upcoming trends and changes in consumer behavior
- The growth of the dark fiber market
- Analysis of the competitive landscape and detailed information on vendors
- Comprehensive details of factors that will impede the growth of the dark fiber market vendors
Related Reports
Active Optical Cable Market by End-user and Geography - Forecast and Analysis 2022-2026: The active optical cable market share is expected to increase by USD 5.78 billion from 2021 to 2026.
Broadcasting Cable TV Market by Revenue Stream, Application, and Geography - Forecast and Analysis 2022-2026: The broadcasting cable TV market size is projected to grow by USD 62 billion from 2021 to 2026.
Dark Fiber Market Scope |
|
Report Coverage |
Details |
Page number |
120 |
Base year |
2021 |
Forecast period |
2022-2026 |
Growth momentum & CAGR |
Accelerate at a CAGR of 11.34% |
Market growth 2022-2026 |
USD 3.94 billion |
Market structure |
Fragmented |
YoY growth (%) |
9.45 |
Regional analysis |
North America, Europe, APAC, Middle East and Africa, and South America |
Performing market contribution |
North America at 38% |
Key consumer countries |
US, China, UK, France, and Germany |
Competitive landscape |
Leading companies, competitive strategies, consumer engagement scope |
Companies profiled |
AiNET, AT and T Inc., Colt Technology Services Group Ltd., Consolidated Communications Holdings Inc, Conterra Ultra Broadband LLC, Crown Castle International Corp, DataWeb BV, Eurofiber Nederland B.V., Fatbeam LLC, FiberLight LLC, Fibrenoire Inc., Frontier Communications Parent Inc, GTT Communications Inc., Lumen Technologies Inc., Neos Network Ltd, NTT Communications Corp., Sterlite Power Transmission Ltd, Verizon Communications Inc., Windstream Intellectual Property Services LLC, and Zayo Group LLC |
Market Dynamics |
Parent market analysis, market growth inducers and obstacles, fast-growing and slow-growing segment analysis, COVID-19 impact and future consumer dynamics, and market condition analysis for the forecast period. |
Customization purview |
If our report has not included the data that you are looking for, you can reach out to our analysts and get segments customized. |
Browse Communication Services Market Reports
Table of Contents
1 Executive Summary
- 1.1 Market overview
- Exhibit 01: Executive Summary – Chart on Market Overview
- Exhibit 02: Executive Summary – Data Table on Market Overview
- Exhibit 03: Executive Summary – Chart on Global Market Characteristics
- Exhibit 04: Executive Summary – Chart on Market by Geography
- Exhibit 05: Executive Summary – Chart on Market Segmentation by Service
- Exhibit 06: Executive Summary – Chart on Market Segmentation by Type
- Exhibit 07: Executive Summary – Chart on Incremental Growth
- Exhibit 08: Executive Summary – Data Table on Incremental Growth
- Exhibit 09: Executive Summary – Chart on Vendor Market Positioning
2 Market Landscape
- 2.1 Market ecosystem
- Exhibit 10: Parent market
- Exhibit 11: Market Characteristics
3 Market Sizing
- 3.1 Market definition
- Exhibit 12: Offerings of vendors included in the market definition
- 3.2 Market segment analysis
- Exhibit 13: Market segments
- 3.3 Market size 2021
- 3.4 Market outlook: Forecast for 2021-2026
- Exhibit 14: Chart on Global - Market size and forecast 2021-2026 ($ million)
- Exhibit 15: Data Table on Global - Market size and forecast 2021-2026 ($ million)
- Exhibit 16: Chart on Global Market: Year-over-year growth 2021-2026 (%)
- Exhibit 17: Data Table on Global Market: Year-over-year growth 2021-2026 (%)
4 Five Forces Analysis
- 4.1 Five forces summary
- Exhibit 18: Five forces analysis - Comparison between 2021 and 2026
- 4.2 Bargaining power of buyers
- Exhibit 19: Chart on Bargaining power of buyers – Impact of key factors 2021 and 2026
- 4.3 Bargaining power of suppliers
- Exhibit 20: Bargaining power of suppliers – Impact of key factors in 2021 and 2026
- 4.4 Threat of new entrants
- Exhibit 21: Threat of new entrants – Impact of key factors in 2021 and 2026
- 4.5 Threat of substitutes
- Exhibit 22: Threat of substitutes – Impact of key factors in 2021 and 2026
- 4.6 Threat of rivalry
- Exhibit 23: Threat of rivalry – Impact of key factors in 2021 and 2026
- 4.7 Market condition
- Exhibit 24: Chart on Market condition - Five forces 2021 and 2026
5 Market Segmentation by Service
- 5.1 Market segments
- Exhibit 25: Chart on Service - Market share 2021-2026 (%)
- Exhibit 26: Data Table on Service - Market share 2021-2026 (%)
- 5.2 Comparison by Service
- Exhibit 27: Chart on Comparison by Service
- Exhibit 28: Data Table on Comparison by Service
- 5.3 Long-haul services - Market size and forecast 2021-2026
- Exhibit 29: Chart on Long-haul services - Market size and forecast 2021-2026 ($ million)
- Exhibit 30: Data Table on Long-haul services - Market size and forecast 2021-2026 ($ million)
- Exhibit 31: Chart on Long-haul services - Year-over-year growth 2021-2026 (%)
- Exhibit 32: Data Table on Long-haul services - Year-over-year growth 2021-2026 (%)
- 5.4 Short-haul services - Market size and forecast 2021-2026
- Exhibit 33: Chart on Short-haul services - Market size and forecast 2021-2026 ($ million)
- Exhibit 34: Data Table on Short-haul services - Market size and forecast 2021-2026 ($ million)
- Exhibit 35: Chart on Short-haul services - Year-over-year growth 2021-2026 (%)
- Exhibit 36: Data Table on Short-haul services - Year-over-year growth 2021-2026 (%)
- 5.5 Colocation facilities services - Market size and forecast 2021-2026
- Exhibit 37: Chart on Colocation facilities services - Market size and forecast 2021-2026 ($ million)
- Exhibit 38: Data Table on Colocation facilities services - Market size and forecast 2021-2026 ($ million)
- Exhibit 39: Chart on Colocation facilities services - Year-over-year growth 2021-2026 (%)
- Exhibit 40: Data Table on Colocation facilities services - Year-over-year growth 2021-2026 (%)
- 5.6 Market opportunity by Service
- Exhibit 41: Market opportunity by Service ($ million)
6 Market Segmentation by Type
- 6.1 Market segments
- Exhibit 42: Chart on Type - Market share 2021-2026 (%)
- Exhibit 43: Data Table on Type - Market share 2021-2026 (%)
- 6.2 Comparison by Type
- Exhibit 44: Chart on Comparison by Type
- Exhibit 45: Data Table on Comparison by Type
- 6.3 Multi-mode - Market size and forecast 2021-2026
- Exhibit 46: Chart on Multi-mode - Market size and forecast 2021-2026 ($ million)
- Exhibit 47: Data Table on Multi-mode - Market size and forecast 2021-2026 ($ million)
- Exhibit 48: Chart on Multi-mode - Year-over-year growth 2021-2026 (%)
- Exhibit 49: Data Table on Multi-mode - Year-over-year growth 2021-2026 (%)
- 6.4 Single-mode - Market size and forecast 2021-2026
- Exhibit 50: Chart on Single-mode - Market size and forecast 2021-2026 ($ million)
- Exhibit 51: Data Table on Single-mode - Market size and forecast 2021-2026 ($ million)
- Exhibit 52: Chart on Single-mode - Year-over-year growth 2021-2026 (%)
- Exhibit 53: Data Table on Single-mode - Year-over-year growth 2021-2026 (%)
- 6.5 Market opportunity by Type
- Exhibit 54: Market opportunity by Type ($ million)
7 Customer Landscape
- 7.1 Customer landscape overview
- Exhibit 55: Analysis of price sensitivity, lifecycle, customer purchase basket, adoption rates, and purchase criteria
8 Geographic Landscape
- 8.1 Geographic segmentation
- Exhibit 56: Chart on Market share by geography 2021-2026 (%)
- Exhibit 57: Data Table on Market share by geography 2021-2026 (%)
- 8.2 Geographic comparison
- Exhibit 58: Chart on Geographic comparison
- Exhibit 59: Data Table on Geographic comparison
- 8.3 North America - Market size and forecast 2021-2026
- Exhibit 60: Chart on North America - Market size and forecast 2021-2026 ($ million)
- Exhibit 61: Data Table on North America - Market size and forecast 2021-2026 ($ million)
- Exhibit 62: Chart on North America - Year-over-year growth 2021-2026 (%)
- Exhibit 63: Data Table on North America - Year-over-year growth 2021-2026 (%)
- 8.4 Europe - Market size and forecast 2021-2026
- Exhibit 64: Chart on Europe - Market size and forecast 2021-2026 ($ million)
- Exhibit 65: Data Table on Europe - Market size and forecast 2021-2026 ($ million)
- Exhibit 66: Chart on Europe - Year-over-year growth 2021-2026 (%)
- Exhibit 67: Data Table on Europe - Year-over-year growth 2021-2026 (%)
- 8.5 APAC - Market size and forecast 2021-2026
- Exhibit 68: Chart on APAC - Market size and forecast 2021-2026 ($ million)
- Exhibit 69: Data Table on APAC - Market size and forecast 2021-2026 ($ million)
- Exhibit 70: Chart on APAC - Year-over-year growth 2021-2026 (%)
- Exhibit 71: Data Table on APAC - Year-over-year growth 2021-2026 (%)
- 8.6 Middle East and Africa - Market size and forecast 2021-2026
- Exhibit 72: Chart on Middle East and Africa - Market size and forecast 2021-2026 ($ million)
- Exhibit 73: Data Table on Middle East and Africa - Market size and forecast 2021-2026 ($ million)
- Exhibit 74: Chart on Middle East and Africa - Year-over-year growth 2021-2026 (%)
- Exhibit 75: Data Table on Middle East and Africa - Year-over-year growth 2021-2026 (%)
- 8.7 South America - Market size and forecast 2021-2026
- Exhibit 76: Chart on South America - Market size and forecast 2021-2026 ($ million)
- Exhibit 77: Data Table on South America - Market size and forecast 2021-2026 ($ million)
- Exhibit 78: Chart on South America - Year-over-year growth 2021-2026 (%)
- Exhibit 79: Data Table on South America - Year-over-year growth 2021-2026 (%)
- 8.8 US - Market size and forecast 2021-2026
- Exhibit 80: Chart on US - Market size and forecast 2021-2026 ($ million)
- Exhibit 81: Data Table on US - Market size and forecast 2021-2026 ($ million)
- Exhibit 82: Chart on US - Year-over-year growth 2021-2026 (%)
- Exhibit 83: Data Table on US - Year-over-year growth 2021-2026 (%)
- 8.9 UK - Market size and forecast 2021-2026
- Exhibit 84: Chart on UK - Market size and forecast 2021-2026 ($ million)
- Exhibit 85: Data Table on UK - Market size and forecast 2021-2026 ($ million)
- Exhibit 86: Chart on UK - Year-over-year growth 2021-2026 (%)
- Exhibit 87: Data Table on UK - Year-over-year growth 2021-2026 (%)
- 8.10 China - Market size and forecast 2021-2026
- Exhibit 88: Chart on China - Market size and forecast 2021-2026 ($ million)
- Exhibit 89: Data Table on China - Market size and forecast 2021-2026 ($ million)
- Exhibit 90: Chart on China - Year-over-year growth 2021-2026 (%)
- Exhibit 91: Data Table on China - Year-over-year growth 2021-2026 (%)
- 8.11 France - Market size and forecast 2021-2026
- Exhibit 92: Chart on France - Market size and forecast 2021-2026 ($ million)
- Exhibit 93: Data Table on France - Market size and forecast 2021-2026 ($ million)
- Exhibit 94: Chart on France - Year-over-year growth 2021-2026 (%)
- Exhibit 95: Data Table on France - Year-over-year growth 2021-2026 (%)
- 8.12 Germany - Market size and forecast 2021-2026
- Exhibit 96: Chart on Germany - Market size and forecast 2021-2026 ($ million)
- Exhibit 97: Data Table on Germany - Market size and forecast 2021-2026 ($ million)
- Exhibit 98: Chart on Germany - Year-over-year growth 2021-2026 (%)
- Exhibit 99: Data Table on Germany - Year-over-year growth 2021-2026 (%)
- 8.13 Market opportunity by geography
- Exhibit 100: Market opportunity by geography ($ million)
9 Drivers, Challenges, and Trends
- 9.1 Market drivers
- 9.2 Market challenges
- 9.3 Impact of drivers and challenges
- Exhibit 101: Impact of drivers and challenges in 2021 and 2026
- 9.4 Market trends
10 Vendor Landscape
- 10.1 Overview
- 10.2 Vendor landscape
- Exhibit 102: Overview on Criticality of inputs and Factors of differentiation
- 10.3 Landscape disruption
- Exhibit 103: Overview on factors of disruption
- 10.4 Industry risks
- Exhibit 104: Impact of key risks on business
11 Vendor Analysis
- 11.1 Vendors covered
- Exhibit 105: Vendors covered
- 11.2 Market positioning of vendors
- Exhibit 106: Matrix on vendor position and classification
- 11.3 AT and T Inc.
- Exhibit 107: AT and T Inc. - Overview
- Exhibit 108: AT and T Inc. - Business segments
- Exhibit 109: AT and T Inc. - Key offerings
- Exhibit 110: AT and T Inc. - Segment focus
- 11.4 Colt Technology Services Group Ltd.
- Exhibit 111: Colt Technology Services Group Ltd. - Overview
- Exhibit 112: Colt Technology Services Group Ltd. - Product / Service
- Exhibit 113: Colt Technology Services Group Ltd. - Key offerings
- 11.5 Consolidated Communications Holdings Inc
- Exhibit 114: Consolidated Communications Holdings Inc - Overview
- Exhibit 115: Consolidated Communications Holdings Inc - Business segments
- Exhibit 116: Consolidated Communications Holdings Inc - Key news
- Exhibit 117: Consolidated Communications Holdings Inc - Key offerings
- Exhibit 118: Consolidated Communications Holdings Inc - Segment focus
- 11.6 GTT Communications Inc.
- Exhibit 119: GTT Communications Inc. - Overview
- Exhibit 120: GTT Communications Inc. - Product / Service
- Exhibit 121: GTT Communications Inc. - Key offerings
- 11.7 Lumen Technologies Inc.
- Exhibit 122: Lumen Technologies Inc. - Overview
- Exhibit 123: Lumen Technologies Inc. - Business segments
- Exhibit 124: Lumen Technologies Inc. - Key offerings
- Exhibit 125: Lumen Technologies Inc. - Segment focus
- 11.8 Neos Network Ltd
- Exhibit 126: Neos Network Ltd - Overview
- Exhibit 127: Neos Network Ltd - Product / Service
- Exhibit 128: Neos Network Ltd - Key offerings
- 11.9 NTT Communications Corp.
- Exhibit 129: NTT Communications Corp. - Overview
- Exhibit 130: NTT Communications Corp. - Product / Service
- Exhibit 131: NTT Communications Corp. - Key news
- Exhibit 132: NTT Communications Corp. - Key offerings
- 11.10 Verizon Communications Inc.
- Exhibit 133: Verizon Communications Inc. - Overview
- Exhibit 134: Verizon Communications Inc. - Business segments
- Exhibit 135: Verizon Communications Inc. - Key offerings
- Exhibit 136: Verizon Communications Inc. - Segment focus
- 11.11 Windstream Intellectual Property Services LLC
- Exhibit 137: Windstream Intellectual Property Services LLC - Overview
- Exhibit 138: Windstream Intellectual Property Services LLC - Product / Service
- Exhibit 139: Windstream Intellectual Property Services LLC - Key offerings
- 11.12 Zayo Group LLC
- Exhibit 140: Zayo Group LLC - Overview
- Exhibit 141: Zayo Group LLC - Product / Service
- Exhibit 142: Zayo Group LLC - Key news
- Exhibit 143: Zayo Group LLC - Key offerings
12 Appendix
- 12.1 Scope of the report
- 12.2 Inclusions and exclusions checklist
- Exhibit 144: Inclusions checklist
- Exhibit 145: Exclusions checklist
- 12.3 Currency conversion rates for US$
- Exhibit 146: Currency conversion rates for US$
- 12.4 Research methodology
- Exhibit 147: Research methodology
- Exhibit 148: Validation techniques employed for market sizing
- Exhibit 149: Information sources
- 12.5 List of abbreviations
- Exhibit 150: List of abbreviations
Technavio is a leading global technology research and advisory company. Their research and analysis focus on emerging market trends and provide actionable insights to help businesses identify market opportunities and develop effective strategies to optimize their market positions. With over 500 specialized analysts, Technavio's report library consists of more than 17,000 reports and counting, covering 800 technologies, spanning across 50 countries. Their client base consists of enterprises of all sizes, including more than 100 Fortune 500 companies. This growing client base relies on Technavio's comprehensive coverage, extensive research, and actionable market insights to identify opportunities in existing and potential markets and assess their competitive positions within changing market scenarios.
Contact
Technavio Research
Jesse Maida
Media & Marketing Executive
US: +1 844 364 1100
UK: +44 203 893 3200
Email: [email protected]
Website: www.technavio.com/
SOURCE Technavio


Share this article