Data Center UPS Market Size to Grow by USD 3.2 Bn, Increase in Adoption of Modular UPS Systems to Boost Market Growth - Technavio

NEW YORK, Oct. 26, 2022 /PRNewswire/ -- The "Data Center UPS Market by Product, Application, and Geography - Forecast and Analysis 2022-2026" report has been added to Technavio's offering. With ISO 9001:2015 certification, Technavio is proudly partnering with more than 100 Fortune 500 companies for over 16 years.
The potential growth difference for the data center UPS market size between 2021 and 2026 is USD 3.2 billion. To get the exact yearly growth variance and the Y-O-Y growth rate, Request a FREE PDF Sample Report
- Market Driver: The increase in the adoption of modular UPS systems is driving the global data center UPS market growth. Modern data center designs can be categorized into centralized UPS, zone UPS, and rack-mount systems. They vary in terms of capacity and size based on the installed location and the requirements of enterprise data center facilities. Modular systems have lower capacity and are less expensive, and additional modules can be installed based on the requirements.
- Market Challenge: UPS battery failure is a major challenge for market growth. UPS battery failure increases downtime and is considered one of the root causes of downtime in data centers. Data center operators depend on power utilities for electricity supply due to power fluctuations. Downtime can cost up to USD 500,000 per hour for data center operators. Data center operators face serious issues due to battery failures, such as monetary losses. These issues are expected to hinder market growth during the forecast period.
To learn about additional key drivers, trends, and challenges available with Technavio, Read our FREE Sample Report!
The data center UPS market is fragmented, characterized by the presence of many global, regional, and local vendors. The vendors are deploying organic and inorganic growth strategies to compete in the market. Increased competition, frequent changes in government policies, rapid advances in technology, and environmental regulations are driving market growth. The competition is expected to increase during the forecast period, with the entry of new vendors, an increase in technological innovations, and a rising number of partnerships among vendors and research organizations. Moreover, vendors are expanding their geographical presence and entering into partnerships and contracts with end-users. Regional vendors compete with key vendors by offering products at lower prices.
Get lifetime access to our Technavio Insights! Subscribe to our Basic Plan billed annually at USD 5000
The data center UPS market report is segmented by product (centralized UPS, zone UPS, and rack-mount UPS), Application (tier 3 data center, tier 1 and 2 data center, and tier 4 data center), and geography (North America, Europe, APAC, South America, and Middle East and Africa). North America will be the leading region with 29% of the market's growth during the forecast period. The US is the key country for the data center UPS market in North America.
Find additional insights into the contribution of all the segments and regional opportunities in the report. Buy Now to gain access to detailed segment information
- ABB Ltd.
- AMETEK IntelliPower Inc.
- Belkin International Inc.
- Delta Electronics Inc.
- Eaton Corp. Plc
- General Electric Co
- Huawei Technologies Co. Ltd.
- Langley Holdings Plc
- Legrand SA
- Metartec Ltd.
- Mitsubishi Electric Corp.
- Panduit Corp.
- Power Innovations International Inc.
- Riello Elettronica Group
- Schneider Electric SE
- Shenzhen Kstar Science and Technology Co. Ltd.
- SOCOMEC Group
- TOSHIBA CORP
- Vertiv Holdings Co.
- Xiamen Kehua Hengsheng Co. Ltd.
Want your report customized? Speak to an analyst and personalize your report according to your needs
Data Center Colocation Market by Type and Geography - Forecast and Analysis 2022-2026: Innovative approaches such as submarine data centers are a trend. Traditional data centers generate a lot of heat. Many service providers are trying to change the location of data centers to cooler countries to save investment in power and cooling systems.
Data center Colocation and Managed Hosting Services Market by End-user and Geography - Forecast and Analysis 2022-2026: Growing investments in hyper-scale data centers by colocation providers are a trend. The construction of hyper-scale data centers will help manage the growing information processing needs of a smart revolution and a connected world. Many colocation service providers and infrastructure service providers have announced that they are offering hyper-scale data centers.
Data Center UPS Market Scope |
|
Report Coverage |
Details |
Page number |
120 |
Base year |
2021 |
Forecast period |
2022-2026 |
Growth momentum & CAGR |
Accelerate at a CAGR of over 8.66% |
Market growth 2022-2026 |
USD 3.2 billion |
Market structure |
Fragmented |
YoY growth (%) |
8.32 |
Regional analysis |
North America, Europe, APAC, South America, and Middle East and Africa |
Performing market contribution |
North America at 29% |
Key consumer countries |
US, China, Australia, Japan, and UK |
Competitive landscape |
Leading companies, competitive strategies, consumer engagement scope |
Companies profiled |
ABB Ltd., AMETEK IntelliPower Inc., Belkin International Inc., Delta Electronics Inc., Eaton Corp. Plc, General Electric Co, Huawei Technologies Co. Ltd., Langley Holdings Plc, Legrand SA, Metartec Ltd., Mitsubishi Electric Corp., Panduit Corp., Power Innovations International Inc., Riello Elettronica Group, Schneider Electric SE, Shenzhen Kstar Science and Technology Co. Ltd., SOCOMEC Group, TOSHIBA CORP, Vertiv Holdings Co., and Xiamen Kehua Hengsheng Co. Ltd. |
Market Dynamics |
Parent market analysis, market growth inducers and obstacles, fast-growing and slow-growing segment analysis, COVID-19 impact and future consumer dynamics, and market condition analysis for the forecast period. |
Customization purview |
If our report has not included the data that you are looking for, you can reach out to our analysts and get segments customized. |
Browse Information Technology Market Reports
1 Executive Summary
- 1.1 Market overview
- Exhibit 01: Executive Summary – Chart on Market Overview
- Exhibit 02: Executive Summary – Data Table on Market Overview
- Exhibit 03: Executive Summary – Chart on Global Market Characteristics
- Exhibit 04: Executive Summary – Chart on Market by Geography
- Exhibit 05: Executive Summary – Chart on Market Segmentation by Product
- Exhibit 06: Executive Summary – Chart on Market Segmentation by Application
- Exhibit 07: Executive Summary – Chart on Incremental Growth
- Exhibit 08: Executive Summary – Data Table on Incremental Growth
- Exhibit 09: Executive Summary – Chart on Vendor Market Positioning
2 Market Landscape
- 2.1 Market ecosystem
- Exhibit 10: Parent market
- Exhibit 11: Market Characteristics
3 Market Sizing
- 3.1 Market definition
- Exhibit 12: Offerings of vendors included in the market definition
- 3.2 Market segment analysis
- Exhibit 13: Market segments
- 3.3 Market size 2021
- 3.4 Market outlook: Forecast for 2021-2026
- Exhibit 14: Chart on Global - Market size and forecast 2021-2026 ($ million)
- Exhibit 15: Data Table on Global - Market size and forecast 2021-2026 ($ million)
- Exhibit 16: Chart on Global Market: Year-over-year growth 2021-2026 (%)
- Exhibit 17: Data Table on Global Market: Year-over-year growth 2021-2026 (%)
4 Five Forces Analysis
- 4.1 Five forces summary
- Exhibit 18: Five forces analysis - Comparison between 2021 and 2026
- 4.2 Bargaining power of buyers
- Exhibit 19: Chart on Bargaining power of buyers – Impact of key factors 2021 and 2026
- 4.3 Bargaining power of suppliers
- Exhibit 20: Bargaining power of suppliers – Impact of key factors in 2021 and 2026
- 4.4 Threat of new entrants
- Exhibit 21: Threat of new entrants – Impact of key factors in 2021 and 2026
- 4.5 Threat of substitutes
- Exhibit 22: Threat of substitutes – Impact of key factors in 2021 and 2026
- 4.6 Threat of rivalry
- Exhibit 23: Threat of rivalry – Impact of key factors in 2021 and 2026
- 4.7 Market condition
- Exhibit 24: Chart on Market condition - Five forces 2021 and 2026
5 Market Segmentation by Product
- 5.1 Market segments
- Exhibit 25: Chart on Product - Market share 2021-2026 (%)
- Exhibit 26: Data Table on Product - Market share 2021-2026 (%)
- 5.2 Comparison by Product
- Exhibit 27: Chart on Comparison by Product
- Exhibit 28: Data Table on Comparison by Product
- 5.3 Centralized UPS - Market size and forecast 2021-2026
- Exhibit 29: Chart on Centralized UPS - Market size and forecast 2021-2026 ($ million)
- Exhibit 30: Data Table on Centralized UPS - Market size and forecast 2021-2026 ($ million)
- Exhibit 31: Chart on Centralized UPS - Year-over-year growth 2021-2026 (%)
- Exhibit 32: Data Table on Centralized UPS - Year-over-year growth 2021-2026 (%)
- 5.4 Zone UPS - Market size and forecast 2021-2026
- Exhibit 33: Chart on Zone UPS - Market size and forecast 2021-2026 ($ million)
- Exhibit 34: Data Table on Zone UPS - Market size and forecast 2021-2026 ($ million)
- Exhibit 35: Chart on Zone UPS - Year-over-year growth 2021-2026 (%)
- Exhibit 36: Data Table on Zone UPS - Year-over-year growth 2021-2026 (%)
- 5.5 Rack-mount UPS - Market size and forecast 2021-2026
- Exhibit 37: Chart on Rack-mount UPS - Market size and forecast 2021-2026 ($ million)
- Exhibit 38: Data Table on Rack-mount UPS - Market size and forecast 2021-2026 ($ million)
- Exhibit 39: Chart on Rack-mount UPS - Year-over-year growth 2021-2026 (%)
- Exhibit 40: Data Table on Rack-mount UPS - Year-over-year growth 2021-2026 (%)
- 5.6 Market opportunity by Product
- Exhibit 41: Market opportunity by Product ($ million)
6 Market Segmentation by Application
- 6.1 Market segments
- Exhibit 42: Chart on Application - Market share 2021-2026 (%)
- Exhibit 43: Data Table on Application - Market share 2021-2026 (%)
- 6.2 Comparison by Application
- Exhibit 44: Chart on Comparison by Application
- Exhibit 45: Data Table on Comparison by Application
- 6.3 Tier 3 data center - Market size and forecast 2021-2026
- Exhibit 46: Chart on Tier 3 data center - Market size and forecast 2021-2026 ($ million)
- Exhibit 47: Data Table on Tier 3 data center - Market size and forecast 2021-2026 ($ million)
- Exhibit 48: Chart on Tier 3 data center - Year-over-year growth 2021-2026 (%)
- Exhibit 49: Data Table on Tier 3 data center - Year-over-year growth 2021-2026 (%)
- 6.4 Tier 1 and 2 data center - Market size and forecast 2021-2026
- Exhibit 50: Chart on Tier 1 and 2 data center - Market size and forecast 2021-2026 ($ million)
- Exhibit 51: Data Table on Tier 1 and 2 data center - Market size and forecast 2021-2026 ($ million)
- Exhibit 52: Chart on Tier 1 and 2 data center - Year-over-year growth 2021-2026 (%)
- Exhibit 53: Data Table on Tier 1 and 2 data center - Year-over-year growth 2021-2026 (%)
- 6.5 Tier 4 data center - Market size and forecast 2021-2026
- Exhibit 54: Chart on Tier 4 data center - Market size and forecast 2021-2026 ($ million)
- Exhibit 55: Data Table on Tier 4 data center - Market size and forecast 2021-2026 ($ million)
- Exhibit 56: Chart on Tier 4 data center - Year-over-year growth 2021-2026 (%)
- Exhibit 57: Data Table on Tier 4 data center - Year-over-year growth 2021-2026 (%)
- 6.6 Market opportunity by Application
- Exhibit 58: Market opportunity by Application ($ million)
7 Customer Landscape
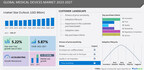
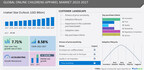
- 7.1 Customer landscape overview
- Exhibit 59: Analysis of price sensitivity, lifecycle, customer purchase basket, adoption rates, and purchase criteria
8 Geographic Landscape
- 8.1 Geographic segmentation
- Exhibit 60: Chart on Market share by geography 2021-2026 (%)
- Exhibit 61: Data Table on Market share by geography 2021-2026 (%)
- 8.2 Geographic comparison
- Exhibit 62: Chart on Geographic comparison
- Exhibit 63: Data Table on Geographic comparison
- 8.3 North America - Market size and forecast 2021-2026
- Exhibit 64: Chart on North America - Market size and forecast 2021-2026 ($ million)
- Exhibit 65: Data Table on North America - Market size and forecast 2021-2026 ($ million)
- Exhibit 66: Chart on North America - Year-over-year growth 2021-2026 (%)
- Exhibit 67: Data Table on North America - Year-over-year growth 2021-2026 (%)
- 8.4 Europe - Market size and forecast 2021-2026
- Exhibit 68: Chart on Europe - Market size and forecast 2021-2026 ($ million)
- Exhibit 69: Data Table on Europe - Market size and forecast 2021-2026 ($ million)
- Exhibit 70: Chart on Europe - Year-over-year growth 2021-2026 (%)
- Exhibit 71: Data Table on Europe - Year-over-year growth 2021-2026 (%)
- 8.5 APAC - Market size and forecast 2021-2026
- Exhibit 72: Chart on APAC - Market size and forecast 2021-2026 ($ million)
- Exhibit 73: Data Table on APAC - Market size and forecast 2021-2026 ($ million)
- Exhibit 74: Chart on APAC - Year-over-year growth 2021-2026 (%)
- Exhibit 75: Data Table on APAC - Year-over-year growth 2021-2026 (%)
- 8.6 South America - Market size and forecast 2021-2026
- Exhibit 76: Chart on South America - Market size and forecast 2021-2026 ($ million)
- Exhibit 77: Data Table on South America - Market size and forecast 2021-2026 ($ million)
- Exhibit 78: Chart on South America - Year-over-year growth 2021-2026 (%)
- Exhibit 79: Data Table on South America - Year-over-year growth 2021-2026 (%)
- 8.7 Middle East and Africa - Market size and forecast 2021-2026
- Exhibit 80: Chart on Middle East and Africa - Market size and forecast 2021-2026 ($ million)
- Exhibit 81: Data Table on Middle East and Africa - Market size and forecast 2021-2026 ($ million)
- Exhibit 82: Chart on Middle East and Africa - Year-over-year growth 2021-2026 (%)
- Exhibit 83: Data Table on Middle East and Africa - Year-over-year growth 2021-2026 (%)
- 8.8 US - Market size and forecast 2021-2026
- Exhibit 84: Chart on US - Market size and forecast 2021-2026 ($ million)
- Exhibit 85: Data Table on US - Market size and forecast 2021-2026 ($ million)
- Exhibit 86: Chart on US - Year-over-year growth 2021-2026 (%)
- Exhibit 87: Data Table on US - Year-over-year growth 2021-2026 (%)
- 8.9 China - Market size and forecast 2021-2026
- Exhibit 88: Chart on China - Market size and forecast 2021-2026 ($ million)
- Exhibit 89: Data Table on China - Market size and forecast 2021-2026 ($ million)
- Exhibit 90: Chart on China - Year-over-year growth 2021-2026 (%)
- Exhibit 91: Data Table on China - Year-over-year growth 2021-2026 (%)
- 8.10 Australia - Market size and forecast 2021-2026
- Exhibit 92: Chart on Australia - Market size and forecast 2021-2026 ($ million)
- Exhibit 93: Data Table on Australia - Market size and forecast 2021-2026 ($ million)
- Exhibit 94: Chart on Australia - Year-over-year growth 2021-2026 (%)
- Exhibit 95: Data Table on Australia - Year-over-year growth 2021-2026 (%)
- 8.11 UK - Market size and forecast 2021-2026
- Exhibit 96: Chart on UK - Market size and forecast 2021-2026 ($ million)
- Exhibit 97: Data Table on UK - Market size and forecast 2021-2026 ($ million)
- Exhibit 98: Chart on UK - Year-over-year growth 2021-2026 (%)
- Exhibit 99: Data Table on UK - Year-over-year growth 2021-2026 (%)
- 8.12 Japan - Market size and forecast 2021-2026
- Exhibit 100: Chart on Japan - Market size and forecast 2021-2026 ($ million)
- Exhibit 101: Data Table on Japan - Market size and forecast 2021-2026 ($ million)
- Exhibit 102: Chart on Japan - Year-over-year growth 2021-2026 (%)
- Exhibit 103: Data Table on Japan - Year-over-year growth 2021-2026 (%)
- 8.13 Market opportunity by geography
- Exhibit 104: Market opportunity by geography ($ million)
9 Drivers, Challenges, and Trends
- 9.1 Market drivers
- 9.2 Market challenges
- 9.3 Impact of drivers and challenges
- Exhibit 105: Impact of drivers and challenges in 2021 and 2026
- 9.4 Market trends
10 Vendor Landscape
- 10.1 Overview
- 10.2 Vendor landscape
- Exhibit 106: Overview on Criticality of inputs and Factors of differentiation
- 10.3 Landscape disruption
- Exhibit 107: Overview on factors of disruption
- 10.4 Industry risks
- Exhibit 108: Impact of key risks on business
11 Vendor Analysis
- 11.1 Vendors covered
- Exhibit 109: Vendors covered
- 11.2 Market positioning of vendors
- Exhibit 110: Matrix on vendor position and classification
- 11.3 ABB Ltd.
- Exhibit 111: ABB Ltd. - Overview
- Exhibit 112: ABB Ltd. - Business segments
- Exhibit 113: ABB Ltd. - Key offerings
- Exhibit 114: ABB Ltd. - Segment focus
- 11.4 Delta Electronics Inc.
- Exhibit 115: Delta Electronics Inc. - Overview
- Exhibit 116: Delta Electronics Inc. - Business segments
- Exhibit 117: Delta Electronics Inc. - Key offerings
- Exhibit 118: Delta Electronics Inc. - Segment focus
- 11.5 Eaton Corp. Plc
- Exhibit 119: Eaton Corp. Plc - Overview
- Exhibit 120: Eaton Corp. Plc - Business segments
- Exhibit 121: Eaton Corp. Plc - Key news
- Exhibit 122: Eaton Corp. Plc - Key offerings
- Exhibit 123: Eaton Corp. Plc - Segment focus
- 11.6 General Electric Co
- Exhibit 124: General Electric Co - Overview
- Exhibit 125: General Electric Co - Business segments
- Exhibit 126: General Electric Co - Key news
- Exhibit 127: General Electric Co - Key offerings
- Exhibit 128: General Electric Co - Segment focus
- 11.7 Langley Holdings Plc
- Exhibit 129: Langley Holdings Plc - Overview
- Exhibit 130: Langley Holdings Plc - Business segments
- Exhibit 131: Langley Holdings Plc - Key offerings
- Exhibit 132: Langley Holdings Plc - Segment focus
- 11.8 Legrand SA
- Exhibit 133: Legrand SA - Overview
- Exhibit 134: Legrand SA - Business segments
- Exhibit 135: Legrand SA - Key offerings
- Exhibit 136: Legrand SA - Segment focus
- 11.9 Panduit Corp.
- Exhibit 137: Panduit Corp. - Overview
- Exhibit 138: Panduit Corp. - Product / Service
- Exhibit 139: Panduit Corp. - Key offerings
- 11.10 Schneider Electric SE
- Exhibit 140: Schneider Electric SE - Overview
- Exhibit 141: Schneider Electric SE - Business segments
- Exhibit 142: Schneider Electric SE - Key news
- Exhibit 143: Schneider Electric SE - Key offerings
- Exhibit 144: Schneider Electric SE - Segment focus
- 11.11 TOSHIBA CORP
- Exhibit 145: TOSHIBA CORP - Overview
- Exhibit 146: TOSHIBA CORP - Business segments
- Exhibit 147: TOSHIBA CORP - Key offerings
- Exhibit 148: TOSHIBA CORP - Segment focus
- 11.12 Vertiv Holdings Co.
- Exhibit 149: Vertiv Holdings Co. - Overview
- Exhibit 150: Vertiv Holdings Co. - Business segments
- Exhibit 151: Vertiv Holdings Co. - Key news
- Exhibit 152: Vertiv Holdings Co. - Key offerings
- Exhibit 153: Vertiv Holdings Co. - Segment focus
12 Appendix
- 12.1 Scope of the report
- 12.2 Inclusions and exclusions checklist
- Exhibit 154: Inclusions checklist
- Exhibit 155: Exclusions checklist
- 12.3 Currency conversion rates for US$
- Exhibit 156: Currency conversion rates for US$
- 12.4 Research methodology
- Exhibit 157: Research methodology
- Exhibit 158: Validation techniques employed for market sizing
- Exhibit 159: Information sources
- 12.5 List of abbreviations
- Exhibit 160: List of abbreviations
Technavio is a leading global technology research and advisory company. Their research and analysis focus on emerging market trends and provide actionable insights to help businesses identify market opportunities and develop effective strategies to optimize their market positions.
With over 500 specialized analysts, Technavio's report library consists of more than 17,000 reports and counting, covering 800 technologies, spanning across 50 countries. Their client base consists of enterprises of all sizes, including more than 100 Fortune 500 companies. This growing client base relies on Technavio's comprehensive coverage, extensive research, and actionable market insights to identify opportunities in existing and potential markets and assess their competitive positions within changing market scenarios.
Contact
Technavio Research
Jesse Maida
Media & Marketing Executive
US: +1 844 364 1100
UK: +44 203 893 3200
Email:[email protected]
Website: www.technavio.com/
SOURCE Technavio


Share this article