Make confident decisions by leveraging detailed insights on the growth opportunities across major segments highlighted in our full report.
Download a Free Sample Report before purchasing.
One of the primary growth drivers for this market is the environmental and economic benefits to refineries. In addition, the increased demand for FGRS in power generation applications and stringent government regulations regarding carbon emissions will further drive the growth of the market.
Flare Gas Recovery System Market: Segment Highlights
- By capacity, the market is analyzed by segments such as very large, large, medium, and small.
- The market will observe significant growth in the very high-capacity flare gas recovery systems during the forecast period.
- Very large FGRS is widely used in gas production and processing facilities to collect the maximum amount of flared gas and improve asset cost efficiency.
- The increasing number of natural gas and oil companies are also driving the adoption of very large capacity FGRs to enhance energy usage.
- These factors will be driving the growth of the segment during the forecast period.
Regional Analysis
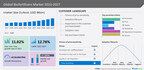
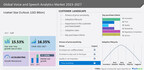
- 36% of the growth will originate from the North American region.
- Factors such as increased oil and gas activities, increased downstream demand for gases, and stringent laws against flaring of associated petroleum gases (APG) are driving the growth of the regional market.
- The US and Canada are the key markets for flare gas recovery systems in North America.
- Countries such as the United Arab Emirates, Iran, China, and Russia will also emerge as key markets for flare gas recovery systems.
Download a Free Sample for highlights on other major revenue-generating segments and regions in the market.
Notes:
- The flare gas recovery system market size is expected to accelerate at a CAGR of 13.65% during the forecast period.
- The flare gas recovery system market is segmented by Capacity (Very large, Large, Medium, and Small) and Geography (North America, Europe, APAC, Middle East and Africa, and South America).
- The market is concentrated due to the presence of many established vendors holding a significant market share.
- The research report offers information on several market vendors, including Baker Hughes Co., EMTIVAC Engineering Pty. Ltd., GENERON, Honeywell International Inc., Ingersoll Rand Inc., Kavin Engineering And Services Pvt. Ltd., Koch Industries Inc., MAN Energy Solutions SE, Ramboll Group AS, SoEnergy International, Srisen Energy Technology Co. Ltd, Transvac Systems Ltd., Wartsila Corp., and Zeeco Inc.
Related Reports:
Syngas Market in North America by Feedstock and Geography - Forecast and Analysis 2022-2026
Compressed Natural Gas (CNG) Market by Application and Geography - Forecast and Analysis 2021-2025
Flare Gas Recovery System Market Scope |
Report Coverage |
Details |
Page number |
120 |
Base year |
2021 |
Forecast period |
2022-2026 |
Growth momentum & CAGR |
Accelerate at a CAGR of 13.65% |
Market growth 2022-2026 |
USD 1.40 billion |
Market structure |
Concentrated |
YoY growth (%) |
13.4 |
Regional analysis |
North America, Europe, APAC, Middle East and Africa, and South America |
Performing market contribution |
North America at 36% |
Key consumer countries |
US, Canada, United Arab Emirates, Iran, China, and Russia |
Competitive landscape |
Leading companies, competitive strategies, consumer engagement scope |
Companies profiled |
Baker Hughes Co., EMTIVAC Engineering Pty. Ltd., GENERON, Honeywell International Inc., Ingersoll Rand Inc., Kavin Engineering And Services Pvt. Ltd., Koch Industries Inc., MAN Energy Solutions SE, Ramboll Group AS, SoEnergy International, Srisen Energy Technology Co. Ltd, Transvac Systems Ltd., Wartsila Corp., and Zeeco Inc. |
Market Dynamics |
Parent market analysis, Market growth inducers and obstacles, Fast-growing and slow-growing segment analysis, COVID-19 impact and future consumer dynamics, market condition analysis for the forecast period. |
Customization purview |
If our report has not included the data that you are looking for, you can reach out to our analysts and get segments customized. |
Table of Contents:
1 Executive Summary
- 1.1 Market overview
- Exhibit 01: Executive Summary – Chart on Market Overview
- Exhibit 02: Executive Summary – Data Table on Market Overview
- Exhibit 03: Executive Summary – Chart on Global Market Characteristics
- Exhibit 04: Executive Summary – Chart on Market by Geography
- Exhibit 05: Executive Summary – Chart on Market Segmentation by Capacity
- Exhibit 06: Executive Summary – Chart on Incremental Growth
- Exhibit 07: Executive Summary – Data Table on Incremental Growth
- Exhibit 08: Executive Summary – Chart on Vendor Market Positioning
2 Market Landscape
- 2.1 Market ecosystem
- Exhibit 09: Parent market
- Exhibit 10: Market Characteristics
3 Market Sizing
- 3.1 Market definition
- Exhibit 11: Offerings of vendors included in the market definition
- 3.2 Market segment analysis
- Exhibit 12: Market segments
- 3.4 Market outlook: Forecast for 2021-2026
- Exhibit 13: Chart on Global - Market size and forecast 2021-2026 ($ million)
- Exhibit 14: Data Table on Global - Market size and forecast 2021-2026 ($ million)
- Exhibit 15: Chart on Global Market: Year-over-year growth 2021-2026 (%)
- Exhibit 16: Data Table on Global Market: Year-over-year growth 2021-2026 (%)
4 Five Forces Analysis
- 4.1 Five forces summary
- Exhibit 17: Five forces analysis - Comparison between 2021 and 2026
- 4.2 Bargaining power of buyers
- Exhibit 18: Bargaining power of buyers – Impact of key factors in 2021 and 2026
- 4.3 Bargaining power of suppliers
- Exhibit 19: Bargaining power of suppliers – Impact of key factors in 2021 and 2026
- 4.4 Threat of new entrants
- Exhibit 20: Threat of new entrants – Impact of key factors in 2021 and 2026
- 4.5 Threat of substitutes
- Exhibit 21: Threat of substitutes – Impact of key factors in 2021 and 2026
- 4.6 Threat of rivalry
- Exhibit 22: Threat of rivalry – Impact of key factors in 2021 and 2026
- 4.7 Market condition
- Exhibit 23: Chart on Market condition - Five forces 2021 and 2026
5 Market Segmentation by Capacity
- 5.1 Market segments
- Exhibit 24: Chart on Capacity - Market share 2021-2026 (%)
- Exhibit 25: Data Table on Capacity - Market share 2021-2026 (%)
- 5.2 Comparison by Capacity
- Exhibit 26: Chart on Comparison by Capacity
- Exhibit 27: Data Table on Comparison by Capacity
- 5.3 Very large - Market size and forecast 2021-2026
- Exhibit 28: Chart on Very large - Market size and forecast 2021-2026 ($ million)
- Exhibit 29: Data Table on Very large - Market size and forecast 2021-2026 ($ million)
- Exhibit 30: Chart on Very large - Year-over-year growth 2021-2026 (%)
- Exhibit 31: Data Table on Very large - Year-over-year growth 2021-2026 (%)
- 5.4 Large - Market size and forecast 2021-2026
- Exhibit 32: Chart on Large - Market size and forecast 2021-2026 ($ million)
- Exhibit 33: Data Table on Large - Market size and forecast 2021-2026 ($ million)
- Exhibit 34: Chart on Large - Year-over-year growth 2021-2026 (%)
- Exhibit 35: Data Table on Large - Year-over-year growth 2021-2026 (%)
- 5.5 Medium - Market size and forecast 2021-2026
- Exhibit 36: Chart on Medium - Market size and forecast 2021-2026 ($ million)
- Exhibit 37: Data Table on Medium - Market size and forecast 2021-2026 ($ million)
- Exhibit 38: Chart on Medium - Year-over-year growth 2021-2026 (%)
- Exhibit 39: Data Table on Medium - Year-over-year growth 2021-2026 (%)
- 5.6 Small - Market size and forecast 2021-2026
- Exhibit 40: Chart on Small - Market size and forecast 2021-2026 ($ million)
- Exhibit 41: Data Table on Small - Market size and forecast 2021-2026 ($ million)
- Exhibit 42: Chart on Small - Year-over-year growth 2021-2026 (%)
- Exhibit 43: Data Table on Small - Year-over-year growth 2021-2026 (%)
- 5.7 Market opportunity by Capacity
- Exhibit 44: Market opportunity by Capacity ($ million)
6 Customer Landscape
- 6.1 Customer landscape overview
- Exhibit 45: Analysis of price sensitivity, lifecycle, customer purchase basket, adoption rates, and purchase criteria
7 Geographic Landscape
- 7.1 Geographic segmentation
- Exhibit 46: Chart on Market share by geography 2021-2026 (%)
- Exhibit 47: Data Table on Market share by geography 2021-2026 (%)
- 7.2 Geographic comparison
- Exhibit 48: Chart on Geographic comparison
- Exhibit 49: Data Table on Geographic comparison
- 7.3 North America - Market size and forecast 2021-2026
- Exhibit 50: Chart on North America - Market size and forecast 2021-2026 ($ million)
- Exhibit 51: Data Table on North America - Market size and forecast 2021-2026 ($ million)
- Exhibit 52: Chart on North America - Year-over-year growth 2021-2026 (%)
- Exhibit 53: Data Table on North America - Year-over-year growth 2021-2026 (%)
- 7.4 Europe - Market size and forecast 2021-2026
- Exhibit 54: Chart on Europe - Market size and forecast 2021-2026 ($ million)
- Exhibit 55: Data Table on Europe - Market size and forecast 2021-2026 ($ million)
- Exhibit 56: Chart on Europe - Year-over-year growth 2021-2026 (%)
- Exhibit 57: Data Table on Europe - Year-over-year growth 2021-2026 (%)
- 7.5 APAC - Market size and forecast 2021-2026
- Exhibit 58: Chart on APAC - Market size and forecast 2021-2026 ($ million)
- Exhibit 59: Data Table on APAC - Market size and forecast 2021-2026 ($ million)
- Exhibit 60: Chart on APAC - Year-over-year growth 2021-2026 (%)
- Exhibit 61: Data Table on APAC - Year-over-year growth 2021-2026 (%)
- 7.6 Middle East and Africa - Market size and forecast 2021-2026
- Exhibit 62: Chart on Middle East and Africa - Market size and forecast 2021-2026 ($ million)
- Exhibit 63: Data Table on Middle East and Africa - Market size and forecast 2021-2026 ($ million)
- Exhibit 64: Chart on Middle East and Africa - Year-over-year growth 2021-2026 (%)
- Exhibit 65: Data Table on Middle East and Africa - Year-over-year growth 2021-2026 (%)
- 7.7 South America - Market size and forecast 2021-2026
- Exhibit 66: Chart on South America - Market size and forecast 2021-2026 ($ million)
- Exhibit 67: Data Table on South America - Market size and forecast 2021-2026 ($ million)
- Exhibit 68: Chart on South America - Year-over-year growth 2021-2026 (%)
- Exhibit 69: Data Table on South America - Year-over-year growth 2021-2026 (%)
- 7.8 US - Market size and forecast 2021-2026
- Exhibit 70: Chart on US - Market size and forecast 2021-2026 ($ million)
- Exhibit 71: Data Table on US - Market size and forecast 2021-2026 ($ million)
- Exhibit 72: Chart on US - Year-over-year growth 2021-2026 (%)
- Exhibit 73: Data Table on US - Year-over-year growth 2021-2026 (%)
- 7.9 United Arab Emirates - Market size and forecast 2021-2026
- Exhibit 74: Chart on United Arab Emirates - Market size and forecast 2021-2026 ($ million)
- Exhibit 75: Data Table on United Arab Emirates - Market size and forecast 2021-2026 ($ million)
- Exhibit 76: Chart on United Arab Emirates - Year-over-year growth 2021-2026 (%)
- Exhibit 77: Data Table on United Arab Emirates - Year-over-year growth 2021-2026 (%)
- 7.10 China - Market size and forecast 2021-2026
- Exhibit 78: Chart on China - Market size and forecast 2021-2026 ($ million)
- Exhibit 79: Data Table on China - Market size and forecast 2021-2026 ($ million)
- Exhibit 80: Chart on China - Year-over-year growth 2021-2026 (%)
- Exhibit 81: Data Table on China - Year-over-year growth 2021-2026 (%)
- 7.11 Russia - Market size and forecast 2021-2026
- Exhibit 82: Chart on Russia - Market size and forecast 2021-2026 ($ million)
- Exhibit 83: Data Table on Russia - Market size and forecast 2021-2026 ($ million)
- Exhibit 84: Chart on Russia - Year-over-year growth 2021-2026 (%)
- Exhibit 85: Data Table on Russia - Year-over-year growth 2021-2026 (%)
- 7.12 Canada - Market size and forecast 2021-2026
- Exhibit 86: Chart on Canada - Market size and forecast 2021-2026 ($ million)
- Exhibit 87: Data Table on Canada - Market size and forecast 2021-2026 ($ million)
- Exhibit 88: Chart on Canada - Year-over-year growth 2021-2026 (%)
- Exhibit 89: Data Table on Canada - Year-over-year growth 2021-2026 (%)
- 7.13 Iran - Market size and forecast 2021-2026
- Exhibit 90: Chart on Iran - Market size and forecast 2021-2026 ($ million)
- Exhibit 91: Data Table on Iran - Market size and forecast 2021-2026 ($ million)
- Exhibit 92: Chart on Iran - Year-over-year growth 2021-2026 (%)
- Exhibit 93: Data Table on Iran - Year-over-year growth 2021-2026 (%)
- 7.14 Market opportunity by geography
- Exhibit 94: Market opportunity by geography ($ million)
8 Drivers, Challenges, and Trends
- 8.3 Impact of drivers and challenges
- Exhibit 95: Impact of drivers and challenges in 2021 and 2026
9 Vendor Landscape
- 9.2 Vendor landscape
- Exhibit 96: Overview on Criticality of inputs and Factors of differentiation
- 9.3 Landscape disruption
- Exhibit 97: Overview on factors of disruption
- 9.4 Industry risks
- Exhibit 98: Impact of key risks on business
10 Vendor Analysis
- 10.1 Vendors covered
- Exhibit 99: Vendors covered
- 10.2 Market positioning of vendors
- Exhibit 100: Matrix on vendor position and classification
- 10.3 GENERON
- Exhibit 101: GENERON - Overview
- Exhibit 102: GENERON - Product / Service
- Exhibit 103: GENERON - Key offerings
- 10.4 Honeywell International Inc.
- Exhibit 104: Honeywell International Inc. - Overview
- Exhibit 105: Honeywell International Inc. - Business segments
- Exhibit 106: Honeywell International Inc. - Key news
- Exhibit 107: Honeywell International Inc. - Key offerings
- Exhibit 108: Honeywell International Inc. - Segment focus
- 10.5 Ingersoll Rand Inc.
- Exhibit 109: Ingersoll Rand Inc. - Overview
- Exhibit 110: Ingersoll Rand Inc. - Business segments
- Exhibit 111: Ingersoll Rand Inc. - Key offerings
- Exhibit 112: Ingersoll Rand Inc. - Segment focus
- 10.6 Koch Industries Inc.
- Exhibit 113: Koch Industries Inc. - Overview
- Exhibit 114: Koch Industries Inc. - Product / Service
- Exhibit 115: Koch Industries Inc. - Key offerings
- 10.7 MAN Energy Solutions SE
- Exhibit 116: MAN Energy Solutions SE - Overview
- Exhibit 117: MAN Energy Solutions SE - Product / Service
- Exhibit 118: MAN Energy Solutions SE - Key offerings
- 10.8 Ramboll Group AS
- Exhibit 119: Ramboll Group AS - Overview
- Exhibit 120: Ramboll Group AS - Business segments
- Exhibit 121: Ramboll Group AS - Key offerings
- Exhibit 122: Ramboll Group AS - Segment focus
- 10.9 SoEnergy International
- Exhibit 123: SoEnergy International - Overview
- Exhibit 124: SoEnergy International - Product / Service
- Exhibit 125: SoEnergy International - Key offerings
- 10.10 Srisen Energy Technology Co. Ltd
- Exhibit 126: Srisen Energy Technology Co. Ltd - Overview
- Exhibit 127: Srisen Energy Technology Co. Ltd - Product / Service
- Exhibit 128: Srisen Energy Technology Co. Ltd - Key offerings
- 10.11 Wartsila Corp.
- Exhibit 129: Wartsila Corp. - Overview
- Exhibit 130: Wartsila Corp. - Business segments
- Exhibit 131: Wartsila Corp. - Key offerings
- Exhibit 132: Wartsila Corp. - Segment focus
- 10.12 Zeeco Inc.
- Exhibit 133: Zeeco Inc. - Overview
- Exhibit 134: Zeeco Inc. - Product / Service
- Exhibit 135: Zeeco Inc. - Key news
- Exhibit 136: Zeeco Inc. - Key offerings
11 Appendix
- 11.2 Inclusions and exclusions checklist
- Exhibit 137: Inclusions checklist
- Exhibit 138: Exclusions checklist
- 11.3 Currency conversion rates for US$
- Exhibit 139: Currency conversion rates for US$
- 11.4 Research methodology
- Exhibit 140: Research methodology
- Exhibit 141: Validation techniques employed for market sizing
- Exhibit 142: Information sources
- 11.5 List of abbreviations
- Exhibit 143: List of abbreviations
About Us
Technavio is a leading global technology research and advisory company. Their research and analysis focuses on emerging market trends and provides actionable insights to help businesses identify market opportunities and develop effective strategies to optimize their market positions. With over 500 specialized analysts, Technavio's report library consists of more than 17,000 reports and counting, covering 800 technologies, spanning across 50 countries. Their client base consists of enterprises of all sizes, including more than 100 Fortune 500 companies. This growing client base relies on Technavio's comprehensive coverage, extensive research, and actionable market insights to identify opportunities in existing and potential markets and assess their competitive positions within changing market scenarios.
Contact
Technavio Research
Jesse Maida
Media & Marketing Executive
US: +1 844 364 1100
UK: +44 203 893 3200
Email: [email protected]
Website: www.technavio.com/
SOURCE Technavio


Share this article