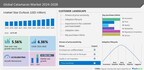
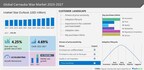
Head And Neck Cancer Diagnostics Market Size to Grow by USD 4.22 billion, Increasing Incidences of Head and Neck Cancers to Drive Growth - Technavio

NEW YORK, Aug. 22, 2022 /PRNewswire/ -- The head and neck cancer diagnostics market will be driven by factors such as the increasing incidences of head and neck cancers. As of January 2020, about 4% of all cancers in the US were head and neck cancers. Approximately 15,050 died from head and neck cancer in the country in 2020. Globally, an estimated 562,328 people were diagnosed with head and neck cancer in 2020. According to the NHS, every year, approximately 12,000 new cases of head and neck cancers are diagnosed in the UK annually. Such factors will fuel the demand for head and neck cancer diagnostics during the forecast period.
Use the analysis and insights provided by Technavio for effective decision making. Download a FREE PDF Sample Report
Market Challenge
Frequent product recalls will challenge the growth of the market. Head and neck cancer diagnostics include various equipment such as PET scans, CT scans, MRIs, and laryngoscopy equipment. The equipment must be checked, adjusted, or fixed to prevent unexpected failure or regulatory violations. Failure to do so can lead to product recalls. For instance, in April 2022, GE Healthcare initiated a product recall for its 1.5t Signa Horizon Lx Magnetic Resonance System due to failure in having proper venting. In July 2021, GE Healthcare initiated a product recall for its Class 2 Device Recall SIGNA PET/MR. Such frequent product recalls adversely impact the manufacturer and hinder the growth of the market.
Vendor Landscape
The head and neck cancer diagnostics market is fragmented, and the vendors are deploying growth strategies such as investment in R&D to compete in the market. The market witnesses intense competition due to the presence of several established vendors. Some vendors focus on offering innovative product features and providing advanced cancer diagnostic systems. In addition, the market is witnessing an increased use of advanced products globally to improve clinical outcomes. Advanced diagnostic equipment assures quality, which increases the demand for the early detection of cancer, including head and neck cancer. Moreover, companies are entering into collaborations to increase their market share and geographical presence. Such strategic alliances will boost the growth of the market during the forecast period.
Major Head and Neck Cancer Diagnostics Companies
- Accuray Inc.
- General Electric Co.
- AbbVie Inc.
- AdDent Inc.
- Bristol Myers Squibb Co.
- Canon Inc.
- Carestream Health Inc.
- Esaote Spa
- Flexicare Group Ltd.
- FUJIFILM Holdings Corp.
- Hitachi Ltd.
- KARL STORZ SE and Co. KG
- Koninklijke Philips NV
- Merck KGaA
- Neusoft Corp.
- Olympus Corp.
- Optim LLC
- Shimadzu Corp.
- Siemens AG
- Xoran Technologies LLC
This report provides a full list of key vendors, their strategies, and the latest developments. Buy Now to gain access to exclusive information about the vendors
Head And Neck Cancer Diagnostics Market Diagnostic Methods Outlook (Revenue, USD billion, 2021-2026)
- Biopsy and blood tests - size and forecast 2021-2026
- Imaging - size and forecast 2021-2026
- Endoscopy - size and forecast 2021-2026
- Dental diagnostics - size and forecast 2021-2026
Head And Neck Cancer Diagnostics Market Geography Outlook (Revenue, USD billion, 2021-2026)
- North America - size and forecast 2021-2026
- Europe - size and forecast 2021-2026
- Asia - size and forecast 2021-2026
- Rest of World (ROW) - size and forecast 2021-2026
Learn about the contribution of each segment of the head and neck cancer diagnostics market, summarized in concise infographics and thorough descriptions. View a FREE PDF Sample Report
Related Reports
Breast Cancer Liquid Biopsy Testing Devices Market by Type and Geography - Forecast and Analysis 2022-2026
Cancer Diagnostic Devices Market by Product and Geography - Forecast and Analysis 2021-2025
Head and Neck Cancer Diagnostics Market Scope |
|
Report Coverage |
Details |
Page number |
120 |
Base year |
2021 |
Forecast period |
2022-2026 |
Growth momentum & CAGR |
Accelerate at a CAGR of 11.62% |
Market growth 2022-2026 |
USD 4.22 billion |
Market structure |
Fragmented |
YoY growth (%) |
10.47 |
Regional analysis |
North America, Europe, Asia, and Rest of World (ROW) |
Performing market contribution |
North America at 41% |
Key consumer countries |
US, Germany, France, Japan, and China |
Competitive landscape |
Leading companies, Competitive strategies, Consumer engagement scope |
Key companies profiled |
Accuray Inc., General Electric Co., AbbVie Inc., AdDent Inc., Bristol Myers Squibb Co., Canon Inc., Carestream Health Inc., Esaote Spa, Flexicare Group Ltd., FUJIFILM Holdings Corp., Hitachi Ltd., KARL STORZ SE and Co. KG, Koninklijke Philips NV, Merck KGaA, Neusoft Corp., Olympus Corp., Optim LLC, Shimadzu Corp., Siemens AG, and Xoran Technologies LLC |
Market dynamics |
Parent market analysis, market growth inducers and obstacles, fast-growing and slow-growing segment analysis, COVID-19 impact and recovery analysis and future consumer dynamics, and market condition analysis for the forecast period. |
Customization purview |
If our report has not included the data that you are looking for, you can reach out to our analysts and get segments customized. |
Browse Health Care Market Reports
Table of Contents
1 Executive Summary
- 1.1 Market overview
- Exhibit 01: Executive Summary – Chart on Market Overview
- Exhibit 02: Executive Summary – Data Table on Market Overview
- Exhibit 03: Executive Summary – Chart on Global Market Characteristics
- Exhibit 04: Executive Summary – Chart on Market by Geography
- Exhibit 05: Executive Summary – Chart on Market Segmentation by Diagnostic Methods
- Exhibit 06: Executive Summary – Chart on Incremental Growth
- Exhibit 07: Executive Summary – Data Table on Incremental Growth
- Exhibit 08: Executive Summary – Chart on Vendor Market Positioning
2 Market Landscape
- 2.1 Market ecosystem
- Exhibit 09: Parent market
- Exhibit 10: Market Characteristics
3 Market Sizing
- 3.1 Market definition
- Exhibit 11: Offerings of vendors included in the market definition
- 3.2 Market segment analysis
- Exhibit 12: Market segments
- 3.3 Market size 2021
- 3.4 Market outlook: Forecast for 2021-2026
- Exhibit 13: Chart on Global - Market size and forecast 2021-2026 ($ million)
- Exhibit 14: Data Table on Global - Market size and forecast 2021-2026 ($ million)
- Exhibit 15: Chart on Global Market: Year-over-year growth 2021-2026 (%)
- Exhibit 16: Data Table on Global Market: Year-over-year growth 2021-2026 (%)
4 Five Forces Analysis
- 4.1 Five forces summary
- Exhibit 17: Five forces analysis - Comparison between 2021 and 2026
- 4.2 Bargaining power of buyers
- Exhibit 18: Chart on Bargaining power of buyers – Impact of key factors 2021 and 2026
- 4.3 Bargaining power of suppliers
- Exhibit 19: Bargaining power of suppliers – Impact of key factors in 2021 and 2026
- 4.4 Threat of new entrants
- Exhibit 20: Threat of new entrants – Impact of key factors in 2021 and 2026
- 4.5 Threat of substitutes
- Exhibit 21: Threat of substitutes – Impact of key factors in 2021 and 2026
- 4.6 Threat of rivalry
- Exhibit 22: Threat of rivalry – Impact of key factors in 2021 and 2026
- 4.7 Market condition
- Exhibit 23: Chart on Market condition - Five forces 2021 and 2026
5 Market Segmentation by Diagnostic Methods
- 5.1 Market segments
- Exhibit 24: Chart on Diagnostic Methods - Market share 2021-2026 (%)
- Exhibit 25: Data Table on Diagnostic Methods - Market share 2021-2026 (%)
- 5.2 Comparison by Diagnostic Methods
- Exhibit 26: Chart on Comparison by Diagnostic Methods
- Exhibit 27: Data Table on Comparison by Diagnostic Methods
- 5.3 Biopsy and blood tests - Market size and forecast 2021-2026
- Exhibit 28: Chart on Biopsy and blood tests - Market size and forecast 2021-2026 ($ million)
- Exhibit 29: Data Table on Biopsy and blood tests - Market size and forecast 2021-2026 ($ million)
- Exhibit 30: Chart on Biopsy and blood tests - Year-over-year growth 2021-2026 (%)
- Exhibit 31: Data Table on Biopsy and blood tests - Year-over-year growth 2021-2026 (%)
- 5.4 Imaging - Market size and forecast 2021-2026
- Exhibit 32: Chart on Imaging - Market size and forecast 2021-2026 ($ million)
- Exhibit 33: Data Table on Imaging - Market size and forecast 2021-2026 ($ million)
- Exhibit 34: Chart on Imaging - Year-over-year growth 2021-2026 (%)
- Exhibit 35: Data Table on Imaging - Year-over-year growth 2021-2026 (%)
- 5.5 Endoscopy - Market size and forecast 2021-2026
- Exhibit 36: Chart on Endoscopy - Market size and forecast 2021-2026 ($ million)
- Exhibit 37: Data Table on Endoscopy - Market size and forecast 2021-2026 ($ million)
- Exhibit 38: Chart on Endoscopy - Year-over-year growth 2021-2026 (%)
- Exhibit 39: Data Table on Endoscopy - Year-over-year growth 2021-2026 (%)
- 5.6 Dental diagnostics - Market size and forecast 2021-2026
- Exhibit 40: Chart on Dental diagnostics - Market size and forecast 2021-2026 ($ million)
- Exhibit 41: Data Table on Dental diagnostics - Market size and forecast 2021-2026 ($ million)
- Exhibit 42: Chart on Dental diagnostics - Year-over-year growth 2021-2026 (%)
- Exhibit 43: Data Table on Dental diagnostics - Year-over-year growth 2021-2026 (%)
- 5.7 Market opportunity by Diagnostic Methods
- Exhibit 44: Market opportunity by Diagnostic Methods ($ million)
6 Customer Landscape
- 6.1 Customer landscape overview
- Exhibit 45: Analysis of price sensitivity, lifecycle, customer purchase basket, adoption rates, and purchase criteria
7 Geographic Landscape
- 7.1 Geographic segmentation
- Exhibit 46: Chart on Market share by geography 2021-2026 (%)
- Exhibit 47: Data Table on Market share by geography 2021-2026 (%)
- 7.2 Geographic comparison
- Exhibit 48: Chart on Geographic comparison
- Exhibit 49: Data Table on Geographic comparison
- 7.3 North America - Market size and forecast 2021-2026
- Exhibit 50: Chart on North America - Market size and forecast 2021-2026 ($ million)
- Exhibit 51: Data Table on North America - Market size and forecast 2021-2026 ($ million)
- Exhibit 52: Chart on North America - Year-over-year growth 2021-2026 (%)
- Exhibit 53: Data Table on North America - Year-over-year growth 2021-2026 (%)
- 7.4 Europe - Market size and forecast 2021-2026
- Exhibit 54: Chart on Europe - Market size and forecast 2021-2026 ($ million)
- Exhibit 55: Data Table on Europe - Market size and forecast 2021-2026 ($ million)
- Exhibit 56: Chart on Europe - Year-over-year growth 2021-2026 (%)
- Exhibit 57: Data Table on Europe - Year-over-year growth 2021-2026 (%)
- 7.5 Asia - Market size and forecast 2021-2026
- Exhibit 58: Chart on Asia - Market size and forecast 2021-2026 ($ million)
- Exhibit 59: Data Table on Asia - Market size and forecast 2021-2026 ($ million)
- Exhibit 60: Chart on Asia - Year-over-year growth 2021-2026 (%)
- Exhibit 61: Data Table on Asia - Year-over-year growth 2021-2026 (%)
- 7.6 Rest of World (ROW) - Market size and forecast 2021-2026
- Exhibit 62: Chart on Rest of World (ROW) - Market size and forecast 2021-2026 ($ million)
- Exhibit 63: Data Table on Rest of World (ROW) - Market size and forecast 2021-2026 ($ million)
- Exhibit 64: Chart on Rest of World (ROW) - Year-over-year growth 2021-2026 (%)
- Exhibit 65: Data Table on Rest of World (ROW) - Year-over-year growth 2021-2026 (%)
- 7.7 US - Market size and forecast 2021-2026
- Exhibit 66: Chart on US - Market size and forecast 2021-2026 ($ million)
- Exhibit 67: Data Table on US - Market size and forecast 2021-2026 ($ million)
- Exhibit 68: Chart on US - Year-over-year growth 2021-2026 (%)
- Exhibit 69: Data Table on US - Year-over-year growth 2021-2026 (%)
- 7.8 Germany - Market size and forecast 2021-2026
- Exhibit 70: Chart on Germany - Market size and forecast 2021-2026 ($ million)
- Exhibit 71: Data Table on Germany - Market size and forecast 2021-2026 ($ million)
- Exhibit 72: Chart on Germany - Year-over-year growth 2021-2026 (%)
- Exhibit 73: Data Table on Germany - Year-over-year growth 2021-2026 (%)
- 7.9 Japan - Market size and forecast 2021-2026
- Exhibit 74: Chart on Japan - Market size and forecast 2021-2026 ($ million)
- Exhibit 75: Data Table on Japan - Market size and forecast 2021-2026 ($ million)
- Exhibit 76: Chart on Japan - Year-over-year growth 2021-2026 (%)
- Exhibit 77: Data Table on Japan - Year-over-year growth 2021-2026 (%)
- 7.10 China - Market size and forecast 2021-2026
- Exhibit 78: Chart on China - Market size and forecast 2021-2026 ($ million)
- Exhibit 79: Data Table on China - Market size and forecast 2021-2026 ($ million)
- Exhibit 80: Chart on China - Year-over-year growth 2021-2026 (%)
- Exhibit 81: Data Table on China - Year-over-year growth 2021-2026 (%)
- 7.11 France - Market size and forecast 2021-2026
- Exhibit 82: Chart on France - Market size and forecast 2021-2026 ($ million)
- Exhibit 83: Data Table on France - Market size and forecast 2021-2026 ($ million)
- Exhibit 84: Chart on France - Year-over-year growth 2021-2026 (%)
- Exhibit 85: Data Table on France - Year-over-year growth 2021-2026 (%)
- 7.12 Market opportunity by geography
- Exhibit 86: Market opportunity by geography ($ million)
8 Drivers, Challenges, and Trends
- 8.1 Market drivers
- 8.2 Market challenges
- 8.3 Impact of drivers and challenges
- Exhibit 87: Impact of drivers and challenges in 2021 and 2026
- 8.4 Market trends
9 Vendor Landscape
- 9.1 Overview
- 9.2 Vendor landscape
- Exhibit 88: Overview on Criticality of inputs and Factors of differentiation
- 9.3 Landscape disruption
- Exhibit 89: Overview on factors of disruption
- 9.4 Industry risks
- Exhibit 90: Impact of key risks on business
10 Vendor Analysis
- 10.1 Vendors covered
- Exhibit 91: Vendors covered
- 10.2 Market positioning of vendors
- Exhibit 92: Matrix on vendor position and classification
- 10.3 Accuray Inc.
- Exhibit 93: Accuray Inc. - Overview
- Exhibit 94: Accuray Inc. - Product / Service
- Exhibit 95: Accuray Inc. - Key news
- Exhibit 96: Accuray Inc. - Key offerings
- 10.4 AdDent Inc.
- Exhibit 97: AdDent Inc. - Overview
- Exhibit 98: AdDent Inc. - Product / Service
- Exhibit 99: AdDent Inc. - Key offerings
- 10.5 Canon Inc.
- Exhibit 100: Canon Inc. - Overview
- Exhibit 101: Canon Inc. - Business segments
- Exhibit 102: Canon Inc. - Key news
- Exhibit 103: Canon Inc. - Key offerings
- Exhibit 104: Canon Inc. - Segment focus
- 10.6 FUJIFILM Holdings Corp.
- Exhibit 105: FUJIFILM Holdings Corp. - Overview
- Exhibit 106: FUJIFILM Holdings Corp. - Business segments
- Exhibit 107: FUJIFILM Holdings Corp. - Key news
- Exhibit 108: FUJIFILM Holdings Corp. - Key offerings
- Exhibit 109: FUJIFILM Holdings Corp. - Segment focus
- 10.7 General Electric Co.
- Exhibit 110: General Electric Co. - Overview
- Exhibit 111: General Electric Co. - Business segments
- Exhibit 112: General Electric Co. - Key news
- Exhibit 113: General Electric Co. - Key offerings
- Exhibit 114: General Electric Co. - Segment focus
- 10.8 KARL STORZ SE and Co. KG
- Exhibit 115: KARL STORZ SE and Co. KG - Overview
- Exhibit 116: KARL STORZ SE and Co. KG - Product / Service
- Exhibit 117: KARL STORZ SE and Co. KG - Key news
- Exhibit 118: KARL STORZ SE and Co. KG - Key offerings
- 10.9 Koninklijke Philips NV
- Exhibit 119: Koninklijke Philips NV - Overview
- Exhibit 120: Koninklijke Philips NV - Business segments
- Exhibit 121: Koninklijke Philips NV - Key news
- Exhibit 122: Koninklijke Philips NV - Key offerings
- Exhibit 123: Koninklijke Philips NV - Segment focus
- 10.10 Neusoft Corp.
- Exhibit 124: Neusoft Corp. - Overview
- Exhibit 125: Neusoft Corp. - Business segments
- Exhibit 126: Neusoft Corp. - Key offerings
- Exhibit 127: Neusoft Corp. - Segment focus
- 10.11 Olympus Corp.
- Exhibit 128: Olympus Corp. - Overview
- Exhibit 129: Olympus Corp. - Business segments
- Exhibit 130: Olympus Corp. - Key news
- Exhibit 131: Olympus Corp. - Key offerings
- Exhibit 132: Olympus Corp. - Segment focus
- 10.12 Siemens AG
- Exhibit 133: Siemens AG - Overview
- Exhibit 134: Siemens AG - Business segments
- Exhibit 135: Siemens AG - Key news
- Exhibit 136: Siemens AG - Key offerings
- Exhibit 137: Siemens AG - Segment focus
11 Appendix
- 11.1 Scope of the report
- 11.2 Inclusions and exclusions checklist
- Exhibit 138: Inclusions checklist
- Exhibit 139: Exclusions checklist
- 11.3 Currency conversion rates for US$
- Exhibit 140: Currency conversion rates for US$
- 11.4 Research methodology
- Exhibit 141: Research methodology
- Exhibit 142: Validation techniques employed for market sizing
- Exhibit 143: Information sources
- 11.5 List of abbreviations
- Exhibit 144: List of abbreviations
Technavio is a leading global technology research and advisory company. Their research and analysis focus on emerging market trends and provide actionable insights to help businesses identify market opportunities and develop effective strategies to optimize their market positions.
With over 500 specialized analysts, Technavio's report library consists of more than 17,000 reports and counting, covering 800 technologies, spanning across 50 countries. Their client base consists of enterprises of all sizes, including more than 100 Fortune 500 companies. This growing client base relies on Technavio's comprehensive coverage, extensive research, and actionable market insights to identify opportunities in existing and potential markets and assess their competitive positions within changing market scenarios.
Technavio Research
Jesse Maida
Media & Marketing Executive
US: +1 844 364 1100
UK: +44 203 893 3200
Email: [email protected]
Website: www.technavio.com/
SOURCE Technavio


Share this article