Online grocery delivery services market size to grow by USD 652.45 billion from 2022 to 2027: A descriptive analysis of customer landscape, vendor assessment, and market dynamics - Technavio

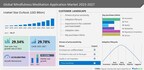
NEW YORK, Jan. 9, 2023 /PRNewswire/ -- Technavio categorizes the global online grocery delivery services market as a part of the global internet and direct marketing retail market, which covers the revenue generated by companies providing retail services primarily on the Internet through mail orders, door-to-door retailers, and TV home shopping retailers. The global online grocery delivery services market size is estimated to increase by USD 652.45 billion between 2022 and 2027. The market's growth momentum will progress at a CAGR of 19.43%.
Discover some insights on market size before buying the full report - Request a sample report
Vendor offerings -
- Albertsons Companies Inc. - The company offers online grocery delivery services for categories such as beverages, bakery, dairy, deli, frozen foods, and meat.
- Alibaba Group Holding Ltd. - The company offers online grocery delivery services for categories such as baby food, fruits, vegetables, baked goods, and canned goods.
- Amazon.com Inc. - The company offers online grocery delivery services for canned foods, breakfast cereals, and baking nuts.
- Blink Commerce Pvt. Ltd. - The company offers online grocery delivery services for vegetables, fruits, dairy, instant food, and health drinks.
- For details on vendors and their offerings – Buy the report!
The global online grocery delivery services market is fragmented, with the presence of several global as well as regional vendors. A few prominent vendors that offer online grocery delivery services in the market are Albertsons Companies Inc., Alibaba Group Holding Ltd., Amazon.com Inc., Blink Commerce Pvt. Ltd., Brandless Inc., Carrefour SA, Coles Group Ltd., Costco Wholesale Corp., Flipkart Internet Pvt. Ltd., HOFER KG, Innovative Retail Concepts Pvt. Ltd., Maplebear Inc., METRO Cash and Carry India Pvt. Ltd., Ocado Group Plc, Rakuten Group Inc., SPAR International, Target Corp., Tesco Plc, The Stop and Shop Supermarket LLC, and Walmart Inc. and others.
Key vendors are implementing various strategies such as M&A, collaborations, and partnerships to enhance the growth of the market. Regional and local vendors and emerging startups pose a threat to global vendors. Therefore, they need to invest in constant service innovations and ensure easy and convenient service delivery to sustain themselves in the market.
Global online grocery delivery services market - Customer landscape
To help companies evaluate and develop growth strategies, the report outlines –
- Key purchase criteria
- Adoption rates
- Adoption lifecycle
- Drivers of price sensitivity
Global online grocery delivery services market - Segmentation assessment
Technavio has segmented the market based on end-user (individuals and others) and product (non-food products and food products).
- The individual segment will contribute significantly to the growth of the global market during the forecast period. This growth is attributed to factors such as the growing demand for convenient shopping platforms, especially by millennials and baby boomers.
Based on geography, the global online grocery delivery services market is segmented into APAC, Europe, North America, South America, and Middle East and Africa. The report provides actionable insights and estimates the contribution of all regions to the growth of the global online grocery delivery services market.
- APAC is estimated to account for 57% of the growth of the global market during the forecast period. The growth of the market is attributed to factors such as the rising income level, westernization, and rising awareness about online grocery shopping. Moreover, various CPG manufacturers have launched low-priced products in the region, which has propelled the demand for CPG products through online and offline channels. These factors will drive the growth of the market during the forecast period.
Leading drivers - The rapid growth in m-commerce is driving market growth. This growth is mainly attributed to the rise in the penetration of smartphones across the world. E-commerce and online retail players such as Amazon.com operate through both e-commerce and m-commerce channels. Asia offers significant growth opportunities to online retailers due to the increasing demand for m-commerce. Many people In developing countries rely solely on smartphones for internet access. Thus, the rapid growth of the e-commerce industry will propel the growth of the market during the forecast period.
Key trends - Growth in demand for functional foods and beverages is a key trend in the market. The demand for functional foods and beverages is growing rapidly among consumers worldwide due to their health benefits such as enhanced immune system, improved mental strength, better heart rate, improved digestive health, hydration and electrolyte replenishing benefits, and better intestinal flora and gut function. Vendors are marketing their products with the help of effective labeling and product formulation. Online grocers and grocery delivery service providers offer these products to widen their product portfolio to capture more share in the global online grocery market. Thus, such factors will support the growth of the market during the forecast period.
Major challenges - Huge competition from offline retail stores is challenging the market growth. Offline grocers and brick-and-mortar stores, especially unorganized grocery retailers, are major competitors of online grocery delivery service providers. In developing countries such as India, unorganized grocery retailers offer various offers, services, and discounts. As a result, online grocery delivery service players find it difficult to compete with brick-and-mortar grocery sellers. The restricted availability of products in some locations is another reason hindering the market growth.
Drivers, trends, and challenges have an impact on market dynamics, which can impact businesses. Find some insights from a sample report!
What are the key data covered in this online grocery delivery services market report?
- CAGR of the market during the forecast period
- Detailed information on factors that will drive the growth of the online grocery delivery services market between 2023 and 2027
- Precise estimation of the size of the online grocery delivery services market and its contribution to the parent market
- Accurate predictions about upcoming trends and changes in consumer behavior
- Growth of the online grocery delivery services market across APAC, Europe, North America, South America, and Middle East and Africa
- A thorough analysis of the market's competitive landscape and detailed information about vendors
- Comprehensive analysis of factors that will challenge the growth of online grocery delivery services market vendors
Gain instant access to 17,000+ market research reports.
Technavio's SUBSCRIPTION platform
Related Reports:
The size of the online retail market in the US is expected to increase by USD 460.13 billion from 2021 to 2026, and the market's growth momentum will accelerate at a CAGR of 11.64%. The growing seasonal and holiday sales are notably driving the online retail market growth in the US, although factors such as transportation and logistics may impede the market growth.
The online travel booking platform market size is expected to increase by USD 943.60 billion from 2021 to 2026, and the market's growth momentum will accelerate at a CAGR of 14.64%. The increasing internet and smartphone penetration is notably driving the market growth, although factors such as disruptions in travel demand may impede the market growth.
Online Grocery Delivery Services Market Scope |
|
Report Coverage |
Details |
Page number |
163 |
Base year |
2022 |
Historic period |
2017-2021 |
Forecast period |
2023-2027 |
Growth momentum & CAGR |
Accelerate at a CAGR of 19.43% |
Market growth 2023-2027 |
USD 652.45 billion |
Market structure |
Fragmented |
YoY growth 2022-2023 (%) |
18.26 |
Regional analysis |
APAC, Europe, North America, South America, and Middle East and Africa |
Performing market contribution |
APAC at 57% |
Key countries |
US, China, Japan, UK, and France |
Competitive landscape |
Leading Vendors, Market Positioning of Vendors, Competitive Strategies, and Industry Risks |
Key companies profiled |
Albertsons Companies Inc., Alibaba Group Holding Ltd., Amazon.com Inc., Blink Commerce Pvt. Ltd., Brandless Inc., Carrefour SA, Coles Group Ltd., Costco Wholesale Corp., Flipkart Internet Pvt. Ltd., HOFER KG, Innovative Retail Concepts Pvt. Ltd., Maplebear Inc., METRO Cash and Carry India Pvt. Ltd., Ocado Group Plc, Rakuten Group Inc., SPAR International, Target Corp., Tesco Plc, The Stop and Shop Supermarket LLC, and Walmart Inc. |
Market dynamics |
Parent market analysis, Market growth inducers and obstacles, Fast-growing and slow-growing segment analysis, COVID-19 impact and recovery analysis and future consumer dynamics, and Market condition analysis for the forecast period. |
Customization purview |
If our report has not included the data that you are looking for, you can reach out to our analysts and get segments customized. |
Customization purview |
If our report has not included the data that you are looking for, you can reach out to our analysts and get segments customized. |
Browse for Technavio's consumer discretionary market reports
Table of contents
1 Executive Summary
- 1.1 Market overview
- Exhibit 01: Executive Summary – Chart on Market Overview
- Exhibit 02: Executive Summary – Data Table on Market Overview
- Exhibit 03: Executive Summary – Chart on Global Market Characteristics
- Exhibit 04: Executive Summary – Chart on Market by Geography
- Exhibit 05: Executive Summary – Chart on Market Segmentation by End-user
- Exhibit 06: Executive Summary – Chart on Market Segmentation by Product
- Exhibit 07: Executive Summary – Chart on Incremental Growth
- Exhibit 08: Executive Summary – Data Table on Incremental Growth
- Exhibit 09: Executive Summary – Chart on Vendor Market Positioning
2 Market Landscape
- 2.1 Market ecosystem
- Exhibit 10: Parent market
- Exhibit 11: Market Characteristics
3 Market Sizing
- 3.1 Market definition
- Exhibit 12: Offerings of vendors included in the market definition
- 3.2 Market segment analysis
- Exhibit 13: Market segments
- 3.3 Market size 2022
- 3.4 Market outlook: Forecast for 2022-2027
- Exhibit 14: Chart on Global - Market size and forecast 2022-2027 ($ billion)
- Exhibit 15: Data Table on Global - Market size and forecast 2022-2027 ($ billion)
- Exhibit 16: Chart on Global Market: Year-over-year growth 2022-2027 (%)
- Exhibit 17: Data Table on Global Market: Year-over-year growth 2022-2027 (%)
4 Historic Market Size
- 4.1 Global Online Grocery Delivery Services Market 2017 - 2021
- Exhibit 18: Historic Market Size – Data Table on Global Online Grocery Delivery Services Market 2017 - 2021 ($ billion)
- 4.2 End user Segment Analysis 2017 - 2021
- Exhibit 19: Historic Market Size – End user Segment 2017 - 2021 ($ billion)
- 4.3 Product Segment Analysis 2017 - 2021
- Exhibit 20: Historic Market Size – Product Segment 2017 - 2021 ($ billion)
- 4.4 Geography Segment Analysis 2017 - 2021
- Exhibit 21: Historic Market Size – Geography Segment 2017 - 2021 ($ billion)
- 4.5 Country Segment Analysis 2017 - 2021
- Exhibit 22: Historic Market Size – Country Segment 2017 - 2021 ($ billion)
5 Five Forces Analysis
- 5.1 Five forces summary
- Exhibit 23: Five forces analysis - Comparison between 2022 and 2027
- 5.2 Bargaining power of buyers
- Exhibit 24: Chart on Bargaining power of buyers – Impact of key factors 2022 and 2027
- 5.3 Bargaining power of suppliers
- Exhibit 25: Bargaining power of suppliers – Impact of key factors in 2022 and 2027
- 5.4 Threat of new entrants
- Exhibit 26: Threat of new entrants – Impact of key factors in 2022 and 2027
- 5.5 Threat of substitutes
- Exhibit 27: Threat of substitutes – Impact of key factors in 2022 and 2027
- 5.6 Threat of rivalry
- Exhibit 28: Threat of rivalry – Impact of key factors in 2022 and 2027
- 5.7 Market condition
- Exhibit 29: Chart on Market condition - Five forces 2022 and 2027
6 Market Segmentation by End-user
- 6.1 Market segments
- Exhibit 30: Chart on End-user - Market share 2022-2027 (%)
- Exhibit 31: Data Table on End-user - Market share 2022-2027 (%)
- 6.2 Comparison by End-user
- Exhibit 32: Chart on Comparison by End-user
- Exhibit 33: Data Table on Comparison by End-user
- 6.3 Individuals - Market size and forecast 2022-2027
- Exhibit 34: Chart on Individuals - Market size and forecast 2022-2027 ($ billion)
- Exhibit 35: Data Table on Individuals - Market size and forecast 2022-2027 ($ billion)
- Exhibit 36: Chart on Individuals - Year-over-year growth 2022-2027 (%)
- Exhibit 37: Data Table on Individuals - Year-over-year growth 2022-2027 (%)
- 6.4 Others - Market size and forecast 2022-2027
- Exhibit 38: Chart on Others - Market size and forecast 2022-2027 ($ billion)
- Exhibit 39: Data Table on Others - Market size and forecast 2022-2027 ($ billion)
- Exhibit 40: Chart on Others - Year-over-year growth 2022-2027 (%)
- Exhibit 41: Data Table on Others - Year-over-year growth 2022-2027 (%)
- 6.5 Market opportunity by End-user
- Exhibit 42: Market opportunity by End-user ($ billion)
7 Market Segmentation by Product
- 7.1 Market segments
- Exhibit 43: Chart on Product - Market share 2022-2027 (%)
- Exhibit 44: Data Table on Product - Market share 2022-2027 (%)
- 7.2 Comparison by Product
- Exhibit 45: Chart on Comparison by Product
- Exhibit 46: Data Table on Comparison by Product
- 7.3 Non food products - Market size and forecast 2022-2027
- Exhibit 47: Chart on Non food products - Market size and forecast 2022-2027 ($ billion)
- Exhibit 48: Data Table on Non food products - Market size and forecast 2022-2027 ($ billion)
- Exhibit 49: Chart on Non food products - Year-over-year growth 2022-2027 (%)
- Exhibit 50: Data Table on Non food products - Year-over-year growth 2022-2027 (%)
- 7.4 Food products - Market size and forecast 2022-2027
- Exhibit 51: Chart on Food products - Market size and forecast 2022-2027 ($ billion)
- Exhibit 52: Data Table on Food products - Market size and forecast 2022-2027 ($ billion)
- Exhibit 53: Chart on Food products - Year-over-year growth 2022-2027 (%)
- Exhibit 54: Data Table on Food products - Year-over-year growth 2022-2027 (%)
- 7.5 Market opportunity by Product
- Exhibit 55: Market opportunity by Product ($ billion)
8 Customer Landscape
- 8.1 Customer landscape overview
- Exhibit 56: Analysis of price sensitivity, lifecycle, customer purchase basket, adoption rates, and purchase criteria
9 Geographic Landscape
- 9.1 Geographic segmentation
- Exhibit 57: Chart on Market share by geography 2022-2027 (%)
- Exhibit 58: Data Table on Market share by geography 2022-2027 (%)
- 9.2 Geographic comparison
- Exhibit 59: Chart on Geographic comparison
- Exhibit 60: Data Table on Geographic comparison
- 9.3 APAC - Market size and forecast 2022-2027
- Exhibit 61: Chart on APAC - Market size and forecast 2022-2027 ($ billion)
- Exhibit 62: Data Table on APAC - Market size and forecast 2022-2027 ($ billion)
- Exhibit 63: Chart on APAC - Year-over-year growth 2022-2027 (%)
- Exhibit 64: Data Table on APAC - Year-over-year growth 2022-2027 (%)
- 9.4 Europe - Market size and forecast 2022-2027
- Exhibit 65: Chart on Europe - Market size and forecast 2022-2027 ($ billion)
- Exhibit 66: Data Table on Europe - Market size and forecast 2022-2027 ($ billion)
- Exhibit 67: Chart on Europe - Year-over-year growth 2022-2027 (%)
- Exhibit 68: Data Table on Europe - Year-over-year growth 2022-2027 (%)
- 9.5 North America - Market size and forecast 2022-2027
- Exhibit 69: Chart on North America - Market size and forecast 2022-2027 ($ billion)
- Exhibit 70: Data Table on North America - Market size and forecast 2022-2027 ($ billion)
- Exhibit 71: Chart on North America - Year-over-year growth 2022-2027 (%)
- Exhibit 72: Data Table on North America - Year-over-year growth 2022-2027 (%)
- 9.6 South America - Market size and forecast 2022-2027
- Exhibit 73: Chart on South America - Market size and forecast 2022-2027 ($ billion)
- Exhibit 74: Data Table on South America - Market size and forecast 2022-2027 ($ billion)
- Exhibit 75: Chart on South America - Year-over-year growth 2022-2027 (%)
- Exhibit 76: Data Table on South America - Year-over-year growth 2022-2027 (%)
- 9.7 Middle East and Africa - Market size and forecast 2022-2027
- Exhibit 77: Chart on Middle East and Africa - Market size and forecast 2022-2027 ($ billion)
- Exhibit 78: Data Table on Middle East and Africa - Market size and forecast 2022-2027 ($ billion)
- Exhibit 79: Chart on Middle East and Africa - Year-over-year growth 2022-2027 (%)
- Exhibit 80: Data Table on Middle East and Africa - Year-over-year growth 2022-2027 (%)
- 9.8 China - Market size and forecast 2022-2027
- Exhibit 81: Chart on China - Market size and forecast 2022-2027 ($ billion)
- Exhibit 82: Data Table on China - Market size and forecast 2022-2027 ($ billion)
- Exhibit 83: Chart on China - Year-over-year growth 2022-2027 (%)
- Exhibit 84: Data Table on China - Year-over-year growth 2022-2027 (%)
- 9.9 UK - Market size and forecast 2022-2027
- Exhibit 85: Chart on UK - Market size and forecast 2022-2027 ($ billion)
- Exhibit 86: Data Table on UK - Market size and forecast 2022-2027 ($ billion)
- Exhibit 87: Chart on UK - Year-over-year growth 2022-2027 (%)
- Exhibit 88: Data Table on UK - Year-over-year growth 2022-2027 (%)
- 9.10 US - Market size and forecast 2022-2027
- Exhibit 89: Chart on US - Market size and forecast 2022-2027 ($ billion)
- Exhibit 90: Data Table on US - Market size and forecast 2022-2027 ($ billion)
- Exhibit 91: Chart on US - Year-over-year growth 2022-2027 (%)
- Exhibit 92: Data Table on US - Year-over-year growth 2022-2027 (%)
- 9.11 Japan - Market size and forecast 2022-2027
- Exhibit 93: Chart on Japan - Market size and forecast 2022-2027 ($ billion)
- Exhibit 94: Data Table on Japan - Market size and forecast 2022-2027 ($ billion)
- Exhibit 95: Chart on Japan - Year-over-year growth 2022-2027 (%)
- Exhibit 96: Data Table on Japan - Year-over-year growth 2022-2027 (%)
- 9.12 France - Market size and forecast 2022-2027
- Exhibit 97: Chart on France - Market size and forecast 2022-2027 ($ billion)
- Exhibit 98: Data Table on France - Market size and forecast 2022-2027 ($ billion)
- Exhibit 99: Chart on France - Year-over-year growth 2022-2027 (%)
- Exhibit 100: Data Table on France - Year-over-year growth 2022-2027 (%)
- 9.13 Market opportunity by geography
- Exhibit 101: Market opportunity by geography ($ billion)
10 Drivers, Challenges, and Trends
- 10.1 Market drivers
- 10.2 Market challenges
- 10.3 Impact of drivers and challenges
- Exhibit 102: Impact of drivers and challenges in 2022 and 2027
- 10.4 Market trends
11 Vendor Landscape
- 11.1 Overview
- 11.2 Vendor landscape
- Exhibit 103: Overview on Criticality of inputs and Factors of differentiation
- 11.3 Landscape disruption
- Exhibit 104: Overview on factors of disruption
- 11.4 Industry risks
- Exhibit 105: Impact of key risks on business
12 Vendor Analysis
- 12.1 Vendors covered
- Exhibit 106: Vendors covered
- 12.2 Market positioning of vendors
- Exhibit 107: Matrix on vendor position and classification
- 12.3 Albertsons Companies Inc.
- Exhibit 108: Albertsons Companies Inc. - Overview
- Exhibit 109: Albertsons Companies Inc. - Product / Service
- Exhibit 110: Albertsons Companies Inc. - Key offerings
- 12.4 Alibaba Group Holding Ltd.
- Exhibit 111: Alibaba Group Holding Ltd. - Overview
- Exhibit 112: Alibaba Group Holding Ltd. - Business segments
- Exhibit 113: Alibaba Group Holding Ltd. - Key offerings
- Exhibit 114: Alibaba Group Holding Ltd. - Segment focus
- 12.5 Amazon.com Inc.
- Exhibit 115: Amazon.com Inc. - Overview
- Exhibit 116: Amazon.com Inc. - Business segments
- Exhibit 117: Amazon.com Inc. - Key news
- Exhibit 118: Amazon.com Inc. - Key offerings
- Exhibit 119: Amazon.com Inc. - Segment focus
- 12.6 Blink Commerce Pvt. Ltd.
- Exhibit 120: Blink Commerce Pvt. Ltd. - Overview
- Exhibit 121: Blink Commerce Pvt. Ltd. - Product / Service
- Exhibit 122: Blink Commerce Pvt. Ltd. - Key offerings
- 12.7 Brandless Inc.
- Exhibit 123: Brandless Inc. - Overview
- Exhibit 124: Brandless Inc. - Product / Service
- Exhibit 125: Brandless Inc. - Key offerings
- 12.8 Coles Group Ltd.
- Exhibit 126: Coles Group Ltd. - Overview
- Exhibit 127: Coles Group Ltd. - Business segments
- Exhibit 128: Coles Group Ltd. - Key offerings
- Exhibit 129: Coles Group Ltd. - Segment focus
- 12.9 Costco Wholesale Corp.
- Exhibit 130: Costco Wholesale Corp. - Overview
- Exhibit 131: Costco Wholesale Corp. - Business segments
- Exhibit 132: Costco Wholesale Corp. - Key offerings
- Exhibit 133: Costco Wholesale Corp. - Segment focus
- 12.10 HOFER KG
- Exhibit 134: HOFER KG - Overview
- Exhibit 135: HOFER KG - Product / Service
- Exhibit 136: HOFER KG - Key offerings
- 12.11 Maplebear Inc.
- Exhibit 137: Maplebear Inc. - Overview
- Exhibit 138: Maplebear Inc. - Product / Service
- Exhibit 139: Maplebear Inc. - Key offerings
- 12.12 Ocado Group Plc
- Exhibit 140: Ocado Group Plc - Overview
- Exhibit 141: Ocado Group Plc - Business segments
- Exhibit 142: Ocado Group Plc - Key offerings
- Exhibit 143: Ocado Group Plc - Segment focus
- 12.13 Rakuten Group Inc.
- Exhibit 144: Rakuten Group Inc. - Overview
- Exhibit 145: Rakuten Group Inc. - Business segments
- Exhibit 146: Rakuten Group Inc. - Key offerings
- Exhibit 147: Rakuten Group Inc. - Segment focus
- 12.14 SPAR International
- Exhibit 148: SPAR International - Overview
- Exhibit 149: SPAR International - Product / Service
- Exhibit 150: SPAR International - Key offerings
- 12.15 Target Corp.
- Exhibit 151: Target Corp. - Overview
- Exhibit 152: Target Corp. - Product / Service
- Exhibit 153: Target Corp. - Key offerings
- 12.16 Tesco Plc
- Exhibit 154: Tesco Plc - Overview
- Exhibit 155: Tesco Plc - Business segments
- Exhibit 156: Tesco Plc - Key offerings
- Exhibit 157: Tesco Plc - Segment focus
- 12.17 Walmart Inc.
- Exhibit 158: Walmart Inc. - Overview
- Exhibit 159: Walmart Inc. - Business segments
- Exhibit 160: Walmart Inc. - Key news
- Exhibit 161: Walmart Inc. - Key offerings
- Exhibit 162: Walmart Inc. - Segment focus
13 Appendix
- 13.1 Scope of the report
- 13.2 Inclusions and exclusions checklist
- Exhibit 163: Inclusions checklist
- Exhibit 164: Exclusions checklist
- 13.3 Currency conversion rates for US$
- Exhibit 165: Currency conversion rates for US$
- 13.4 Research methodology
- Exhibit 166: Research methodology
- Exhibit 167: Validation techniques employed for market sizing
- Exhibit 168: Information sources
- 13.5 List of abbreviations
- Exhibit 169: List of abbreviations
Technavio is a leading global technology research and advisory company. Their research and analysis focus on emerging market trends and provide actionable insights to help businesses identify market opportunities and develop effective strategies to optimize their market positions. With over 500 specialized analysts, Technavio's report library consists of more than 17,000 reports and counting, covering 800 technologies, spanning across 50 countries. Their client base consists of enterprises of all sizes, including more than 100 Fortune 500 companies. This growing client base relies on Technavio's comprehensive coverage, extensive research, and actionable market insights to identify opportunities in existing and potential markets and assess their competitive positions within changing market scenarios.
Contact
Technavio Research
Jesse Maida
Media & Marketing Executive
US: +1 844 364 1100
UK: +44 203 893 3200
Email: [email protected]
Website: www.technavio.com/
SOURCE Technavio


Share this article