To know about other trends - Download the FREE sample report in MINUTES
Read the 120-page report with TOC on "Penoxsulam Market Analysis Report by Type (Concentrated liquid and Granules) and Geography (APAC, North America, Europe, South America, and the Middle East and Africa), and the Segment Forecasts,2022-2026." Gain competitive intelligence about market leaders. Track key industry opportunities, trends, and threats. Information on marketing, brand, strategy and market development, sales, and supply functions. https://www.technavio.com/report/report/penoxsulam-market-industry-analysis
Penoxsulam Market: Drivers & Challenges
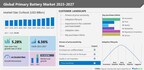
The key factor driving the global penoxsulam market growth is the rising food demand globally owing to the growing population. China and India are major rice producers in the region, which account for more than half of the regional penoxsulam demand. North America and Europe are expected to exhibit moderate growth owing to the increasing demand for penoxsulam in non-agricultural applications such as sports, gardening, and forestry. In addition, increasing food production and high economic development in developing economies of South America such as Brazil and Chili will further boost the demand. The superior chemical properties and performance of penoxsulam over other traditional herbicides are expected to positively impact the market during the forecast period.
However, the key challenges to the global penoxsulam market growth are the hazardous nature of penoxsulam toward aquatic animals and humans. Penoxsulam is not acutely toxic via skin but may be irritating if it directly contacts human eyes or is harmful if inhaled during mixing or application in the field. Moreover, penoxsulam is classified as Suggestive Evidence of Carcinogenic Potential. There is evidence that continued use of penoxsulam causes tumors, However, there is not enough information to extrapolate the risk to humans. Thus, the accumulated risk factor of direct exposure to penoxsulam is expected to limit the growth of the market in the forecast period.
To know about more drivers & challenges -Download a free sample now!
Some of the key Penoxsulam Players:
The penoxsulam market is fragmented and the vendors are deploying growth strategies such as the expansion of product portfolios to compete in the market. The report analyzes the market's competitive landscape and offers information on several market vendors, including:
- ADVANCE AGRO CHEMICALS SHANGHAI LTD.
- Aquatic Control Inc.
- Bharat Group
- Corteva Inc.
- Crystal Crop Protection Ltd.
- Dow Inc.
- Hebei Xingbai Pharmaceutical Group Co. Ltd.
- Landscape Supply Inc.
- Merck KGaA
- Ningbo Titan Unichem Co. Ltd.
- Nouryon Chemicals Holding BV
- Rainbow Co.
- Rythu agro market LLP
- Suzhou Authelet Chemical Co. Ltd.
- Syngenta AG
- Thermo Fisher Scientific Inc.
- Toronto Research Chemicals Inc.
Penoxsulam Market: Segmentation Analysis
Type Outlook (Revenue, USD mn, 2021-2026)
- Concentrated liquid - size and forecast 2021-2026
- Granules - size and forecast 2021-2026
Geography Outlook (Revenue, USD mn, 2021-2026)
- APAC - size and forecast 2021-2026
- North America - size and forecast 2021-2026
- Europe - size and forecast 2021-2026
- South America - size and forecast 2021-2026
- Middle East and Africa - size and forecast 2021-2026
To know about the market contribution of each segment - Grab an Exclusive FREE Sample Report
Related Reports:
- The glyoxylic acid market share is expected to increase by USD 246.38 million from 2021 to 2026, and the market's growth momentum will accelerate at a CAGR of 5.59%. Download a free sample now!
- The geofoams market share is expected to increase by USD 4.54 billion from 2021 to 2026, and the market's growth momentum will accelerate at a CAGR of 4.71%. Download a free sample now!
Penoxsulam Market Scope |
Report Coverage |
Details |
Page number |
120 |
Base year |
2021 |
Forecast period |
2022-2026 |
Growth momentum & CAGR |
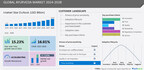
Accelerate at a CAGR of 4.01% |
Market growth 2022-2026 |
USD 80.61 million |
Market structure |
Fragmented |
YoY growth (%) |
3.74 |
Performing market contribution |
APAC at 52% |
Competitive landscape |
Leading companies, competitive strategies, consumer engagement scope |
Companies profiled |
ADVANCE AGRO CHEMICALS SHANGHAI LTD., Aquatic Control Inc., Bharat Group, Corteva Inc., Crystal Crop Protection Ltd., Dow Inc., Hebei Xingbai Pharmaceutical Group Co. Ltd., Landscape Supply Inc., Merck KGaA, Ningbo Titan Unichem Co. Ltd., Nouryon Chemicals Holding BV, Rainbow Co., Rythu agro market LLP, Suzhou Authelet Chemical Co. Ltd., Syngenta AG, Thermo Fisher Scientific Inc., and Toronto Research Chemicals Inc. |
Market Dynamics |
Parent market analysis, Market growth inducers and obstacles, Fast-growing and slow-growing segment analysis, COVID 19 impact and future consumer dynamics, market condition analysis for the forecast period, |
Customization purview |
If our report has not included the data that you are looking for, you can reach out to our analysts and get segments customized. |
Table of Content
1 Executive Summary
- 1.1 Market overview
- Exhibit 01: Executive Summary – Chart on Market Overview
- Exhibit 02: Executive Summary – Data Table on Market Overview
- Exhibit 03: Executive Summary – Chart on Global Market Characteristics
- Exhibit 04: Executive Summary – Chart on Market by Geography
- Exhibit 05: Executive Summary – Chart on Market Segmentation by Type
- Exhibit 06: Executive Summary – Chart on Incremental Growth
- Exhibit 07: Executive Summary – Data Table on Incremental Growth
- Exhibit 08: Executive Summary – Chart on Vendor Market Positioning
2 Market Landscape
- 2.1 Market ecosystem
- Exhibit 09: Parent market
- Exhibit 10: Market Characteristics
3 Market Sizing
- 3.1 Market definition
- Exhibit 11: Offerings of vendors included in the market definition
- 3.2 Market segment analysis
- Exhibit 12: Market segments
- 3.4 Market outlook: Forecast for 2021-2026
- Exhibit 13: Chart on Global - Market size and forecast 2021-2026 ($ million)
- Exhibit 14: Data Table on Global - Market size and forecast 2021-2026 ($ million)
- Exhibit 15: Chart on Global Market: Year-over-year growth 2021-2026 (%)
- Exhibit 16: Data Table on Global Market: Year-over-year growth 2021-2026 (%)
4 Five Forces Analysis
- 4.1 Five forces summary
- Exhibit 17: Five forces analysis - Comparison between 2021 and 2026
- 4.2 Bargaining power of buyers
- Exhibit 18: Bargaining power of buyers – Impact of key factors in 2021 and 2026
- 4.3 Bargaining power of suppliers
- Exhibit 19: Bargaining power of suppliers – Impact of key factors in 2021 and 2026
- 4.4 Threat of new entrants
- Exhibit 20: Threat of new entrants – Impact of key factors in 2021 and 2026
- 4.5 Threat of substitutes
- Exhibit 21: Threat of substitutes – Impact of key factors in 2021 and 2026
- 4.6 Threat of rivalry
- Exhibit 22: Threat of rivalry – Impact of key factors in 2021 and 2026
- 4.7 Market condition
- Exhibit 23: Chart on Market condition - Five forces 2021 and 2026
5 Market Segmentation by Type
- 5.1 Market segments
- Exhibit 24: Chart on Type - Market share 2021-2026 (%)
- Exhibit 25: Data Table on Type - Market share 2021-2026 (%)
- 5.2 Comparison by Type
- Exhibit 26: Chart on Comparison by Type
- Exhibit 27: Data Table on Comparison by Type
- 5.3 Concentrated liquid - Market size and forecast 2021-2026
- Exhibit 28: Chart on Concentrated liquid - Market size and forecast 2021-2026 ($ million)
- Exhibit 29: Data Table on Concentrated liquid - Market size and forecast 2021-2026 ($ million)
- Exhibit 30: Chart on Concentrated liquid - Year-over-year growth 2021-2026 (%)
- Exhibit 31: Data Table on Concentrated liquid - Year-over-year growth 2021-2026 (%)
- 5.4 Granules - Market size and forecast 2021-2026
- Exhibit 32: Chart on Granules - Market size and forecast 2021-2026 ($ million)
- Exhibit 33: Data Table on Granules - Market size and forecast 2021-2026 ($ million)
- Exhibit 34: Chart on Granules - Year-over-year growth 2021-2026 (%)
- Exhibit 35: Data Table on Granules - Year-over-year growth 2021-2026 (%)
- 5.5 Market opportunity by Type
- Exhibit 36: Market opportunity by Type ($ million)
6 Customer Landscape
- 6.1 Customer landscape overview
- Exhibit 37: Analysis of price sensitivity, lifecycle, customer purchase basket, adoption rates, and purchase criteria
7 Geographic Landscape
- 7.1 Geographic segmentation
- Exhibit 38: Chart on Market share by geography 2021-2026 (%)
- Exhibit 39: Data Table on Market share by geography 2021-2026 (%)
- 7.2 Geographic comparison
- Exhibit 40: Chart on Geographic comparison
- Exhibit 41: Data Table on Geographic comparison
- 7.3 APAC - Market size and forecast 2021-2026
- Exhibit 42: Chart on APAC - Market size and forecast 2021-2026 ($ million)
- Exhibit 43: Data Table on APAC - Market size and forecast 2021-2026 ($ million)
- Exhibit 44: Chart on APAC - Year-over-year growth 2021-2026 (%)
- Exhibit 45: Data Table on APAC - Year-over-year growth 2021-2026 (%)
- 7.4 North America - Market size and forecast 2021-2026
- Exhibit 46: Chart on North America - Market size and forecast 2021-2026 ($ million)
- Exhibit 47: Data Table on North America - Market size and forecast 2021-2026 ($ million)
- Exhibit 48: Chart on North America - Year-over-year growth 2021-2026 (%)
- Exhibit 49: Data Table on North America - Year-over-year growth 2021-2026 (%)
- 7.5 Europe - Market size and forecast 2021-2026
- Exhibit 50: Chart on Europe - Market size and forecast 2021-2026 ($ million)
- Exhibit 51: Data Table on Europe - Market size and forecast 2021-2026 ($ million)
- Exhibit 52: Chart on Europe - Year-over-year growth 2021-2026 (%)
- Exhibit 53: Data Table on Europe - Year-over-year growth 2021-2026 (%)
- 7.6 South America - Market size and forecast 2021-2026
- Exhibit 54: Chart on South America - Market size and forecast 2021-2026 ($ million)
- Exhibit 55: Data Table on South America - Market size and forecast 2021-2026 ($ million)
- Exhibit 56: Chart on South America - Year-over-year growth 2021-2026 (%)
- Exhibit 57: Data Table on South America - Year-over-year growth 2021-2026 (%)
- 7.7 Middle East and Africa - Market size and forecast 2021-2026
- Exhibit 58: Chart on Middle East and Africa - Market size and forecast 2021-2026 ($ million)
- Exhibit 59: Data Table on Middle East and Africa - Market size and forecast 2021-2026 ($ million)
- Exhibit 60: Chart on Middle East and Africa - Year-over-year growth 2021-2026 (%)
- Exhibit 61: Data Table on Middle East and Africa - Year-over-year growth 2021-2026 (%)
- 7.8 China - Market size and forecast 2021-2026
- Exhibit 62: Chart on China - Market size and forecast 2021-2026 ($ million)
- Exhibit 63: Data Table on China - Market size and forecast 2021-2026 ($ million)
- Exhibit 64: Chart on China - Year-over-year growth 2021-2026 (%)
- Exhibit 65: Data Table on China - Year-over-year growth 2021-2026 (%)
- 7.9 US - Market size and forecast 2021-2026
- Exhibit 66: Chart on US - Market size and forecast 2021-2026 ($ million)
- Exhibit 67: Data Table on US - Market size and forecast 2021-2026 ($ million)
- Exhibit 68: Chart on US - Year-over-year growth 2021-2026 (%)
- Exhibit 69: Data Table on US - Year-over-year growth 2021-2026 (%)
- 7.10 India - Market size and forecast 2021-2026
- Exhibit 70: Chart on India - Market size and forecast 2021-2026 ($ million)
- Exhibit 71: Data Table on India - Market size and forecast 2021-2026 ($ million)
- Exhibit 72: Chart on India - Year-over-year growth 2021-2026 (%)
- Exhibit 73: Data Table on India - Year-over-year growth 2021-2026 (%)
- 7.11 Brazil - Market size and forecast 2021-2026
- Exhibit 74: Chart on Brazil - Market size and forecast 2021-2026 ($ million)
- Exhibit 75: Data Table on Brazil - Market size and forecast 2021-2026 ($ million)
- Exhibit 76: Chart on Brazil - Year-over-year growth 2021-2026 (%)
- Exhibit 77: Data Table on Brazil - Year-over-year growth 2021-2026 (%)
- 7.12 Japan - Market size and forecast 2021-2026
- Exhibit 78: Chart on Japan - Market size and forecast 2021-2026 ($ million)
- Exhibit 79: Data Table on Japan - Market size and forecast 2021-2026 ($ million)
- Exhibit 80: Chart on Japan - Year-over-year growth 2021-2026 (%)
- Exhibit 81: Data Table on Japan - Year-over-year growth 2021-2026 (%)
- 7.13 Market opportunity by geography
- Exhibit 82: Market opportunity by geography ($ million)
8 Drivers, Challenges, and Trends
- 8.3 Impact of drivers and challenges
- Exhibit 83: Impact of drivers and challenges in 2021 and 2026
9 Vendor Landscape
- 9.2 Vendor landscape
- Exhibit 84: Overview on Criticality of inputs and Factors of differentiation
- 9.3 Landscape disruption
- Exhibit 85: Overview on factors of disruption
- 9.4 Industry risks
- Exhibit 86: Impact of key risks on business
10 Vendor Analysis
- 10.1 Vendors covered
- Exhibit 87: Vendors covered
- 10.2 Market positioning of vendors
- Exhibit 88: Matrix on vendor position and classification
- 10.3 ADVANCE AGRO CHEMICALS SHANGHAI LTD.
- Exhibit 89: ADVANCE AGRO CHEMICALS SHANGHAI LTD. - Overview
- Exhibit 90: ADVANCE AGRO CHEMICALS SHANGHAI LTD. - Product / Service
- Exhibit 91: ADVANCE AGRO CHEMICALS SHANGHAI LTD. - Key offerings
- 10.4 Corteva Inc.
- Exhibit 92: Corteva Inc. - Overview
- Exhibit 93: Corteva Inc. - Business segments
- Exhibit 94: Corteva Inc. - Key news
- Exhibit 95: Corteva Inc. - Key offerings
- Exhibit 96: Corteva Inc. - Segment focus
- 10.5 Crystal Crop Protection Ltd.
- Exhibit 97: Crystal Crop Protection Ltd. - Overview
- Exhibit 98: Crystal Crop Protection Ltd. - Product / Service
- Exhibit 99: Crystal Crop Protection Ltd. - Key offerings
- 10.6 Hebei Xingbai Pharmaceutical Group Co. Ltd.
- Exhibit 100: Hebei Xingbai Pharmaceutical Group Co. Ltd. - Overview
- Exhibit 101: Hebei Xingbai Pharmaceutical Group Co. Ltd. - Product / Service
- Exhibit 102: Hebei Xingbai Pharmaceutical Group Co. Ltd. - Key offerings
- 10.7 Merck KGaA
- Exhibit 103: Merck KGaA - Overview
- Exhibit 104: Merck KGaA - Business segments
- Exhibit 105: Merck KGaA - Key news
- Exhibit 106: Merck KGaA - Key offerings
- Exhibit 107: Merck KGaA - Segment focus
- 10.8 Nouryon Chemicals Holding BV
- Exhibit 108: Nouryon Chemicals Holding BV - Overview
- Exhibit 109: Nouryon Chemicals Holding BV - Business segments
- Exhibit 110: Nouryon Chemicals Holding BV - Key news
- Exhibit 111: Nouryon Chemicals Holding BV - Key offerings
- Exhibit 112: Nouryon Chemicals Holding BV - Segment focus
- 10.9 Rythu agro market LLP
- Exhibit 113: Rythu agro market LLP - Overview
- Exhibit 114: Rythu agro market LLP - Product / Service
- Exhibit 115: Rythu agro market LLP - Key offerings
- 10.10 Syngenta AG
- Exhibit 116: Syngenta AG - Overview
- Exhibit 117: Syngenta AG - Business segments
- Exhibit 118: Syngenta AG - Key offerings
- Exhibit 119: Syngenta AG - Segment focus
- 10.11 Thermo Fisher Scientific Inc.
- Exhibit 120: Thermo Fisher Scientific Inc. - Overview
- Exhibit 121: Thermo Fisher Scientific Inc. - Business segments
- Exhibit 122: Thermo Fisher Scientific Inc. - Key news
- Exhibit 123: Thermo Fisher Scientific Inc. - Key offerings
- Exhibit 124: Thermo Fisher Scientific Inc. - Segment focus
- 10.12 Toronto Research Chemicals Inc.
- Exhibit 125: Toronto Research Chemicals Inc. - Overview
- Exhibit 126: Toronto Research Chemicals Inc. - Product / Service
- Exhibit 127: Toronto Research Chemicals Inc. - Key offerings
11 Appendix
- 11.2 Inclusions and exclusions checklist
- Exhibit 128: Inclusions checklist
- Exhibit 129: Exclusions checklist
- 11.3 Currency conversion rates for US$
- Exhibit 130: Currency conversion rates for US$
- 11.4 Research methodology
- Exhibit 131: Research methodology
- Exhibit 132: Validation techniques employed for market sizing
- Exhibit 133: Information sources
- 11.5 List of abbreviations
- Exhibit 134: List of abbreviations
About Technavio
Technavio is a leading global technology research and advisory company. Their research and analysis focuses on emerging market trends and provide actionable insights to help businesses identify market opportunities and develop effective strategies to optimize their market positions.
With over 500 specialized analysts, Technavio's report library consists of more than 17,000 reports and counting, covering 800 technologies, spanning 50 countries. Their client base consists of enterprises of all sizes, including more than 100 Fortune 500 companies. This growing client base relies on Technavio's comprehensive coverage, extensive research, and actionable market insights to identify opportunities in existing and potential markets and assess their competitive positions within changing market scenarios.
Contacts
Technavio Research
Jesse Maida
Media & Marketing Executive
US: +1 844 364 1100
UK: +44 203 893 3200
Email: [email protected]
Website: www.technavio.com/
SOURCE Technavio


Share this article