Power Metering Market to Record a CAGR of 7.9%, Emergence of ABB Ltd. and Eaton Corp. Plc as Key Market Contributors - Technavio

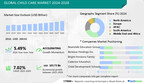
NEW YORK, Oct. 4, 2022 /PRNewswire/ -- The "Power Metering Market Research by End-user and Geography - Forecast and Analysis 2022-2026" report has been added to Technavio's offerings. The market size is expected to grow by USD 8.97 billion from 2021 to 2026. In addition, the growth momentum of the market will accelerate at a CAGR of 7.9% during the forecast period.
The report offers an up-to-date analysis of the current market scenario, the latest trends and drivers, and the overall market environment. Request Latest FREE PDF Sample Report
Power Metering Market 2022-2026: Scope
The power metering market report covers the following areas:
Subscribe to our "Basic Plan" billed annually at USD 5000 that enables you to download 5 reports a month and view 100 reports every month
Power Metering Market 2022-2026: Vendor Offerings
ABB Ltd., Aichi Tokei Denki Co. Ltd., ALLETE Inc., Eaton Corp. Plc, General Electric Co, Holley Technology Ltd., Honeywell International Inc., Hubbell Inc., Itron Inc., Jabil Inc., Kamstrup AS, Landis Gyr AG, Networked Energy Services, Ningbo Sanxing Medical and Electric Co. Ltd., Schneider Electric SE, Shenzhen Kaifa Technology Co. Ltd., Siemens AG, Suntront Tech Co. Ltd., Wasion Holdings Ltd., and Xylem Inc. are among some of the major market participants. The key offerings of some of these vendors are listed below:
- ABB Ltd. - The company offers a wide range of energy meters such as B21 311 400 and B23 112 500.
- Eaton Corp. Plc - The company offers power metering and power monitoring equipment such as Power Xpert Meter 2000 and Power Xpert Meter 3000.
- General Electric Co - The company offers smart meters such as Multilin EPM 6000 and EPM 7000P.
- Honeywell International Inc. - The company offers power meter devices such as Alpha smart AS3000 and HS100.
- Hubbell Inc. - The company offers smart meter devices such as kV2c Electric Smart Meter, SGM1100, and SGM1300.
This report provides a full list of key vendors, their strategies, and the latest developments. Request a FREE PDF Sample Now
Power Metering Market 2022-2026: Segmentation
- End-user
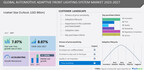
- Residential: The residential segment will be the largest contributor to market growth during the forecast period. The rise in the number of proposals for the establishment of smart grids on a regional level, initiatives by legislative bodies, and mandates regarding the replacement of traditional analog-installed meters are some of the factors driving the market growth.
- Commercial
- Industrial
- Geography
- APAC: APAC will account for 46% of the market's growth during the forecast period. The growth of this region is attributed to factors such as increasing urbanization, the rising population, growth in manufacturing industries, and supportive regulatory actions. Moreover, market growth in this region will be faster than the growth of the market in other regions. China and Japan are the key countries for the power metering market in APAC.
- Europe
- North America
- South America
- Middle East And Africa
Power Metering Market 2022-2026: Key Highlights
- CAGR of the market during 2022-2026
- Detailed information on factors that will assist power metering market growth during the next five years
- Approximation of the power metering market size and its contribution to the parent market
- Forecasts on upcoming trends and changes in consumer behavior
- The growth of the power metering market
- Analysis of the competitive landscape and detailed information on vendors
- Comprehensive details of factors that will hinder the growth of power metering market vendors
Related Reports
Metal Detector Market by Product, Application, and Geography - Forecast and Analysis 2022-2026: The metal detector market share is expected to increase by USD 175.73 million from 2021 to 2026.
Micro LED Display Market by End-user and Geography - Forecast and Analysis 2022-2026: The micro LED display market share is expected to increase by USD 11.50 billion from 2021 to 2026.
Power Metering Market Scope |
|
Report Coverage |
Details |
Page number |
120 |
Base year |
2021 |
Forecast period |
2022-2026 |
Growth momentum & CAGR |
Accelerate at a CAGR of 7.9% |
Market growth 2022-2026 |
USD 8.97 billion |
Market structure |
Fragmented |
YoY growth (%) |
7.52 |
Regional analysis |
APAC, Europe, North America, South America, and Middle East and Africa |
Performing market contribution |
APAC at 46% |
Key consumer countries |
US, China, Japan, Germany, and UK |
Competitive landscape |
Leading companies, competitive strategies, consumer engagement scope |
Companies profiled |
ABB Ltd., Aichi Tokei Denki Co. Ltd., ALLETE Inc., Eaton Corp. Plc, General Electric Co, Holley Technology Ltd., Honeywell International Inc., Hubbell Inc., Itron Inc., Jabil Inc., Kamstrup AS, Landis Gyr AG, Networked Energy Services, Ningbo Sanxing Medical and Electric Co. Ltd., Schneider Electric SE, Shenzhen Kaifa Technology Co. Ltd., Siemens AG, Suntront Tech Co. Ltd., Wasion Holdings Ltd., and Xylem Inc. |
Market Dynamics |
Parent market analysis, market growth inducers and obstacles, fast-growing and slow-growing segment analysis, COVID-19 impact and future consumer dynamics, and market condition analysis for the forecast period. |
Customization purview |
If our report has not included the data that you are looking for, you can reach out to our analysts and get segments customized. |
Browse Information Technology Market Reports
Table of Contents
1 Executive Summary
- 1.1 Market overview
- Exhibit 01: Executive Summary – Chart on Market Overview
- Exhibit 02: Executive Summary – Data Table on Market Overview
- Exhibit 03: Executive Summary – Chart on Global Market Characteristics
- Exhibit 04: Executive Summary – Chart on Market by Geography
- Exhibit 05: Executive Summary – Chart on Market Segmentation by End-user
- Exhibit 06: Executive Summary – Chart on Incremental Growth
- Exhibit 07: Executive Summary – Data Table on Incremental Growth
- Exhibit 08: Executive Summary – Chart on Vendor Market Positioning
2 Market Landscape
- 2.1 Market ecosystem
- Exhibit 09: Parent market
- Exhibit 10: Market Characteristics
3 Market Sizing
- 3.1 Market definition
- Exhibit 11: Offerings of vendors included in the market definition
- 3.2 Market segment analysis
- Exhibit 12: Market segments
- 3.3 Market size 2021
- 3.4 Market outlook: Forecast for 2021-2026
- Exhibit 13: Chart on Global - Market size and forecast 2021-2026 ($ million)
- Exhibit 14: Data Table on Global - Market size and forecast 2021-2026 ($ million)
- Exhibit 15: Chart on Global Market: Year-over-year growth 2021-2026 (%)
- Exhibit 16: Data Table on Global Market: Year-over-year growth 2021-2026 (%)
4 Five Forces Analysis
- 4.1 Five forces summary
- Exhibit 17: Five forces analysis - Comparison between 2021 and 2026
- 4.2 Bargaining power of buyers
- Exhibit 18: Chart on Bargaining power of buyers – Impact of key factors 2021 and 2026
- 4.3 Bargaining power of suppliers
- Exhibit 19: Bargaining power of suppliers – Impact of key factors in 2021 and 2026
- 4.4 Threat of new entrants
- Exhibit 20: Threat of new entrants – Impact of key factors in 2021 and 2026
- 4.5 Threat of substitutes
- Exhibit 21: Threat of substitutes – Impact of key factors in 2021 and 2026
- 4.6 Threat of rivalry
- Exhibit 22: Threat of rivalry – Impact of key factors in 2021 and 2026
- 4.7 Market condition
- Exhibit 23: Chart on Market condition - Five forces 2021 and 2026
5 Market Segmentation by End-user
- 5.1 Market segments
- Exhibit 24: Chart on End-user - Market share 2021-2026 (%)
- Exhibit 25: Data Table on End-user - Market share 2021-2026 (%)
- 5.2 Comparison by End-user
- Exhibit 26: Chart on Comparison by End-user
- Exhibit 27: Data Table on Comparison by End-user
- 5.3 Residential - Market size and forecast 2021-2026
- Exhibit 28: Chart on Residential - Market size and forecast 2021-2026 ($ million)
- Exhibit 29: Data Table on Residential - Market size and forecast 2021-2026 ($ million)
- Exhibit 30: Chart on Residential - Year-over-year growth 2021-2026 (%)
- Exhibit 31: Data Table on Residential - Year-over-year growth 2021-2026 (%)
- 5.4 Commercial - Market size and forecast 2021-2026
- Exhibit 32: Chart on Commercial - Market size and forecast 2021-2026 ($ million)
- Exhibit 33: Data Table on Commercial - Market size and forecast 2021-2026 ($ million)
- Exhibit 34: Chart on Commercial - Year-over-year growth 2021-2026 (%)
- Exhibit 35: Data Table on Commercial - Year-over-year growth 2021-2026 (%)
- 5.5 Industrial - Market size and forecast 2021-2026
- Exhibit 36: Chart on Industrial - Market size and forecast 2021-2026 ($ million)
- Exhibit 37: Data Table on Industrial - Market size and forecast 2021-2026 ($ million)
- Exhibit 38: Chart on Industrial - Year-over-year growth 2021-2026 (%)
- Exhibit 39: Data Table on Industrial - Year-over-year growth 2021-2026 (%)
- 5.6 Market opportunity by End-user
- Exhibit 40: Market opportunity by End-user ($ million)
6 Customer Landscape
- 6.1 Customer landscape overview
- Exhibit 41: Analysis of price sensitivity, lifecycle, customer purchase basket, adoption rates, and purchase criteria
7 Geographic Landscape
- 7.1 Geographic segmentation
- Exhibit 42: Chart on Market share by geography 2021-2026 (%)
- Exhibit 43: Data Table on Market share by geography 2021-2026 (%)
- 7.2 Geographic comparison
- Exhibit 44: Chart on Geographic comparison
- Exhibit 45: Data Table on Geographic comparison
- 7.3 APAC - Market size and forecast 2021-2026
- Exhibit 46: Chart on APAC - Market size and forecast 2021-2026 ($ million)
- Exhibit 47: Data Table on APAC - Market size and forecast 2021-2026 ($ million)
- Exhibit 48: Chart on APAC - Year-over-year growth 2021-2026 (%)
- Exhibit 49: Data Table on APAC - Year-over-year growth 2021-2026 (%)
- 7.4 Europe - Market size and forecast 2021-2026
- Exhibit 50: Chart on Europe - Market size and forecast 2021-2026 ($ million)
- Exhibit 51: Data Table on Europe - Market size and forecast 2021-2026 ($ million)
- Exhibit 52: Chart on Europe - Year-over-year growth 2021-2026 (%)
- Exhibit 53: Data Table on Europe - Year-over-year growth 2021-2026 (%)
- 7.5 North America - Market size and forecast 2021-2026
- Exhibit 54: Chart on North America - Market size and forecast 2021-2026 ($ million)
- Exhibit 55: Data Table on North America - Market size and forecast 2021-2026 ($ million)
- Exhibit 56: Chart on North America - Year-over-year growth 2021-2026 (%)
- Exhibit 57: Data Table on North America - Year-over-year growth 2021-2026 (%)
- 7.6 South America - Market size and forecast 2021-2026
- Exhibit 58: Chart on South America - Market size and forecast 2021-2026 ($ million)
- Exhibit 59: Data Table on South America - Market size and forecast 2021-2026 ($ million)
- Exhibit 60: Chart on South America - Year-over-year growth 2021-2026 (%)
- Exhibit 61: Data Table on South America - Year-over-year growth 2021-2026 (%)
- 7.7 Middle East and Africa - Market size and forecast 2021-2026
- Exhibit 62: Chart on Middle East and Africa - Market size and forecast 2021-2026 ($ million)
- Exhibit 63: Data Table on Middle East and Africa - Market size and forecast 2021-2026 ($ million)
- Exhibit 64: Chart on Middle East and Africa - Year-over-year growth 2021-2026 (%)
- Exhibit 65: Data Table on Middle East and Africa - Year-over-year growth 2021-2026 (%)
- 7.8 China - Market size and forecast 2021-2026
- Exhibit 66: Chart on China - Market size and forecast 2021-2026 ($ million)
- Exhibit 67: Data Table on China - Market size and forecast 2021-2026 ($ million)
- Exhibit 68: Chart on China - Year-over-year growth 2021-2026 (%)
- Exhibit 69: Data Table on China - Year-over-year growth 2021-2026 (%)
- 7.9 US - Market size and forecast 2021-2026
- Exhibit 70: Chart on US - Market size and forecast 2021-2026 ($ million)
- Exhibit 71: Data Table on US - Market size and forecast 2021-2026 ($ million)
- Exhibit 72: Chart on US - Year-over-year growth 2021-2026 (%)
- Exhibit 73: Data Table on US - Year-over-year growth 2021-2026 (%)
- 7.10 Japan - Market size and forecast 2021-2026
- Exhibit 74: Chart on Japan - Market size and forecast 2021-2026 ($ million)
- Exhibit 75: Data Table on Japan - Market size and forecast 2021-2026 ($ million)
- Exhibit 76: Chart on Japan - Year-over-year growth 2021-2026 (%)
- Exhibit 77: Data Table on Japan - Year-over-year growth 2021-2026 (%)
- 7.11 Germany - Market size and forecast 2021-2026
- Exhibit 78: Chart on Germany - Market size and forecast 2021-2026 ($ million)
- Exhibit 79: Data Table on Germany - Market size and forecast 2021-2026 ($ million)
- Exhibit 80: Chart on Germany - Year-over-year growth 2021-2026 (%)
- Exhibit 81: Data Table on Germany - Year-over-year growth 2021-2026 (%)
- 7.12 UK - Market size and forecast 2021-2026
- Exhibit 82: Chart on UK - Market size and forecast 2021-2026 ($ million)
- Exhibit 83: Data Table on UK - Market size and forecast 2021-2026 ($ million)
- Exhibit 84: Chart on UK - Year-over-year growth 2021-2026 (%)
- Exhibit 85: Data Table on UK - Year-over-year growth 2021-2026 (%)
- 7.13 Market opportunity by geography
- Exhibit 86: Market opportunity by geography ($ million)
8 Drivers, Challenges, and Trends
- 8.1 Market drivers
- 8.2 Market challenges
- 8.3 Impact of drivers and challenges
- Exhibit 87: Impact of drivers and challenges in 2021 and 2026
- 8.4 Market trends
9 Vendor Landscape
- 9.1 Overview
- 9.2 Vendor landscape
- Exhibit 88: Overview on Criticality of inputs and Factors of differentiation
- 9.3 Landscape disruption
- Exhibit 89: Overview on factors of disruption
- 9.4 Industry risks
- Exhibit 90: Impact of key risks on business
10 Vendor Analysis
- 10.1 Vendors covered
- Exhibit 91: Vendors covered
- 10.2 Market positioning of vendors
- Exhibit 92: Matrix on vendor position and classification
- 10.3 ABB Ltd.
- Exhibit 93: ABB Ltd. - Overview
- Exhibit 94: ABB Ltd. - Business segments
- Exhibit 95: ABB Ltd. - Key offerings
- Exhibit 96: ABB Ltd. - Segment focus
- 10.4 Eaton Corp. Plc
- Exhibit 97: Eaton Corp. Plc - Overview
- Exhibit 98: Eaton Corp. Plc - Business segments
- Exhibit 99: Eaton Corp. Plc - Key news
- Exhibit 100: Eaton Corp. Plc - Key offerings
- Exhibit 101: Eaton Corp. Plc - Segment focus
- 10.5 General Electric Co
- Exhibit 102: General Electric Co - Overview
- Exhibit 103: General Electric Co - Business segments
- Exhibit 104: General Electric Co - Key news
- Exhibit 105: General Electric Co - Key offerings
- Exhibit 106: General Electric Co - Segment focus
- 10.6 Honeywell International Inc.
- Exhibit 107: Honeywell International Inc. - Overview
- Exhibit 108: Honeywell International Inc. - Business segments
- Exhibit 109: Honeywell International Inc. - Key news
- Exhibit 110: Honeywell International Inc. - Key offerings
- Exhibit 111: Honeywell International Inc. - Segment focus
- 10.7 Hubbell Inc.
- Exhibit 112: Hubbell Inc. - Overview
- Exhibit 113: Hubbell Inc. - Business segments
- Exhibit 114: Hubbell Inc. - Key offerings
- Exhibit 115: Hubbell Inc. - Segment focus
- 10.8 Itron Inc.
- Exhibit 116: Itron Inc. - Overview
- Exhibit 117: Itron Inc. - Business segments
- Exhibit 118: Itron Inc. - Key offerings
- Exhibit 119: Itron Inc. - Segment focus
- 10.9 Kamstrup AS
- Exhibit 120: Kamstrup AS - Overview
- Exhibit 121: Kamstrup AS - Business segments
- Exhibit 122: Kamstrup AS - Key offerings
- Exhibit 123: Kamstrup AS - Segment focus
- 10.10 Landis Gyr AG
- Exhibit 124: Landis Gyr AG - Overview
- Exhibit 125: Landis Gyr AG - Business segments
- Exhibit 126: Landis Gyr AG - Key news
- Exhibit 127: Landis Gyr AG - Key offerings
- Exhibit 128: Landis Gyr AG - Segment focus
- 10.11 Networked Energy Services
- Exhibit 129: Networked Energy Services - Overview
- Exhibit 130: Networked Energy Services - Product / Service
- Exhibit 131: Networked Energy Services - Key offerings
- 10.12 Siemens AG
- Exhibit 132: Siemens AG - Overview
- Exhibit 133: Siemens AG - Business segments
- Exhibit 134: Siemens AG - Key news
- Exhibit 135: Siemens AG - Key offerings
- Exhibit 136: Siemens AG - Segment focus
11 Appendix
- 11.1 Scope of the report
- 11.2 Inclusions and exclusions checklist
- Exhibit 137: Inclusions checklist
- Exhibit 138: Exclusions checklist
- 11.3 Currency conversion rates for US$
- Exhibit 139: Currency conversion rates for US$
- 11.4 Research methodology
- Exhibit 140: Research methodology
- Exhibit 141: Validation techniques employed for market sizing
- Exhibit 142: Information sources
- 11.5 List of abbreviations
- Exhibit 143: List of abbreviations
About Us
Technavio is a leading global technology research and advisory company. Their research and analysis focus on emerging market trends and provide actionable insights to help businesses identify market opportunities and develop effective strategies to optimize their market positions. With over 500 specialized analysts, Technavio's report library consists of more than 17,000 reports and counting, covering 800 technologies, spanning across 50 countries. Their client base consists of enterprises of all sizes, including more than 100 Fortune 500 companies. This growing client base relies on Technavio's comprehensive coverage, extensive research, and actionable market insights to identify opportunities in existing and potential markets and assess their competitive positions within changing market scenarios.
Contact
Technavio Research
Jesse Maida
Media & Marketing Executive
US: +1 844 364 1100
UK: +44 203 893 3200
Email: [email protected]
Website: www.technavio.com/
SOURCE Infiniti Research, Inc.


Share this article