To know the exact growth variance and the Y-O-Y growth rate - Request a free sample report.
Radiation Therapy Equipment Market 2022-2026: Scope
Our radiation therapy equipment market report covers the following areas:
Radiation Therapy Equipment Market 2022-2026: Vendor Analysis
The radiation therapy equipment market is fragmented, and the degree of fragmentation will accelerate during the forecast period. Accuray Inc., Bionix LLC, Canon Inc., Carl Zeiss AG, Eckert and Ziegler AG, Elekta AB, Hitachi Ltd., Hologic Inc., iCAD Inc., IntraOp Medical Corp., Ion Beam Applications SA, IsoRay Inc., Mevion Medical Systems Inc., Optivus Proton Therapy Inc., P CURE Ltd., Panacea Medical Technologies Pvt. Ltd., Provision Healthcare, Siemens Healthineers AG, Sotera Health Co., and Sumitomo Heavy Industries Ltd. are some of the major market participants. Few companies with key offerings -
- Accuray Inc. - The company offers radiation therapy equipment named CyberKnife system.
- Bionix LLC - The company offers a wide range of radiation therapy equipment such as TruGuard, MoldCare Pillows, and others
- Carl Zeiss AG - The company offers radiation therapy equipment named INTRABEAM 600.
Radiation Therapy Equipment Market 2022-2026: Drivers & Challenges
The rising occurrence of colorectal cancer, increase in awareness and the increasing geriatric population will offer immense growth opportunities. However, the high cost of radiation therapy equipment will challenge the growth of the market participants. To make the most of the opportunities, market vendors should focus more on the growth prospects in the fast-growing segments,
Radiation Therapy Equipment Market 2022-2026: Segmentation Analysis
- Product
- Geography
- North America
- Europe
- Asia
- Rest Of World (ROW)
Radiation Therapy Equipment Market 2022-2026: Revenue Generating Segment
The radiation therapy equipment market share growth by the external segment will be significant for revenue generation. External radiation therapy equipment uses external beam radiations for treatment. Radiation beams used for treatment may consist of either photons, protons, or electrons. Most radiation therapy equipment uses photon beams. Photon beams can reach tumors present deep inside the body. Moreover, the segment by external radiation therapy equipment is driven by increasing product launches. Such developments would lead to the growth of the market during the forecast period.
To gain further insights on the market contribution of various segments - Download a free sample now!
Radiation Therapy Equipment Market 2022-2026: Key Highlights
- CAGR of the market during the forecast period 2022-2026
- Detailed information on factors that will assist radiation therapy equipment market growth during the next five years
- Estimation of the radiation therapy equipment market size and its contribution to the parent market
- Predictions on upcoming trends and changes in consumer behavior
- The growth of the radiation therapy equipment market
- Analysis of the market's competitive landscape and detailed information on vendors
- Comprehensive details of factors that will challenge the growth of radiation therapy equipment market vendors
Subscribe to our "Lite Plan" billed annually at USD 3000 that enables you to download 3 reports/year and view 3 reports/month.
Related Reports:
Medical Radiation Shielding Market -The medical radiation shielding market share is expected to increase by USD 299.30 million from 2020 to 2025, and the market's growth momentum will accelerate at a CAGR of 4.93%. Download a free sample now!
X-Ray Equipment Market -The global X-ray equipment market has the potential to grow by USD 2.95 billion during 2020-2024, and the market's growth momentum will accelerate throughout the forecast period.Download a free sample now!
Radiation Therapy Equipment Market Scope |
Report Coverage |
Details |
Page number |
120 |
Base year |
2021 |
Forecast period |
2022-2026 |
Growth momentum & CAGR |
Accelerate at a CAGR of 9.19% |
Market growth 2022-2026 |
USD 4.66 billion |
Market structure |
Fragmented |
YoY growth (%) |
7.31 |
Performing market contribution |
North America at 38% |
Competitive landscape |
Leading companies, competitive strategies, consumer engagement scope |
Companies profiled |
Accuray Inc., Bionix LLC, Canon Inc., Carl Zeiss AG, Eckert and Ziegler AG, Elekta AB, Hitachi Ltd., Hologic Inc., iCAD Inc., IntraOp Medical Corp., Ion Beam Applications SA, IsoRay Inc., Mevion Medical Systems Inc., Optivus Proton Therapy Inc., P CURE Ltd., Panacea Medical Technologies Pvt. Ltd., Provision Healthcare, Siemens Healthineers AG, Sotera Health Co., and Sumitomo Heavy Industries Ltd. |
Market Dynamics |
Parent market analysis, Market growth inducers and obstacles, Fast-growing and slow-growing segment analysis, COVID-19 impact and future consumer dynamics, market condition analysis for the forecast period, |
Customization purview |
If our report has not included the data that you are looking for, you can reach out to our analysts and get segments customized. |
Table Of Contents :
1 Executive Summary
- 1.1 Market overview
- Exhibit 01: Executive Summary – Chart on Market Overview
- Exhibit 02: Executive Summary – Data Table on Market Overview
- Exhibit 03: Executive Summary – Chart on Global Market Characteristics
- Exhibit 04: Executive Summary – Chart on Market by Geography
- Exhibit 05: Executive Summary – Chart on Market Segmentation by Product
- Exhibit 06: Executive Summary – Chart on Incremental Growth
- Exhibit 07: Executive Summary – Data Table on Incremental Growth
- Exhibit 08: Executive Summary – Chart on Vendor Market Positioning
2 Market Landscape
- 2.1 Market ecosystem
- Exhibit 09: Parent market
- Exhibit 10: Market Characteristics
3 Market Sizing
- 3.1 Market definition
- Exhibit 11: Offerings of vendors included in the market definition
- 3.2 Market segment analysis
- Exhibit 12: Market segments
- 3.4 Market outlook: Forecast for 2021-2026
- Exhibit 13: Chart on Global - Market size and forecast 2021-2026 ($ million)
- Exhibit 14: Data Table on Global - Market size and forecast 2021-2026 ($ million)
- Exhibit 15: Chart on Global Market: Year-over-year growth 2021-2026 (%)
- Exhibit 16: Data Table on Global Market: Year-over-year growth 2021-2026 (%)
4 Five Forces Analysis
- 4.1 Five forces summary
- Exhibit 17: Five forces analysis - Comparison between 2021 and 2026
- 4.2 Bargaining power of buyers
- Exhibit 18: Bargaining power of buyers – Impact of key factors in 2021 and 2026
- 4.3 Bargaining power of suppliers
- Exhibit 19: Bargaining power of suppliers – Impact of key factors in 2021 and 2026
- 4.4 Threat of new entrants
- Exhibit 20: Threat of new entrants – Impact of key factors in 2021 and 2026
- 4.5 Threat of substitutes
- Exhibit 21: Threat of substitutes – Impact of key factors in 2021 and 2026
- 4.6 Threat of rivalry
- Exhibit 22: Threat of rivalry – Impact of key factors in 2021 and 2026
- 4.7 Market condition
- Exhibit 23: Chart on Market condition - Five forces 2021 and 2026
5 Market Segmentation by Product
- 5.1 Market segments
- Exhibit 24: Chart on Product - Market share 2021-2026 (%)
- Exhibit 25: Data Table on Product - Market share 2021-2026 (%)
- 5.2 Comparison by Product
- Exhibit 26: Chart on Comparison by Product
- Exhibit 27: Data Table on Comparison by Product
- 5.3 External - Market size and forecast 2021-2026
- Exhibit 28: Chart on External - Market size and forecast 2021-2026 ($ million)
- Exhibit 29: Data Table on External - Market size and forecast 2021-2026 ($ million)
- Exhibit 30: Chart on External - Year-over-year growth 2021-2026 (%)
- Exhibit 31: Data Table on External - Year-over-year growth 2021-2026 (%)
- 5.4 Internal - Market size and forecast 2021-2026
- Exhibit 32: Chart on Internal - Market size and forecast 2021-2026 ($ million)
- Exhibit 33: Data Table on Internal - Market size and forecast 2021-2026 ($ million)
- Exhibit 34: Chart on Internal - Year-over-year growth 2021-2026 (%)
- Exhibit 35: Data Table on Internal - Year-over-year growth 2021-2026 (%)
- 5.5 Market opportunity by Product
- Exhibit 36: Market opportunity by Product ($ million)
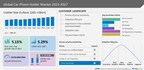
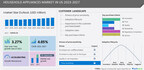
6 Customer Landscape
- 6.1 Customer landscape overview
- Exhibit 37: Analysis of price sensitivity, lifecycle, customer purchase basket, adoption rates, and purchase criteria
7 Geographic Landscape
- 7.1 Geographic segmentation
- Exhibit 38: Chart on Market share by geography 2021-2026 (%)
- Exhibit 39: Data Table on Market share by geography 2021-2026 (%)
- 7.2 Geographic comparison
- Exhibit 40: Chart on Geographic comparison
- Exhibit 41: Data Table on Geographic comparison
- 7.3 North America - Market size and forecast 2021-2026
- Exhibit 42: Chart on North America - Market size and forecast 2021-2026 ($ million)
- Exhibit 43: Data Table on North America - Market size and forecast 2021-2026 ($ million)
- Exhibit 44: Chart on North America - Year-over-year growth 2021-2026 (%)
- Exhibit 45: Data Table on North America - Year-over-year growth 2021-2026 (%)
- 7.4 Europe - Market size and forecast 2021-2026
- Exhibit 46: Chart on Europe - Market size and forecast 2021-2026 ($ million)
- Exhibit 47: Data Table on Europe - Market size and forecast 2021-2026 ($ million)
- Exhibit 48: Chart on Europe - Year-over-year growth 2021-2026 (%)
- Exhibit 49: Data Table on Europe - Year-over-year growth 2021-2026 (%)
- 7.5 Asia - Market size and forecast 2021-2026
- Exhibit 50: Chart on Asia - Market size and forecast 2021-2026 ($ million)
- Exhibit 51: Data Table on Asia - Market size and forecast 2021-2026 ($ million)
- Exhibit 52: Chart on Asia - Year-over-year growth 2021-2026 (%)
- Exhibit 53: Data Table on Asia - Year-over-year growth 2021-2026 (%)
- 7.6 Rest of World (ROW) - Market size and forecast 2021-2026
- Exhibit 54: Chart on Rest of World (ROW) - Market size and forecast 2021-2026 ($ million)
- Exhibit 55: Data Table on Rest of World (ROW) - Market size and forecast 2021-2026 ($ million)
- Exhibit 56: Chart on Rest of World (ROW) - Year-over-year growth 2021-2026 (%)
- Exhibit 57: Data Table on Rest of World (ROW) - Year-over-year growth 2021-2026 (%)
- 7.7 US - Market size and forecast 2021-2026
- Exhibit 58: Chart on US - Market size and forecast 2021-2026 ($ million)
- Exhibit 59: Data Table on US - Market size and forecast 2021-2026 ($ million)
- Exhibit 60: Chart on US - Year-over-year growth 2021-2026 (%)
- Exhibit 61: Data Table on US - Year-over-year growth 2021-2026 (%)
- 7.8 Canada - Market size and forecast 2021-2026
- Exhibit 62: Chart on Canada - Market size and forecast 2021-2026 ($ million)
- Exhibit 63: Data Table on Canada - Market size and forecast 2021-2026 ($ million)
- Exhibit 64: Chart on Canada - Year-over-year growth 2021-2026 (%)
- Exhibit 65: Data Table on Canada - Year-over-year growth 2021-2026 (%)
- 7.9 Germany - Market size and forecast 2021-2026
- Exhibit 66: Chart on Germany - Market size and forecast 2021-2026 ($ million)
- Exhibit 67: Data Table on Germany - Market size and forecast 2021-2026 ($ million)
- Exhibit 68: Chart on Germany - Year-over-year growth 2021-2026 (%)
- Exhibit 69: Data Table on Germany - Year-over-year growth 2021-2026 (%)
- 7.10 Japan - Market size and forecast 2021-2026
- Exhibit 70: Chart on Japan - Market size and forecast 2021-2026 ($ million)
- Exhibit 71: Data Table on Japan - Market size and forecast 2021-2026 ($ million)
- Exhibit 72: Chart on Japan - Year-over-year growth 2021-2026 (%)
- Exhibit 73: Data Table on Japan - Year-over-year growth 2021-2026 (%)
- 7.11 UK - Market size and forecast 2021-2026
- Exhibit 74: Chart on UK - Market size and forecast 2021-2026 ($ million)
- Exhibit 75: Data Table on UK - Market size and forecast 2021-2026 ($ million)
- Exhibit 76: Chart on UK - Year-over-year growth 2021-2026 (%)
- Exhibit 77: Data Table on UK - Year-over-year growth 2021-2026 (%)
- 7.12 Market opportunity by geography
- Exhibit 78: Market opportunity by geography ($ million)
8 Drivers, Challenges, and Trends
- 8.3 Impact of drivers and challenges
- Exhibit 79: Impact of drivers and challenges in 2021 and 2026
9 Vendor Landscape
- 9.2 Vendor landscape
- Exhibit 80: Overview on Criticality of inputs and Factors of differentiation
- 9.3 Landscape disruption
- Exhibit 81: Overview on factors of disruption
- 9.4 Industry risks
- Exhibit 82: Impact of key risks on business
10 Vendor Analysis
- 10.1 Vendors covered
- Exhibit 83: Vendors covered
- 10.2 Market positioning of vendors
- Exhibit 84: Matrix on vendor position and classification
- 10.3 Accuray Inc.
- Exhibit 85: Accuray Inc. - Overview
- Exhibit 86: Accuray Inc. - Business segments
- Exhibit 87: Accuray Inc. - Key offerings
- Exhibit 88: Accuray Inc. - Segment focus
- 10.4 Bionix LLC
- Exhibit 89: Bionix LLC - Overview
- Exhibit 90: Bionix LLC - Product / Service
- Exhibit 91: Bionix LLC - Key news
- Exhibit 92: Bionix LLC - Key offerings
- 10.5 Carl Zeiss AG
- Exhibit 93: Carl Zeiss AG - Overview
- Exhibit 94: Carl Zeiss AG - Business segments
- Exhibit 95: Carl Zeiss AG - Key offerings
- Exhibit 96: Carl Zeiss AG - Segment focus
- 10.6 Eckert and Ziegler AG
- Exhibit 97: Eckert and Ziegler AG - Overview
- Exhibit 98: Eckert and Ziegler AG - Business segments
- Exhibit 99: Eckert and Ziegler AG - Key news
- Exhibit 100: Eckert and Ziegler AG - Key offerings
- Exhibit 101: Eckert and Ziegler AG - Segment focus
- 10.7 Elekta AB
- Exhibit 102: Elekta AB - Overview
- Exhibit 103: Elekta AB - Business segments
- Exhibit 104: Elekta AB - Key news
- Exhibit 105: Elekta AB - Key offerings
- Exhibit 106: Elekta AB - Segment focus
- 10.8 Hologic Inc.
- Exhibit 107: Hologic Inc. - Overview
- Exhibit 108: Hologic Inc. - Business segments
- Exhibit 109: Hologic Inc. - Key news
- Exhibit 110: Hologic Inc. - Key offerings
- Exhibit 111: Hologic Inc. - Segment focus
- 10.9 Ion Beam Applications SA
- Exhibit 112: Ion Beam Applications SA - Overview
- Exhibit 113: Ion Beam Applications SA - Business segments
- Exhibit 114: Ion Beam Applications SA - Key offerings
- Exhibit 115: Ion Beam Applications SA - Segment focus
- 10.10 IsoRay Inc.
- Exhibit 116: IsoRay Inc. - Overview
- Exhibit 117: IsoRay Inc. - Product / Service
- Exhibit 118: IsoRay Inc. - Key offerings
- 10.11 Mevion Medical Systems Inc.
- Exhibit 119: Mevion Medical Systems Inc. - Overview
- Exhibit 120: Mevion Medical Systems Inc. - Product / Service
- Exhibit 121: Mevion Medical Systems Inc. - Key offerings
- 10.12 Siemens Healthineers AG
- Exhibit 122: Siemens Healthineers AG - Overview
- Exhibit 123: Siemens Healthineers AG - Business segments
- Exhibit 124: Siemens Healthineers AG - Key news
- Exhibit 125: Siemens Healthineers AG - Key offerings
- Exhibit 126: Siemens Healthineers AG - Segment focus
11 Appendix
- 11.2 Inclusions and exclusions checklist
- Exhibit 127: Inclusions checklist
- Exhibit 128: Exclusions checklist
- 11.3 Currency conversion rates for US$
- Exhibit 129: Currency conversion rates for US$
- 11.4 Research methodology
- Exhibit 130: Research methodology
- Exhibit 131: Validation techniques employed for market sizing
- Exhibit 132: Information sources
- 11.5 List of abbreviations
- Exhibit 133: List of abbreviations
About Us
Technavio is a leading global technology research and advisory company. Their research and analysis focus on emerging market trends and provides actionable insights to help businesses identify market opportunities and develop effective strategies to optimize their market positions. With over 500 specialized analysts, Technavio's report library consists of more than 17,000 reports and counting, covering 800 technologies, spanning across 50 countries. Their client base consists of enterprises of all sizes, including more than 100 Fortune 500 companies. This growing client base relies on Technavio's comprehensive coverage, extensive research, and actionable market insights to identify opportunities in existing and potential markets and assess their competitive positions within changing market scenarios.
Contact
Technavio Research
Jesse Maida
Media & Marketing Executive
US: +1 844 364 1100
UK: +44 203 893 3200
Email: [email protected]
Website: www.technavio.com/
SOURCE Technavio


Share this article