The market is fragmented, and the degree of fragmentation will accelerate during the forecast period. Agri Mark, Agropur Dairy Cooperative, Alpen Food Group BV, Arla Foods amba, Dairy Farmers of America Inc., Darigold, Fonterra Cooperative Group Ltd., Grassland Dairy Products Inc., Gujarat Cooperative Milk Marketing Federation, Sterling Agro Industries Ltd., Synlait Ltd., and Unilever PLC are some of the major market participants. Request Free Sample Report.
Frequently Asked Questions:
- Based on segmentation by Application, which is the leading segment in the market?
- What are the major trends in the market?
- At what rate is the market projected to grow?
- Who are the top players in the market?
- What are the key market drivers and challenges?
- How big is the Europe market?
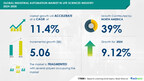
The new product launch, rising launch of food products containing skimmed milk, and increase in the global health-conscious population will offer immense growth opportunities. However, the stringent government regulations are likely to pose a challenge for the market vendors.
In a bid to help players strengthen their market foothold, this skimmed milk market forecast report provides a detailed analysis of the leading market vendors. The report also empowers industry honchos with information on the competitive landscape and insights into the different product offerings offered by various companies. Buy Sample Report.
Skimmed Milk Market Segmentation
- Application
- Bakery And Confectionaries
- Dairy
- Prepared Mixes
- Others
- Geography
- Europe
- APAC
- North America
- South America
- The Middle East And Africa
The bakery and confections category will significantly increase its market share for skim milk. The expansion of bakeries, confectioneries, and improvements in bakery goods will drive market expansion. Due to expanding demand for portable snacks and rising purchasing power in emerging economies for a variety of bread, cakes, and scones, bakery products are becoming more and more popular.
Additionally, the expanding millennial generation is calling for a wider variety of bread-based meals and snacks in the on-the-go food category. During the anticipated years, these elements will propel market expansion through this particular segment. Download Free Sample Report.
Skimmed Milk Market Key Highlights
Related Reports:
- CAGR of the market during the forecast period
- Detailed information on factors that will assist skimmed milk market growth during the next five years
- Estimation of the skimmed milk market size and its contribution to the parent market
- Predictions on upcoming trends and changes in consumer behavior
- The growth of the skimmed milk market across Europe, APAC, North America, South America, and Middle East, and Africa
- Analysis of the market's competitive landscape and detailed information on vendors
- Comprehensive details of factors that will challenge the growth of skimmed milk market vendors
Packaged Edible Flower Market by Product and Geography - Forecast and Analysis 2022-2026: The packaged edible flower market share is expected to increase by USD 107.72 million from 2021 to 2026, and the market's growth momentum will accelerate at a CAGR of 5.75%.
Vegan Cheese Market by Source and Geography - Forecast and Analysis 2022-2026: The vegan cheese market share is expected to increase by USD 1.26 billion from 2021 to 2026, and the market's growth momentum will accelerate at a CAGR of 8.41%.
Skimmed Milk Market Scope |
Report Coverage |
Details |
Page number |
120 |
Base year |
2021 |
Forecast period |
2022-2026 |
Growth momentum & CAGR |
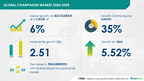
Accelerate at a CAGR of 7.41% |
Market growth 2022-2026 |
$ 4.88 billion |
Market structure |
Fragmented |
YoY growth (%) |
6.39 |
Regional analysis |
Europe, APAC, North America, South America, Middle East, and Africa |
Performing market contribution |
Europe at 36% |
Key consumer countries |
US, India, China, Germany, and Russia |
Competitive landscape |
Leading companies, competitive strategies, consumer engagement scope |
Companies profiled |
Agri Mark, Agropur Dairy Cooperative, Alpen Food Group BV, Arla Foods amba, Dairy Farmers of America Inc., Darigold, Fonterra Cooperative Group Ltd., Grassland Dairy Products Inc., Gujarat Cooperative Milk Marketing Federation, LACTALIS Ingredients, Lactoland Trockenmilchwerk GmbH, Nestle SA, Saputo Inc., Schreiber Foods Inc., Sterling Agro Industries Ltd., Synlait Ltd., and Unilever PLC |
Market Dynamics |
Parent market analysis, Market growth inducers and obstacles, Fast-growing and slow-growing segment analysis, COVID 19 impact and future consumer dynamics, and market condition analysis for the forecast period. |
Customization purview |
If our report has not included the data that you are looking for, you can reach out to our analysts and get segments customized. |
Browse for Technavio "Consumer Staples" Research Reports
Table of Contents
1 Executive Summary
- 1.1 Market Overview
- Exhibit 01: Executive Summary – Chart on Market Overview
- Exhibit 02: Executive Summary – Data Table on Market Overview
- Exhibit 03: Executive Summary – Chart on Global Market Characteristics
- Exhibit 04: Executive Summary – Chart on Market by Geography
- Exhibit 05: Executive Summary – Chart on Market Segmentation by Application
- Exhibit 06: Executive Summary – Chart on Incremental Growth
- Exhibit 07: Executive Summary – Data Table on Incremental Growth
- Exhibit 08: Executive Summary – Chart on Vendor Market Positioning
2 Market Landscape
- 2.1 Market ecosystem
- Exhibit 09: Parent market
- Exhibit 10: Market Characteristics
3 Market Sizing
- 3.1 Market definition
- Exhibit 11: Offerings of vendors included in the market definition
- 3.2 Market segment analysis
- Exhibit 12: Market segments
- 3.4 Market outlook: Forecast for 2021-2026
- Exhibit 13: Chart on Global - Market size and forecast 2021-2026 ($ million)
- Exhibit 14: Data Table on Global - Market size and forecast 2021-2026 ($ million)
- Exhibit 15: Chart on Global Market: Year-over-year growth 2021-2026 (%)
- Exhibit 16: Data Table on Global Market: Year-over-year growth 2021-2026 (%)
4 Five Forces Analysis
- 4.1 Five forces summary
- Exhibit 17: Five forces analysis - Comparison between 2021 and 2026
- 4.2 Bargaining power of buyers
- Exhibit 18: Chart on Bargaining power of buyers – Impact of key factors 2021 and 2026
- 4.3 Bargaining power of suppliers
- Exhibit 19: Bargaining power of suppliers – Impact of key factors in 2021 and 2026
- 4.4 Threat of new entrants
- Exhibit 20: Threat of new entrants – Impact of key factors in 2021 and 2026
- 4.5 Threat of substitutes
- Exhibit 21: Threat of substitutes – Impact of key factors in 2021 and 2026
- 4.6 Threat of rivalry
- Exhibit 22: Threat of rivalry – Impact of key factors in 2021 and 2026
- 4.7 Market condition
- Exhibit 23: Chart on Market condition - Five forces 2021 and 2026
5 Market Segmentation by Application
- 5.1 Market segments
- Exhibit 24: Chart on Application - Market share 2021-2026 (%)
- Exhibit 25: Data Table on Application - Market share 2021-2026 (%)
- 5.2 Comparison by Application
- Exhibit 26: Chart on Comparison by Application
- Exhibit 27: Data Table on Comparison by Application
- 5.3 Bakery and confectionaries - Market size and forecast 2021-2026
- Exhibit 28: Chart on Bakery and confectionaries - Market size and forecast 2021-2026 ($ million)
- Exhibit 29: Data Table on Bakery and confectionaries - Market size and forecast 2021-2026 ($ million)
- Exhibit 30: Chart on Bakery and confectionaries - Year-over-year growth 2021-2026 (%)
- Exhibit 31: Data Table on Bakery and confectionaries - Year-over-year growth 2021-2026 (%)
- 5.4 Dairy - Market size and forecast 2021-2026
- Exhibit 32: Chart on Dairy - Market size and forecast 2021-2026 ($ million)
- Exhibit 33: Data Table on Dairy - Market size and forecast 2021-2026 ($ million)
- Exhibit 34: Chart on Dairy - Year-over-year growth 2021-2026 (%)
- Exhibit 35: Data Table on Dairy - Year-over-year growth 2021-2026 (%)
- 5.5 Prepared mixes - Market size and forecast 2021-2026
- Exhibit 36: Chart on Prepared mixes - Market size and forecast 2021-2026 ($ million)
- Exhibit 37: Data Table on Prepared mixes - Market size and forecast 2021-2026 ($ million)
- Exhibit 38: Chart on Prepared mixes - Year-over-year growth 2021-2026 (%)
- Exhibit 39: Data Table on Prepared mixes - Year-over-year growth 2021-2026 (%)
- 5.6 Others - Market size and forecast 2021-2026
- Exhibit 40: Chart on Others - Market size and forecast 2021-2026 ($ million)
- Exhibit 41: Data Table on Others - Market size and forecast 2021-2026 ($ million)
- Exhibit 42: Chart on Others - Year-over-year growth 2021-2026 (%)
- Exhibit 43: Data Table on Others - Year-over-year growth 2021-2026 (%)
- 5.7 Market opportunity by Application
- Exhibit 44: Market opportunity by Application ($ million)
6 Customer Landscape
- 6.1 Customer landscape overview
- Exhibit 45: Analysis of price sensitivity, lifecycle, customer purchase basket, adoption rates, and purchase criteria
7 Geographic Landscape
- 7.1 Geographic segmentation
- Exhibit 46: Chart on Market share by geography 2021-2026 (%)
- Exhibit 47: Data Table on Market share by geography 2021-2026 (%)
- 7.2 Geographic comparison
- Exhibit 48: Chart on Geographic comparison
- Exhibit 49: Data Table on Geographic comparison
- 7.3 Europe - Market size and forecast 2021-2026
- Exhibit 50: Chart on Europe - Market size and forecast 2021-2026 ($ million)
- Exhibit 51: Data Table on Europe - Market size and forecast 2021-2026 ($ million)
- Exhibit 52: Chart on Europe - Year-over-year growth 2021-2026 (%)
- Exhibit 53: Data Table on Europe - Year-over-year growth 2021-2026 (%)
- 7.4 APAC - Market size and forecast 2021-2026
- Exhibit 54: Chart on APAC - Market size and forecast 2021-2026 ($ million)
- Exhibit 55: Data Table on APAC - Market size and forecast 2021-2026 ($ million)
- Exhibit 56: Chart on APAC - Year-over-year growth 2021-2026 (%)
- Exhibit 57: Data Table on APAC - Year-over-year growth 2021-2026 (%)
- 7.5 North America - Market size and forecast 2021-2026
- Exhibit 58: Chart on North America - Market size and forecast 2021-2026 ($ million)
- Exhibit 59: Data Table on North America - Market size and forecast 2021-2026 ($ million)
- Exhibit 60: Chart on North America - Year-over-year growth 2021-2026 (%)
- Exhibit 61: Data Table on North America - Year-over-year growth 2021-2026 (%)
- 7.6 South America - Market size and forecast 2021-2026
- Exhibit 62: Chart on South America - Market size and forecast 2021-2026 ($ million)
- Exhibit 63: Data Table on South America - Market size and forecast 2021-2026 ($ million)
- Exhibit 64: Chart on South America - Year-over-year growth 2021-2026 (%)
- Exhibit 65: Data Table on South America - Year-over-year growth 2021-2026 (%)
- 7.7 Middle East and Africa - Market size and forecast 2021-2026
- Exhibit 66: Chart on Middle East and Africa - Market size and forecast 2021-2026 ($ million)
- Exhibit 67: Data Table on Middle East and Africa - Market size and forecast 2021-2026 ($ million)
- Exhibit 68: Chart on Middle East and Africa - Year-over-year growth 2021-2026 (%)
- Exhibit 69: Data Table on Middle East and Africa - Year-over-year growth 2021-2026 (%)
- 7.8 US - Market size and forecast 2021-2026
- Exhibit 70: Chart on US - Market size and forecast 2021-2026 ($ million)
- Exhibit 71: Data Table on US - Market size and forecast 2021-2026 ($ million)
- Exhibit 72: Chart on US - Year-over-year growth 2021-2026 (%)
- Exhibit 73: Data Table on US - Year-over-year growth 2021-2026 (%)
- 7.9 India - Market size and forecast 2021-2026
- Exhibit 74: Chart on India - Market size and forecast 2021-2026 ($ million)
- Exhibit 75: Data Table on India - Market size and forecast 2021-2026 ($ million)
- Exhibit 76: Chart on India - Year-over-year growth 2021-2026 (%)
- Exhibit 77: Data Table on India - Year-over-year growth 2021-2026 (%)
- 7.10 Germany - Market size and forecast 2021-2026
- Exhibit 78: Chart on Germany - Market size and forecast 2021-2026 ($ million)
- Exhibit 79: Data Table on Germany - Market size and forecast 2021-2026 ($ million)
- Exhibit 80: Chart on Germany - Year-over-year growth 2021-2026 (%)
- Exhibit 81: Data Table on Germany - Year-over-year growth 2021-2026 (%)
- 7.11 Russia - Market size and forecast 2021-2026
- Exhibit 82: Chart on Russia - Market size and forecast 2021-2026 ($ million)
- Exhibit 83: Data Table on Russia - Market size and forecast 2021-2026 ($ million)
- Exhibit 84: Chart on Russia - Year-over-year growth 2021-2026 (%)
- Exhibit 85: Data Table on Russia - Year-over-year growth 2021-2026 (%)
- 7.12 China - Market size and forecast 2021-2026
- Exhibit 86: Chart on China - Market size and forecast 2021-2026 ($ million)
- Exhibit 87: Data Table on China - Market size and forecast 2021-2026 ($ million)
- Exhibit 88: Chart on China - Year-over-year growth 2021-2026 (%)
- Exhibit 89: Data Table on China - Year-over-year growth 2021-2026 (%)
- 7.13 Market opportunity by geography
- Exhibit 90: Market opportunity by geography ($ million)
8 Drivers, Challenges, and Trends
- 8.3 Impact of drivers and challenges
- Exhibit 91: Impact of drivers and challenges in 2021 and 2026
9 Vendor Landscape
- 9.2 Vendor landscape
- Exhibit 92: Overview on Criticality of inputs and Factors of differentiation
- 9.3 Landscape disruption
- Exhibit 93: Overview on factors of disruption
- 9.4 Industry risks
- Exhibit 94: Impact of key risks on business
10 Vendor Analysis
- 10.1 Vendors covered
- Exhibit 95: Vendors covered
- 10.2 Market positioning of vendors
- Exhibit 96: Matrix on vendor position and classification
- 10.3 Alpen Food Group BV
- Exhibit 97: Alpen Food Group BV - Overview
- Exhibit 98: Alpen Food Group BV - Product / Service
- Exhibit 99: Alpen Food Group BV - Key offerings
- 10.4 Arla Foods amba
- Exhibit 100: Arla Foods amba - Overview
- Exhibit 101: Arla Foods amba - Business segments
- Exhibit 102: Arla Foods amba - Key offerings
- Exhibit 103: Arla Foods amba - Segment focus
- 10.5 Dairy Farmers of America Inc.
- Exhibit 104: Dairy Farmers of America Inc. - Overview
- Exhibit 105: Dairy Farmers of America Inc. - Product / Service
- Exhibit 106: Dairy Farmers of America Inc. - Key offerings
- 10.6 Gujarat Cooperative Milk Marketing Federation
- Exhibit 107: Gujarat Cooperative Milk Marketing Federation - Overview
- Exhibit 108: Gujarat Cooperative Milk Marketing Federation - Product / Service
- Exhibit 109: Gujarat Cooperative Milk Marketing Federation - Key offerings
- 10.7 LACTALIS Ingredients
- Exhibit 110: LACTALIS Ingredients - Overview
- Exhibit 111: LACTALIS Ingredients - Product / Service
- Exhibit 112: LACTALIS Ingredients - Key offerings
- 10.8 Lactoland Trockenmilchwerk GmbH
- Exhibit 113: Lactoland Trockenmilchwerk GmbH - Overview
- Exhibit 114: Lactoland Trockenmilchwerk GmbH - Product / Service
- Exhibit 115: Lactoland Trockenmilchwerk GmbH - Key offerings
- 10.9 Nestle SA
- Exhibit 116: Nestle SA - Overview
- Exhibit 117: Nestle SA - Business segments
- Exhibit 118: Nestle SA - Key news
- Exhibit 119: Nestle SA - Key offerings
- Exhibit 120: Nestle SA - Segment focus
- 10.10 Saputo Inc.
- Exhibit 121: Saputo Inc. - Overview
- Exhibit 122: Saputo Inc. - Business segments
- Exhibit 123: Saputo Inc. - Key news
- Exhibit 124: Saputo Inc. - Key offerings
- Exhibit 125: Saputo Inc. - Segment focus
- 10.11 Schreiber Foods Inc.
- Exhibit 126: Schreiber Foods Inc. - Overview
- Exhibit 127: Schreiber Foods Inc. - Product / Service
- Exhibit 128: Schreiber Foods Inc. - Key offerings
- 10.12 Sterling Agro Industries Ltd.
- Exhibit 129: Sterling Agro Industries Ltd. - Overview
- Exhibit 130: Sterling Agro Industries Ltd. - Product / Service
- Exhibit 131: Sterling Agro Industries Ltd. - Key offerings
11 Appendix
About Us
- 11.2 Inclusions and exclusions checklist
- Exhibit 132: Inclusions checklist
- Exhibit 133: Exclusions checklist
- 11.3 Currency conversion rates for US$
- Exhibit 134: Currency conversion rates for US$
- 11.4 Research methodology
- Exhibit 135: Research methodology
- Exhibit 136: Validation techniques employed for market sizing
- Exhibit 137: Information sources
- 11.5 List of abbreviations
- Exhibit 138: List of abbreviations
Technavio is a leading global technology research and advisory company. Their research and analysis focuses on emerging market trends and provides actionable insights to help businesses identify market opportunities and develop effective strategies to optimize their market positions. With over 500 specialized analysts, Technavio's report library consists of more than 17,000 reports and counting, covering 800 technologies, spanning across 50 countries. Their client base consists of enterprises of all sizes, including more than 100 Fortune 500 companies. This growing client base relies on Technavio's comprehensive coverage, extensive research, and actionable market insights to identify opportunities in existing and potential markets and assess their competitive positions within changing market scenarios.
Contact
Technavio Research
Jesse Maida
Media & Marketing Executive
US: +1 844 364 1100
UK: +44 203 893 3200
Email: [email protected]
Website: www.technavio.com/
SOURCE Technavio


Share this article