The solar array disconnect switches market size is expected to grow by USD 3.16 billion from 2021 to 2026. Moreover, the growth momentum of the market will accelerate at a CAGR of 16.55% during the forecast period.
Find more insights into market dynamics of the solar array disconnect switches market. View a Sample Report
Solar Array Disconnect Switches Market: Segmentation Analysis
Segmentation by Application:
- Based on application, the market has been segmented into utility and non-utility.
- The utility segment will have significant market share growth during the forecast period.
- The shift to sustainable energy sources and the presence of agreements, such as the Paris Agreement on climate change, have fueled the demand for solar array disconnect switches in recent years.
- The rising demand for electricity due to the ever-rising population will propel the utility segment of the global solar array disconnect switches market during the forecast period.
Segmentation by Geography:
- By geography, the market has been segmented into APAC, Europe, North America, South America, and the Middle East and Africa.
- APAC will have significant market share growth during the forecast period.
- The government initiatives and financial incentive programs such as FIT in China and Japan will drive the solar array disconnect switches market growth in APAC during the forecast period.
- Moreover, market growth in this region will be faster than the growth of the market in other regions.
- China, Vietnam, Japan, and Australia are the key countries in the solar array disconnect switches market in APAC.
For more information related to the contribution of each segment of the solar array disconnect switches market, Request a Sample Report Now
Solar Array Disconnect Switches Market: Major Vendors
The solar array disconnect switches market is concentrated, and the vendors are deploying growth strategies such as mergers and acquisitions and collaboration to compete in the market. The report offers detailed information on the competencies, capacities, and products offered by major vendors, including ABB Ltd., Bentek Corp., Bremas Ersce Spa, Eaton Corp. Plc, Mersen Corporate Services SAS, MidNite Solar Inc., ProJoy Electric Co. Ltd., Salzer Electronics Ltd., Santon International BV, Schneider Electric SE, Siemens AG, SOCOMEC Group, and SUNTREE Electric Group Co. Ltd., among others.
For more details about key vendors in the solar array disconnect switches market and their offerings, View our Sample Report
Related Reports:
Battery Monitoring Systems Market by End-user and Geography - Forecast and Analysis 2022-2026
Solar Cable Systems Market by Application and Geography - Forecast and Analysis 2022-2026
Solar Array Disconnect Switches Market Scope |
Report Coverage |
Details |
Page number |
120 |
Base year |
2021 |
Forecast period |
2022-2026 |
Growth momentum & CAGR |
Accelerate at a CAGR of 16.55% |
Market growth 2022-2026 |
USD 3.16 billion |
Market structure |
Concentrated |
YoY growth (%) |
16.0 |
Regional analysis |
APAC, Europe, North America, South America, and Middle East and Africa |
Performing market contribution |
APAC at 56% |
Key consumer countries |
US, China, Vietnam, Japan, and Australia |
Competitive landscape |
Leading companies, Competitive strategies, Consumer engagement scope |
Key companies profiled |
ABB Ltd., Bentek Corp., Bremas Ersce Spa, Eaton Corp. Plc, Mersen Corporate Services SAS, MidNite Solar Inc., ProJoy Electric Co. Ltd., Salzer Electronics Ltd., Santon International BV, Schneider Electric SE, Siemens AG, SOCOMEC Group, and SUNTREE Electric Group Co. Ltd. |
Market dynamics |
Parent market analysis, Market growth inducers and obstacles, Fast-growing and slow-growing segment analysis, COVID 19 impact and recovery analysis and future consumer dynamics, Market condition analysis for the forecast period |
Customization purview |
If our report has not included the data that you are looking for, you can reach out to our analysts and get segments customized. |
Table of Contents
1 Executive Summary
- 1.1 Market overview
- Exhibit 01: Executive Summary – Chart on Market Overview
- Exhibit 02: Executive Summary – Data Table on Market Overview
- Exhibit 03: Executive Summary – Chart on Global Market Characteristics
- Exhibit 04: Executive Summary – Chart on Market by Geography
- Exhibit 05: Executive Summary – Chart on Market Segmentation by Application
- Exhibit 06: Executive Summary – Chart on Incremental Growth
- Exhibit 07: Executive Summary – Data Table on Incremental Growth
- Exhibit 08: Executive Summary – Chart on Vendor Market Positioning
2 Market Landscape
- 2.1 Market ecosystem
- Exhibit 09: Parent market
- Exhibit 10: Market Characteristics
3 Market Sizing
- 3.1 Market definition
- Exhibit 11: Offerings of vendors included in the market definition
- 3.2 Market segment analysis
- Exhibit 12: Market segments
- 3.4 Market outlook: Forecast for 2021-2026
- Exhibit 13: Chart on Global - Market size and forecast 2021-2026 ($ million)
- Exhibit 14: Data Table on Global - Market size and forecast 2021-2026 ($ million)
- Exhibit 15: Chart on Global Market: Year-over-year growth 2021-2026 (%)
- Exhibit 16: Data Table on Global Market: Year-over-year growth 2021-2026 (%)
4 Five Forces Analysis
- 4.1 Five forces summary
- Exhibit 17: Five forces analysis - Comparison between 2021 and 2026
- 4.2 Bargaining power of buyers
- Exhibit 18: Chart on Bargaining power of buyers – Impact of key factors 2021 and 2026
- 4.3 Bargaining power of suppliers
- Exhibit 19: Bargaining power of suppliers – Impact of key factors in 2021 and 2026
- 4.4 Threat of new entrants
- Exhibit 20: Threat of new entrants – Impact of key factors in 2021 and 2026
- 4.5 Threat of substitutes
- Exhibit 21: Threat of substitutes – Impact of key factors in 2021 and 2026
- 4.6 Threat of rivalry
- Exhibit 22: Threat of rivalry – Impact of key factors in 2021 and 2026
- 4.7 Market condition
- Exhibit 23: Chart on Market condition - Five forces 2021 and 2026
5 Market Segmentation by Application
- 5.1 Market segments
- Exhibit 24: Chart on Application - Market share 2021-2026 (%)
- Exhibit 25: Data Table on Application - Market share 2021-2026 (%)
- 5.2 Comparison by Application
- Exhibit 26: Chart on Comparison by Application
- Exhibit 27: Data Table on Comparison by Application
- 5.3 Utility - Market size and forecast 2021-2026
- Exhibit 28: Chart on Utility - Market size and forecast 2021-2026 ($ million)
- Exhibit 29: Data Table on Utility - Market size and forecast 2021-2026 ($ million)
- Exhibit 30: Chart on Utility - Year-over-year growth 2021-2026 (%)
- Exhibit 31: Data Table on Utility - Year-over-year growth 2021-2026 (%)
- 5.4 Non-utility - Market size and forecast 2021-2026
- Exhibit 32: Chart on Non-utility - Market size and forecast 2021-2026 ($ million)
- Exhibit 33: Data Table on Non-utility - Market size and forecast 2021-2026 ($ million)
- Exhibit 34: Chart on Non-utility - Year-over-year growth 2021-2026 (%)
- Exhibit 35: Data Table on Non-utility - Year-over-year growth 2021-2026 (%)
- 5.5 Market opportunity by Application
- Exhibit 36: Market opportunity by Application ($ million)
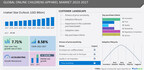
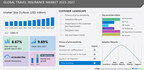
6 Customer Landscape
- 6.1 Customer landscape overview
- Exhibit 37: Analysis of price sensitivity, lifecycle, customer purchase basket, adoption rates, and purchase criteria
7 Geographic Landscape
- 7.1 Geographic segmentation
- Exhibit 38: Chart on Market share by geography 2021-2026 (%)
- Exhibit 39: Data Table on Market share by geography 2021-2026 (%)
- 7.2 Geographic comparison
- Exhibit 40: Chart on Geographic comparison
- Exhibit 41: Data Table on Geographic comparison
- 7.3 APAC - Market size and forecast 2021-2026
- Exhibit 42: Chart on APAC - Market size and forecast 2021-2026 ($ million)
- Exhibit 43: Data Table on APAC - Market size and forecast 2021-2026 ($ million)
- Exhibit 44: Chart on APAC - Year-over-year growth 2021-2026 (%)
- Exhibit 45: Data Table on APAC - Year-over-year growth 2021-2026 (%)
- 7.4 Europe - Market size and forecast 2021-2026
- Exhibit 46: Chart on Europe - Market size and forecast 2021-2026 ($ million)
- Exhibit 47: Data Table on Europe - Market size and forecast 2021-2026 ($ million)
- Exhibit 48: Chart on Europe - Year-over-year growth 2021-2026 (%)
- Exhibit 49: Data Table on Europe - Year-over-year growth 2021-2026 (%)
- 7.5 North America - Market size and forecast 2021-2026
- Exhibit 50: Chart on North America - Market size and forecast 2021-2026 ($ million)
- Exhibit 51: Data Table on North America - Market size and forecast 2021-2026 ($ million)
- Exhibit 52: Chart on North America - Year-over-year growth 2021-2026 (%)
- Exhibit 53: Data Table on North America - Year-over-year growth 2021-2026 (%)
- 7.6 South America - Market size and forecast 2021-2026
- Exhibit 54: Chart on South America - Market size and forecast 2021-2026 ($ million)
- Exhibit 55: Data Table on South America - Market size and forecast 2021-2026 ($ million)
- Exhibit 56: Chart on South America - Year-over-year growth 2021-2026 (%)
- Exhibit 57: Data Table on South America - Year-over-year growth 2021-2026 (%)
- 7.7 Middle East and Africa - Market size and forecast 2021-2026
- Exhibit 58: Chart on Middle East and Africa - Market size and forecast 2021-2026 ($ million)
- Exhibit 59: Data Table on Middle East and Africa - Market size and forecast 2021-2026 ($ million)
- Exhibit 60: Chart on Middle East and Africa - Year-over-year growth 2021-2026 (%)
- Exhibit 61: Data Table on Middle East and Africa - Year-over-year growth 2021-2026 (%)
- 7.8 China - Market size and forecast 2021-2026
- Exhibit 62: Chart on China - Market size and forecast 2021-2026 ($ million)
- Exhibit 63: Data Table on China - Market size and forecast 2021-2026 ($ million)
- Exhibit 64: Chart on China - Year-over-year growth 2021-2026 (%)
- Exhibit 65: Data Table on China - Year-over-year growth 2021-2026 (%)
- 7.9 US - Market size and forecast 2021-2026
- Exhibit 66: Chart on US - Market size and forecast 2021-2026 ($ million)
- Exhibit 67: Data Table on US - Market size and forecast 2021-2026 ($ million)
- Exhibit 68: Chart on US - Year-over-year growth 2021-2026 (%)
- Exhibit 69: Data Table on US - Year-over-year growth 2021-2026 (%)
- 7.10 Vietnam - Market size and forecast 2021-2026
- Exhibit 70: Chart on Vietnam - Market size and forecast 2021-2026 ($ million)
- Exhibit 71: Data Table on Vietnam - Market size and forecast 2021-2026 ($ million)
- Exhibit 72: Chart on Vietnam - Year-over-year growth 2021-2026 (%)
- Exhibit 73: Data Table on Vietnam - Year-over-year growth 2021-2026 (%)
- 7.11 Japan - Market size and forecast 2021-2026
- Exhibit 74: Chart on Japan - Market size and forecast 2021-2026 ($ million)
- Exhibit 75: Data Table on Japan - Market size and forecast 2021-2026 ($ million)
- Exhibit 76: Chart on Japan - Year-over-year growth 2021-2026 (%)
- Exhibit 77: Data Table on Japan - Year-over-year growth 2021-2026 (%)
- 7.12 Australia - Market size and forecast 2021-2026
- Exhibit 78: Chart on Australia - Market size and forecast 2021-2026 ($ million)
- Exhibit 79: Data Table on Australia - Market size and forecast 2021-2026 ($ million)
- Exhibit 80: Chart on Australia - Year-over-year growth 2021-2026 (%)
- Exhibit 81: Data Table on Australia - Year-over-year growth 2021-2026 (%)
- 7.13 Market opportunity by geography
- Exhibit 82: Market opportunity by geography ($ million)
8 Drivers, Challenges, and Trends
- 8.3 Impact of drivers and challenges
- Exhibit 83: Impact of drivers and challenges in 2021 and 2026
9 Vendor Landscape
- 9.2 Vendor landscape
- Exhibit 84: Overview on Criticality of inputs and Factors of differentiation
- 9.3 Landscape disruption
- Exhibit 85: Overview on factors of disruption
- 9.4 Industry risks
- Exhibit 86: Impact of key risks on business
10 Vendor Analysis
- 10.1 Vendors covered
- Exhibit 87: Vendors covered
- 10.2 Market positioning of vendors
- Exhibit 88: Matrix on vendor position and classification
- 10.3 ABB Ltd.
- Exhibit 89: ABB Ltd. - Overview
- Exhibit 90: ABB Ltd. - Business segments
- Exhibit 91: ABB Ltd. - Key news
- Exhibit 92: ABB Ltd. - Key offerings
- Exhibit 93: ABB Ltd. - Segment focus
- 10.4 Bentek Corp.
- Exhibit 94: Bentek Corp. - Overview
- Exhibit 95: Bentek Corp. - Product / Service
- Exhibit 96: Bentek Corp. - Key offerings
- 10.5 Bremas Ersce Spa
- Exhibit 97: Bremas Ersce Spa - Overview
- Exhibit 98: Bremas Ersce Spa - Product / Service
- Exhibit 99: Bremas Ersce Spa - Key offerings
- 10.6 Eaton Corp. Plc
- Exhibit 100: Eaton Corp. Plc - Overview
- Exhibit 101: Eaton Corp. Plc - Business segments
- Exhibit 102: Eaton Corp. Plc - Key news
- Exhibit 103: Eaton Corp. Plc - Key offerings
- Exhibit 104: Eaton Corp. Plc - Segment focus
- 10.7 Mersen Corporate Services SAS
- Exhibit 105: Mersen Corporate Services SAS - Overview
- Exhibit 106: Mersen Corporate Services SAS - Business segments
- Exhibit 107: Mersen Corporate Services SAS - Key offerings
- Exhibit 108: Mersen Corporate Services SAS - Segment focus
- 10.8 ProJoy Electric Co. Ltd.
- Exhibit 109: ProJoy Electric Co. Ltd. - Overview
- Exhibit 110: ProJoy Electric Co. Ltd. - Product / Service
- Exhibit 111: ProJoy Electric Co. Ltd. - Key offerings
- 10.9 Salzer Electronics Ltd.
- Exhibit 112: Salzer Electronics Ltd. - Overview
- Exhibit 113: Salzer Electronics Ltd. - Product / Service
- Exhibit 114: Salzer Electronics Ltd. - Key offerings
- 10.10 Santon International BV
- Exhibit 115: Santon International BV - Overview
- Exhibit 116: Santon International BV - Product / Service
- Exhibit 117: Santon International BV - Key offerings
- 10.11 Schneider Electric SE
- Exhibit 118: Schneider Electric SE - Overview
- Exhibit 119: Schneider Electric SE - Business segments
- Exhibit 120: Schneider Electric SE - Key news
- Exhibit 121: Schneider Electric SE - Key offerings
- Exhibit 122: Schneider Electric SE - Segment focus
- 10.12 Siemens AG
- Exhibit 123: Siemens AG - Overview
- Exhibit 124: Siemens AG - Business segments
- Exhibit 125: Siemens AG - Key news
- Exhibit 126: Siemens AG - Key offerings
- Exhibit 127: Siemens AG - Segment focus
11 Appendix
- 11.2 Inclusions and exclusions checklist
- Exhibit 128: Inclusions checklist
- Exhibit 129: Exclusions checklist
- 11.3 Currency conversion rates for US$
- Exhibit 130: Currency conversion rates for US$
- 11.4 Research methodology
- Exhibit 131: Research methodology
- Exhibit 132: Validation techniques employed for market sizing
- Exhibit 133: Information sources
- 11.5 List of abbreviations
- Exhibit 134: List of abbreviations
About Technavio
Technavio is a leading global technology research and advisory company. Their research and analysis focuses on emerging market trends and provides actionable insights to help businesses identify market opportunities and develop effective strategies to optimize their market positions.
With over 500 specialized analysts, Technavio's report library consists of more than 17,000 reports and counting, covering 800 technologies, spanning across 50 countries. Their client base consists of enterprises of all sizes, including more than 100 Fortune 500 companies. This growing client base relies on Technavio's comprehensive coverage, extensive research, and actionable market insights to identify opportunities in existing and potential markets and assess their competitive positions within changing market scenarios.
Contacts
Technavio Research
Jesse Maida
Media & Marketing Executive
US: +1 844 364 1100
UK: +44 203 893 3200
Email: [email protected]
Website: www.technavio.com/
SOURCE Technavio


Share this article