Threat Intelligence Security Market to record USD 14.03 Bn incremental growth; North America to have a significant market share -- Technavio

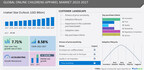
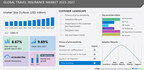
NEW YORK, Oct. 12, 2022 /PRNewswire/ -- The global threat intelligence security market size is expected to increase by USD 14.03 billion, accelerating at a CAGR of 23.96% between 2021 and 2026. The report expects the market growth to be significant in North America during the forecast period. The increased incidences of cyberattacks on information systems are creating huge growth opportunities for vendors operating in the region. Download Sample PDF Report Here
The market is driven by the rising number of cyberattacks on connected devices or systems. The number of data breaches is increasing at an alarming rate globally. The average cost of a data breach is substantially high and can run into millions and companies must bear it if their networks are compromised and the attack is successful. Malicious attacks come from external sources, such as professional hackers, and are mainly intended to make financial gains from stolen data. Data breaches adversely impact businesses as stolen information can be misused or deployed for unethical practices. Hence, businesses are increasingly adopting threat intelligence services and platforms to shield and protect their sensitive information systems and gain an edge over cyber criminals. All these factors are driving the growth of the market.
In addition, the increasing adoption of mobility and IoT expanding the attack surface and ransomware attackers targeting enterprises will further propel the market growth. However, the increasing complexity of IT infrastructure will hamper the market growth.
Threat Intelligence Security Market: End-user Landscape
- By end-users, the market is analyzed across segments such as BFSI, IT and telecom, healthcare, transportation and logistics, and others.
- BFSI companies are the major end-users of threat intelligence security solutions. The continuous targeting of the BFSI sector by cybercriminals is driving the growth of the segment. Also, increasing digital payments is contributing to the growth of the segment.
Threat Intelligence Security Market: Geographic Landscape
By geography, North America is going to have lucrative growth during the forecast period. About 35% of the market's overall growth is expected to originate from North America. The threat intelligence security market in North America is growing rapidly because of the increased investments in threat intelligence security solutions by companies and the increasing application of threat intelligence solutions in commercial and industrial activities that involve data generation.
Gain insights into the key segments having high growth potential over the forecast period. Start
by Downloading Sample Report
Companies Covered:
- Anomali Inc.
- BlueVoyant
- Check Point Software Technologies Ltd.
- Cisco Systems Inc.
- CrowdStrike Holdings Inc.
- Datto Holdings Corp.
- DomainTools LLC
- F Secure Corp.
- Fortinet Inc.
- Intel Corp.
- International Business Machines Corp.
- Juniper Networks Inc.
- LogRhythm Inc.
- LookingGlass Cyber Solutions Inc.
- Mandiant Inc.
- NortonLifeLock Inc.
- Open Text Corp.
- Optiv Security Inc.
- Palo Alto Networks Inc.
- Splunk Inc.
- Trellix
- Trend Micro Inc.
What our reports offer:
- Market share assessments for the regional and country-level segments
- Strategic recommendations for the new entrants
- Covers market data for 2021, 2022, until 2026
- Market trends (drivers, opportunities, threats, challenges, investment opportunities, and recommendations)
- Strategic recommendations in key business segments based on the market estimations
- Competitive landscaping mapping the key common trends
- Company profiling with detailed strategies, financials, and recent developments
- Supply chain trends mapping the latest technological advancements. Request Sample Report Now
Related Reports:
- Artificial Intelligence-based Cybersecurity Market by End-user and Geography -
Forecast and Analysis 2021-2025 - Cybersecurity Market by Deployment and Geography - Forecast and Analysis
2021-2025
Threat Intelligence Security Market Scope |
|
Report Coverage |
Details |
Page number |
120 |
Base year |
2021 |
Forecast period |
2022-2026 |
Growth momentum & CAGR |
Accelerate at a CAGR of 23.96% |
Market growth 2022-2026 |
USD 14.03 billion |
Market structure |
Fragmented |
YoY growth (%) |
22.88 |
Regional analysis |
North America, Europe, APAC, South America, and the Middle East and Africa |
Performing market contribution |
North America at 35% |
Key consumer countries |
US, China, India, UK, and Germany |
Competitive landscape |
Leading companies, competitive strategies, consumer engagement scope |
Companies profiled |
Anomali Inc., BlueVoyant, Check Point Software Technologies Ltd., Cisco Systems Inc., CrowdStrike Holdings Inc., Datto Holdings Corp., DomainTools LLC, F Secure Corp., Fortinet Inc., Intel Corp., International Business Machines Corp., Juniper Networks Inc., LogRhythm Inc., LookingGlass Cyber Solutions Inc., Mandiant Inc., NortonLifeLock Inc., Open Text Corp., Optiv Security Inc., Palo Alto Networks Inc., Splunk Inc., Trellix, and Trend Micro Inc. |
Market Dynamics |
Parent market analysis, Market growth inducers and obstacles, Fast-growing and slow-growing segment analysis, COVID-19 impact and future consumer dynamics, and market condition analysis for the forecast period. |
Customization purview |
If our report has not included the data that you are looking for, you can reach out to our analysts and get segments customized. |
Table of contents:
1 Executive Summary
- 1.1 Market overview
- Exhibit 01: Executive Summary – Chart on Market Overview
- Exhibit 02: Executive Summary – Data Table on Market Overview
- Exhibit 03: Executive Summary – Chart on Global Market Characteristics
- Exhibit 04: Executive Summary – Chart on Market by Geography
- Exhibit 05: Executive Summary – Chart on Market Segmentation by End-user
- Exhibit 06: Executive Summary – Chart on Incremental Growth
- Exhibit 07: Executive Summary – Data Table on Incremental Growth
- Exhibit 08: Executive Summary – Chart on Vendor Market Positioning
2 Market Landscape
- 2.1 Market ecosystem
- Exhibit 09: Parent market
- Exhibit 10: Market Characteristics
3 Market Sizing
- 3.1 Market definition
- Exhibit 11: Offerings of vendors included in the market definition
- 3.2 Market segment analysis
- Exhibit 12: Market segments
- 3.3 Market size 2021
- 3.4 Market outlook: Forecast for 2021-2026
- Exhibit 13: Chart on Global - Market size and forecast 2021-2026 ($ million)
- Exhibit 14: Data Table on Global - Market size and forecast 2021-2026 ($ million)
- Exhibit 15: Chart on Global Market: Year-over-year growth 2021-2026 (%)
- Exhibit 16: Data Table on Global Market: Year-over-year growth 2021-2026 (%)
4 Five Forces Analysis
- 4.1 Five forces summary
- Exhibit 17: Five forces analysis - Comparison between2021 and 2026
- 4.2 Bargaining power of buyers
- Exhibit 18: Chart on Bargaining power of buyers – Impact of key factors 2021 and 2026
- 4.3 Bargaining power of suppliers
- Exhibit 19: Bargaining power of suppliers – Impact of key factors in 2021 and 2026
- 4.4 Threat of new entrants
- Exhibit 20: Threat of new entrants – Impact of key factors in 2021 and 2026
- 4.5 Threat of substitutes
- Exhibit 21: Threat of substitutes – Impact of key factors in 2021 and 2026
- 4.6 Threat of rivalry
- Exhibit 22: Threat of rivalry – Impact of key factors in 2021 and 2026
- 4.7 Market condition
- Exhibit 23: Chart on Market condition - Five forces 2021 and 2026
5 Market Segmentation by End-user
- 5.1 Market segments
- Exhibit 24: Chart on End-user - Market share 2021-2026 (%)
- Exhibit 25: Data Table on End-user - Market share 2021-2026 (%)
- 5.2 Comparison by End-user
- Exhibit 26: Chart on Comparison by End-user
- Exhibit 27: Data Table on Comparison by End-user
- 5.3 BFSI - Market size and forecast 2021-2026
- Exhibit 28: Chart on BFSI - Market size and forecast 2021-2026 ($ million)
- Exhibit 29: Data Table on BFSI - Market size and forecast 2021-2026 ($ million)
- Exhibit 30: Chart on BFSI - Year-over-year growth 2021-2026 (%)
- Exhibit 31: Data Table on BFSI - Year-over-year growth 2021-2026 (%)
- 5.4 IT and telecom - Market size and forecast 2021-2026
- Exhibit 32: Chart on IT and telecom - Market size and forecast 2021-2026 ($ million)
- Exhibit 33: Data Table on IT and telecom - Market size and forecast 2021-2026 ($ million)
- Exhibit 34: Chart on IT and telecom - Year-over-year growth 2021-2026 (%)
- Exhibit 35: Data Table on IT and telecom - Year-over-year growth 2021-2026 (%)
- 5.5 Healthcare - Market size and forecast 2021-2026
- Exhibit 36: Chart on Healthcare - Market size and forecast 2021-2026 ($ million)
- Exhibit 37: Data Table on Healthcare - Market size and forecast 2021-2026 ($ million)
- Exhibit 38: Chart on Healthcare - Year-over-year growth 2021-2026 (%)
- Exhibit 39: Data Table on Healthcare - Year-over-year growth 2021-2026 (%)
- 5.6 Transportation and logistics - Market size and forecast 2021-2026
- Exhibit 40: Chart on Transportation and logistics - Market size and forecast 2021-2026 ($ million)
- Exhibit 41: Data Table on Transportation and logistics - Market size and forecast 2021-2026 ($ million)
- Exhibit 42: Chart on Transportation and logistics - Year-over-year growth 2021-2026 (%)
- Exhibit 43: Data Table on Transportation and logistics - Year-over-year growth 2021-2026 (%)
- 5.7 Others - Market size and forecast 2021-2026
- Exhibit 44: Chart on Others - Market size and forecast 2021-2026 ($ million)
- Exhibit 45: Data Table on Others - Market size and forecast 2021-2026 ($ million)
- Exhibit 46: Chart on Others - Year-over-year growth 2021-2026 (%)
- Exhibit 47: Data Table on Others - Year-over-year growth 2021-2026 (%)
- 5.8 Market opportunity by End-user
- Exhibit 48: Market opportunity by End-user ($ million)
6 Customer Landscape
- 6.1 Customer landscape overview
- Exhibit 49: Analysis of price sensitivity, lifecycle, customer purchase basket, adoption rates, and purchase criteria
7 Geographic Landscape
- 7.1 Geographic segmentation
- Exhibit 50: Chart on Market share by geography 2021-2026 (%)
- Exhibit 51: Data Table on Market share by geography 2021-2026 (%)
- 7.2 Geographic comparison
- Exhibit 52: Chart on Geographic comparison
- Exhibit 53: Data Table on Geographic comparison
- 7.3 North America - Market size and forecast 2021-2026
- Exhibit 54: Chart on North America - Market size and forecast 2021-2026 ($ million)
- Exhibit 55: Data Table on North America - Market size and forecast 2021-2026 ($ million)
- Exhibit 56: Chart on North America - Year-over-year growth 2021-2026 (%)
- Exhibit 57: Data Table on North America - Year-over-year growth 2021-2026 (%)
- 7.4 Europe - Market size and forecast 2021-2026
- Exhibit 58: Chart on Europe - Market size and forecast 2021-2026 ($ million)
- Exhibit 59: Data Table on Europe - Market size and forecast 2021-2026 ($ million)
- Exhibit 60: Chart on Europe - Year-over-year growth 2021-2026 (%)
- Exhibit 61: Data Table on Europe - Year-over-year growth 2021-2026 (%)
- 7.5 APAC - Market size and forecast 2021-2026
- Exhibit 62: Chart on APAC - Market size and forecast 2021-2026 ($ million)
- Exhibit 63: Data Table on APAC - Market size and forecast 2021-2026 ($ million)
- Exhibit 64: Chart on APAC - Year-over-year growth 2021-2026 (%)
- Exhibit 65: Data Table on APAC - Year-over-year growth 2021-2026 (%)
- 7.6 South America - Market size and forecast 2021-2026
- Exhibit 66: Chart on South America - Market size and forecast 2021-2026 ($ million)
- Exhibit 67: Data Table on South America - Market size and forecast 2021-2026 ($ million)
- Exhibit 68: Chart on South America - Year-over-year growth 2021-2026 (%)
- Exhibit 69: Data Table on South America - Year-over-year growth 2021-2026 (%)
- 7.7 Middle East and Africa - Market size and forecast 2021-2026
- Exhibit 70: Chart on Middle East and Africa - Market size and forecast 2021-2026 ($ million)
- Exhibit 71: Data Table on Middle East and Africa - Market size and forecast 2021-2026 ($ million)
- Exhibit 72: Chart on Middle East and Africa - Year-over-year growth 2021-2026 (%)
- Exhibit 73: Data Table on Middle East and Africa - Year-over-year growth 2021-2026 (%)
- 7.8 US - Market size and forecast 2021-2026
- Exhibit 74: Chart on US - Market size and forecast 2021-2026 ($ million)
- Exhibit 75: Data Table on US - Market size and forecast 2021-2026 ($ million)
- Exhibit 76: Chart on US - Year-over-year growth 2021-2026 (%)
- Exhibit 77: Data Table on US - Year-over-year growth 2021-2026 (%)
- 7.9 China - Market size and forecast 2021-2026
- Exhibit 78: Chart on China - Market size and forecast 2021-2026 ($ million)
- Exhibit 79: Data Table on China - Market size and forecast 2021-2026 ($ million)
- Exhibit 80: Chart on China - Year-over-year growth 2021-2026 (%)
- Exhibit 81: Data Table on China - Year-over-year growth 2021-2026 (%)
- 7.10 India - Market size and forecast 2021-2026
- Exhibit 82: Chart on India - Market size and forecast 2021-2026 ($ million)
- Exhibit 83: Data Table on India - Market size and forecast 2021-2026 ($ million)
- Exhibit 84: Chart on India - Year-over-year growth 2021-2026 (%)
- Exhibit 85: Data Table on India - Year-over-year growth 2021-2026 (%)
- 7.11 UK - Market size and forecast 2021-2026
- Exhibit 86: Chart on UK - Market size and forecast 2021-2026 ($ million)
- Exhibit 87: Data Table on UK - Market size and forecast 2021-2026 ($ million)
- Exhibit 88: Chart on UK - Year-over-year growth 2021-2026 (%)
- Exhibit 89: Data Table on UK - Year-over-year growth 2021-2026 (%)
- 7.12 Germany - Market size and forecast 2021-2026
- Exhibit 90: Chart on Germany - Market size and forecast 2021-2026 ($ million)
- Exhibit 91: Data Table on Germany - Market size and forecast 2021-2026 ($ million)
- Exhibit 92: Chart on Germany - Year-over-year growth 2021-2026 (%)
- Exhibit 93: Data Table on Germany - Year-over-year growth 2021-2026 (%)
- 7.13 Market opportunity by geography
- Exhibit 94: Market opportunity by geography ($ million)
8 Drivers, Challenges, and Trends
- 8.1 Market drivers
- 8.2 Market challenges
- 8.3 Impact of drivers and challenges
- Exhibit 95: Impact of drivers and challenges in 2021 and 2026
- 8.4 Market trends
9 Vendor Landscape
- 9.1 Overview
- 9.2 Vendor landscape
- Exhibit 96: Overview on Criticality of inputs and Factors of differentiation
- 9.3 Landscape disruption
- Exhibit 97: Overview on factors of disruption
- 9.4 Industry risks
- Exhibit 98: Impact of key risks on business
10 Vendor Analysis
- 10.1 Vendors covered
- Exhibit 99: Vendors covered
- 10.2 Market positioning of vendors
- Exhibit 100: Matrix on vendor position and classification
- 10.3 Check Point Software Technologies Ltd.
- Exhibit 101: Check Point Software Technologies Ltd. - Overview
- Exhibit 102: Check Point Software Technologies Ltd. - Product / Service
- Exhibit 103: Check Point Software Technologies Ltd. - Key offerings
- 10.4 Cisco Systems Inc.
- Exhibit 104: Cisco Systems Inc. - Overview
- Exhibit 105: Cisco Systems Inc. - Business segments
- Exhibit 106: Cisco Systems Inc. - Key news
- Exhibit 107: Cisco Systems Inc. - Key offerings
- Exhibit 108: Cisco Systems Inc. - Segment focus
- 10.5 F Secure Corp.
- Exhibit 109: F Secure Corp. - Overview
- Exhibit 110: F Secure Corp. - Product / Service
- Exhibit 111: F Secure Corp. - Key offerings
- 10.6 Fortinet Inc.
- Exhibit 112: Fortinet Inc. - Overview
- Exhibit 113: Fortinet Inc. - Product / Service
- Exhibit 114: Fortinet Inc. - Key offerings
- 10.7 International Business Machines Corp.
- Exhibit 115: International Business Machines Corp. - Overview
- Exhibit 116: International Business Machines Corp. - Business segments
- Exhibit 117: International Business Machines Corp. - Key offerings
- Exhibit 118: International Business Machines Corp. - Segment focus
- 10.8 Juniper Networks Inc.
- Exhibit 119: Juniper Networks Inc. - Overview
- Exhibit 120: Juniper Networks Inc. - Product / Service
- Exhibit 121: Juniper Networks Inc. - Key offerings
- 10.9 NortonLifeLock Inc.
- Exhibit 122: NortonLifeLock Inc. - Overview
- Exhibit 123: NortonLifeLock Inc. - Product / Service
- Exhibit 124: NortonLifeLock Inc. - Key offerings
- 10.10 Palo Alto Networks Inc.
- Exhibit 125: Palo Alto Networks Inc. - Overview
- Exhibit 126: Palo Alto Networks Inc. - Key news
- Exhibit 127: Palo Alto Networks Inc. - Key offerings
- 10.11 Trellix
- Exhibit 128: Trellix - Overview
- Exhibit 129: Trellix - Product / Service
- Exhibit 130: Trellix - Key offerings
- 10.12 Trend Micro Inc.
- Exhibit 131: Trend Micro Inc. - Overview
- Exhibit 132: Trend Micro Inc. - Product / Service
- Exhibit 133: Trend Micro Inc. - Key offerings
11 Appendix
- 11.1 Scope of the report
- 11.2 Inclusions and exclusions checklist
- Exhibit 134: Inclusions checklist
- Exhibit 135: Exclusions checklist
- 11.3 Currency conversion rates for US$
- Exhibit 136: Currency conversion rates for US$
- 11.4 Research methodology
- Exhibit 137: Research methodology
- Exhibit 138: Validation techniques employed for market sizing
- Exhibit 139: Information sources
- 11.5 List of abbreviations
- Exhibit 140: List of abbreviations
About Us
Technavio is a leading global technology research and advisory company. Their research and analysis focuses on emerging market trends and provides actionable insights to help businesses identify market opportunities and develop effective strategies to optimize their market positions. With over 500 specialized analysts, Technavio's report library consists of more than 17,000 reports and counting, covering 800 technologies, spanning across 50 countries. Their client base consists of enterprises of all sizes, including more than 100 Fortune 500 companies. This growing client base relies on Technavio's comprehensive coverage, extensive research, and actionable market insights to identify opportunities in existing and potential markets and assess their competitive positions within changing market scenarios.
Contact
Technavio Research
Jesse Maida
Media & Marketing Executive
US: +1 844 364 1100
UK: +44 203 893 3200
Email: [email protected]
Website: www.technavio.com/
SOURCE Technavio


Share this article