AAON Reports Record Second Quarter 2026 Results Driven by Strong Demand, Accelerating Throughput, and Improved Operating Execution
Net sales increased 101%, Operating income increased 192%, Diluted EPS increased 258%
Raises Full-Year Outlook
Second Quarter 2026 Highlights
(All comparisons are year-over-year, unless otherwise noted)
- Delivered record quarterly net sales and significant earnings growth as expanded capacity and improved execution accelerated backlog conversion
- Net sales increased 101.2% to a record $627.0 million
- Gross profit increased 84.3% to $152.5 million
- Operating income increased 192.1% to 68.9 million, reflecting strong net sales growth, improved overhead leverage, and disciplined SG&A management
- GAAP diluted EPS increased 257.9% to $0.68, Non-GAAP adjusted EPS increased 213.6% to $0.69
- Total backlog increased 98.0% year-over-year to $2.0 billion, remaining nearly double the prior-year level despite record quarterly net sales and significantly higher production rates
- Year-to-date, operating cash flow improved to $55.0 million, compared with negative $31.0 million a year ago
Raises 2026 Outlook
- 2026 outlook now reflects net sales growth of 55%-60%, gross margins of approximately 25-26%, and SG&A as a percent of sales of 13%-14%, supported by strong backlog, expanded capacity, and improving operational execution
TULSA, Okla., Aug. 10, 2026 /PRNewswire/ -- AAON, INC. (NASDAQ-AAON), a leader in high-performing, energy-efficient HVAC solutions that bring long-term value to customers and owners, today announced its results for the second quarter of 2026.
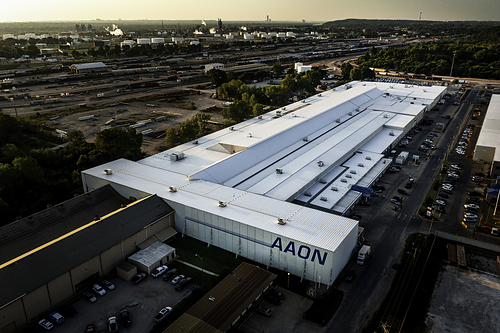
"Our second quarter results demonstrate the continued strength of demand for our solutions and the progress we are making scaling the company to meet that demand," said Matt Tobolski, President and CEO of AAON. "Net sales increased 101.2% to a fourth consecutive quarterly record, operating income increased 192.1%, and diluted EPS increased 257.9%, reflecting the power of higher throughput, strong backlog conversion, and continued execution across the business.
"The investments we have made in capacity, leadership, supply chain, and manufacturing infrastructure are translating into measurable operating progress. Production increased across the enterprise, lead times are improving in key areas, and we are converting backlog at a much faster pace while continuing to see strong customer engagement. This is clear evidence that the operating foundation we have been building is working.
"The long-term market opportunity remains compelling across both brands. The BASX brand continues to benefit from significant data center investment activity, a healthy customer pipeline, and strong engagement with strategic customers. The AAON brand continues to gain share despite a softer commercial HVAC market. Both businesses are well positioned, supported by differentiated products, highly engineered solutions, and strong customer relationships.
"We are also clear-eyed about the margin work ahead. The pace of growth and capacity ramp is creating near-term margin pressure, but the drivers are known, the actions are underway, and the path to improvement is clear: higher utilization, productivity improvements, sourcing initiatives, pricing actions, and a more favorable backlog profile. We are not simply growing revenue. We are building a stronger operating company with the scale, systems, and discipline to deliver improved margins, stronger cash generation, and durable earnings power over time."
Second Quarter 2026 Results
Net sales for the second quarter of 2026 increased 101.2% to a record $627.0 million, compared with $311.6 million in the second quarter of 2025. Growth reflected strong demand across both the AAON and BASX brands, improved manufacturing throughput, and increased utilization of recently added production capacity.
BASX-branded sales grew 216.2% to a record $345 million, reflecting momentum in data center demand, higher production output, and greater utilization of recently added manufacturing capacity. AAON-branded sales also increased to a record level, growing 39.3% to $282.2 million, benefitting by a healthy backlog and continued progress in production throughput. Booking activity remained solid across both brands, contributing to market share gains and elevated backlog levels. BASX-branded products ended the quarter with backlog up 185.4%, while AAON‑branded backlog increased 9.4% from the prior-year period.
Gross profit increased 84.3% to $152.5 million, compared with $82.7 million in the second quarter of 2025. Gross profit margin was 24.3%, compared with 26.6% in the prior-year period. Results reflected the impact of ramping recently added manufacturing capacity, including the Memphis facility, the use of outsourced components to support accelerated growth, and inflationary cost pressures. These investments and actions supported substantially higher production levels and improved customer delivery performance during the quarter.
These costs are being addressed through a combination of pricing, sourcing, productivity, and operational initiatives. Management expects margin performance to improve as production volumes increase, recently added capacity utilization increases, and backlog with improved pricing converts to revenue.
Selling, general and administrative expenses as a percent of sales declined 570 basis points to 13.3%, reflecting continued operating leverage and disciplined cost management as revenue growth outpaced overhead investments.
Operating income increased 192.1% to $68.9 million, compared with $23.6 million in the prior-year period. Diluted earnings per share were $0.68, an increase of 257.9% from $0.19 in the second quarter of 2025. Adjusted non-GAAP EPS increased 213.6% to $0.69, which includes a $1.4 million infrequent expense related to an incentive fee associated with our Memphis, Tenn. facility, net of the profit sharing and tax effect.
Backlog
June 30, 2026 | March 31, 2026 | June 30, 2025 | |||
(in thousands) | |||||
AAON-branded products | $ 540,465 | $ 509,806 | $ 494,214 | ||
BASX-branded products | 1,430,379 | 1,619,649 | 501,106 | ||
$ 1,970,844 | $ 2,129,455 | $ 995,320 | |||
Total backlog increased 98.0% year-over-year to $2.0 billion, compared to $995.3 million the prior year. Backlog remained nearly double the prior-year level even as the Company converted backlog into record quarterly revenue at significantly higher production rates. BASX-branded backlog increased 185.4% year-over-year, reflecting continued customer investment activity in data center infrastructure and the value customers place on BASX's custom-engineered solutions. AAON-branded backlog increased 9.4% year-over-year, supported by strong order activity despite soft end-market conditions.
Compared to the first quarter of 2026, total backlog decreased 7.4%, primarily reflecting accelerated backlog conversion into record revenue and the inherent timing variability of large BASX project awards. We continue to see strong customer engagement and a healthy pipeline of opportunities across the data center market. As is typical with large, highly engineered projects, the timing of customer awards and order conversion can vary from quarter to quarter. We remain encouraged by the volume of opportunities under discussion and our position with key customers. AAON-branded backlog increased 6.0% sequentially, reflecting strong order activity and continued share gains despite a soft commercial HVAC market backdrop.
2026 Outlook
Based on strong backlog, accelerating production throughput, expanded capacity, and current expectations for customer project timing, we are updating our full-year 2026 outlook as follows:
Current | Prior | |
Metric | FY26 | FY26 |
YoY Sales Growth | 55%-60% | 40%-45% |
Gross Profit Margin | 25%-26% | 27%-28% |
SG&A as a % of sales | 13%-14% | 14%-15% |
Depreciation & Amortization | $95M-$100M | $95M-$100M |
"Our updated outlook reflects the strength of our backlog positions, continued customer activity across our end markets, and the significant progress we are making increasing throughput and converting backlog into revenue," said Matt Tobolski. "At the same time, the revised gross margin outlook reflects the near-term cost of scaling rapidly while we bring new capacity to higher utilization and work through price-cost timing.
"The direction is clear. We expect sequential margin improvement in the second half of the year as higher production volumes, better utilization, pricing actions, sourcing initiatives, and continued operational discipline begin to show more clearly in reported results. We remain confident in the long-term earnings power of the business and believe the progress we are making today positions AAON for improved profitability and stronger cash generation as the year progresses."
Segment Results
AAON Oklahoma
Three Months Ended | |||
(in thousands) | June 30, 2026 | March 31, 2026 | June 30, 2025 |
Net sales | $ 262,276 | $ 243,967 | $ 185,120 |
Gross profit | $ 63,617 | $ 64,272 | $ 53,517 |
Gross profit margin | 24.3 % | 26.3 % | 28.9 % |
AAON Oklahoma generated net sales of $262.3 million, an increase of 41.7% from the prior-year period. Growth was driven by stronger execution against a robust backlog, supported by ongoing production improvements that accelerated backlog conversion. Performance also benefited from favorable price realization and a more normalized operating environment relative to the prior year, when the industry refrigerant transition and company-specific operational challenges weighed on results.
Gross profit increased 18.9% to $63.6 million compared with $53.5 million in the prior-year period. Gross margin was 24.3%, compared to 28.9% in the second quarter of 2025. Segment profitability was impacted by $18.1 million of overhead expenses associated with the Memphis facility, compared with $3.0 million in the prior-year period. Excluding these costs, segment margins expanded 70 basis points to 31.2%, compared to 30.5% in the prior-year period.
The year-over-year improvement excluding Memphis overhead reflects higher production rates, improved throughput, and favorable pricing, partially offset by elevated outsourcing levels and inflationary cost pressures. These pressures are being addressed through pricing and operational initiatives and are not expected to change the long-term margin profile of the segment.
AAON Coil Products
Three Months Ended | |||
(in thousands) | June 30, 2026 | March 31, 2026 | June 30, 2025 |
Net sales | $ 146,680 | $ 117,611 | $ 58,465 |
Gross profit | $ 23,538 | $ 28,302 | $ 10,229 |
Gross profit margin | 16.0 % | 24.1 % | 17.5 % |
AAON Coil Products generated net sales of $146.7 million, an increase of 150.9% from the prior-year period. Growth was driven primarily by BASX-branded liquid cooling sales of $126.6 million, up 208.4% during the period.
Gross profit increased 130.1% to $23.5 million, compared with $10.2 million in the prior-year period. Gross margin was 16.0%, compared with 17.5% in the second quarter of 2025. Margin performance reflected inflationary cost pressures, outsourcing-related costs, freight pressure, and price-cost timing within the segment. These pressures were partially offset by improved labor efficiency, better overhead absorption, and higher production volume.
Management has clear visibility into the drivers and is taking action through pricing, sourcing, productivity, and operational discipline. While these actions are not yet fully reflected in the reported results, the Company expects the benefits to build through the second half of the year. Despite the margin pressure, AAON Coil Products delivered strong profit growth supported by higher sales volumes.
BASX
Three Months Ended | |||
(in thousands) | June 30, 2026 | March 31, 2026 | June 30, 2025 |
Net sales | $ 218,020 | $ 135,358 | $ 67,982 |
Gross profit | $ 65,336 | $ 32,391 | $ 18,983 |
Gross profit margin | 30.0 % | 23.9 % | 27.9 % |
BASX segment generated net sales of $218.0 million and increase of 220.7% from the prior-year period. Growth was driven by strong backlog conversion, continued data center investment activity, and increased production capacity enabled by continued ramping of the Company's manufacturing footprint, including Memphis.
Gross profit increased 244.2% to $65.3 million, compared with $19.0 million in the prior-year period. Gross margin was 30.0%, up from 27.9% in the second quarter of 2025. The year-over-year margin improvement reflected substantial volume growth, partially offset by incremental resources and investments required to support future growth, customer delivery, and continued share gains.
Balance Sheet & Cash Flow
As of June 30, 2026, the Company had cash, cash equivalents and restricted cash of $12.7 million and a balance on its revolving credit facility of $435.0 million.
Andy Cheung, CFO and Treasurer, commented, "Our strong earnings performance and disciplined working capital initiatives have driven meaningful improvement in both financial leverage and operating cash flow generation through the first half of 2026. Operating cash flow totaled $55.0 million for the six-month period, a significant improvement compared with a $31.0 million use of cash in the first six months of 2025. As we move through the second half, we remain focused on productivity, margin improvement and working capital efficiency. These actions are expected to support stronger cash flow generation and continued balance sheet improvement over the long term."
Conference Call
The Company will host a conference call and webcast this afternoon at 5:00 p.m. EDT to discuss the second quarter of 2026 results and outlook. The conference call will be accessible via dial-in for those who wish to participate in Q&A as well as a listen-only webcast. The dial-in is accessible at 1-888-880-3330. To access the listen-only webcast, please register at https://app.webinar.net/8K3oQEbJrgq. On the next business day following the call, a replay of the call will be available on the company's website at https://aaon.com/investors.
About AAON
Founded in 1988, AAON is a global leader in HVAC solutions for commercial, industrial and data center indoor environments. The company's industry-leading approach to designing and manufacturing highly configurable and custom-made equipment to meet exact needs creates a premier ownership experience with greater efficiency, performance and long-term value. Its highly engineered equipment is sold under the AAON and BASX brands. AAON is headquartered in Tulsa, Oklahoma, where its world-class innovation center and testing lab allows AAON engineers to continuously push boundaries and advance the industry. For more information, please visit www.aaon.com.
Forward-Looking Statements
This press release includes "forward-looking statements" within the meaning of the Private Securities Litigation Reform Act of 1995. Words such as "expects", "anticipates", "intends", "plans", "believes", "seeks", "estimates", "should", "will", and variations of such words and similar expressions are intended to identify such forward-looking statements. These statements are not guarantees of future performance and involve certain risks, uncertainties and assumptions, which are difficult to predict. Therefore, actual outcomes and results may differ materially from what is expressed or forecasted in such forward-looking statements. Readers are cautioned not to place undue reliance on these forward-looking statements, which speak only as of the date on which they are made. We undertake no obligations to update publicly any forward-looking statements, whether as a result of new information, future events or otherwise. Important factors that could cause results to differ materially from those in the forward-looking statements include (1) the timing and extent of changes in raw material and component prices, (2) the effects of fluctuations in the commercial/industrial new construction market, (3) the timing and extent of changes in interest rates, as well as other competitive factors during the year, and (4) general economic, market or business conditions. For a discussion of such risks and uncertainties, which could cause actual results to differ from those contained in any forward-looking statements, see "Risk Factors" and "Forward Looking Statements" in AAON's Annual Report on Form 10-K for the most recent fiscal year, as may be revised and updated by AAON's Quarterly Reports on Form 10-Q, and AAON's Current Reports on Form 8-K.
Contact Information
Joseph Mondillo
Director of Investor Relations & Corporate Strategy
Phone: (617) 877-6346
Email: joseph.mondillo@aaon.com
AAON, Inc. and Subsidiaries | ||||||||
Consolidated Statements of Income | ||||||||
(Unaudited) | ||||||||
Three Months Ended June 30, | Six Months Ended June 30, | |||||||
2026 | 2025 | 2026 | 2025 | |||||
(in thousands, except per share data) | ||||||||
Net sales | $ 626,976 | $ 311,567 | $ 1,123,912 | $ 633,621 | ||||
Cost of sales | 474,485 | 228,838 | 846,456 | 464,528 | ||||
Gross profit | 152,491 | 82,729 | 277,456 | 169,093 | ||||
Selling, general and administrative expenses | 83,607 | 59,147 | 151,513 | 110,440 | ||||
Gain on disposal of assets | — | — | — | (40) | ||||
Income from operations | 68,884 | 23,582 | 125,943 | 58,693 | ||||
Interest expense | (6,195) | (4,009) | (11,250) | (6,811) | ||||
Other income (expense), net | 158 | (68) | 235 | 106 | ||||
Income before taxes | 62,847 | 19,505 | 114,928 | 51,988 | ||||
Income tax provision | 6,188 | 4,018 | 18,454 | 7,209 | ||||
Net income | $ 56,659 | $ 15,487 | $ 96,474 | $ 44,779 | ||||
Earnings per share: | ||||||||
Basic EPS | $ 0.69 | $ 0.19 | $ 1.17 | $ 0.55 | ||||
Diluted EPS | $ 0.68 | $ 0.19 | $ 1.15 | $ 0.54 | ||||
Cash dividends declared per common share: | $ 0.10 | $ 0.10 | $ 0.20 | $ 0.20 | ||||
Weighted average shares outstanding: | ||||||||
Basic | 82,189,734 | 81,441,511 | 82,213,148 | 81,456,845 | ||||
Diluted | 83,721,199 | 82,956,213 | 83,690,556 | 83,153,788 | ||||
AAON, Inc. and Subsidiaries | |||||||
Segment Net Sales and Profit | |||||||
(Unaudited) | |||||||
Three Months Ended June 30, | Six Months Ended June 30, | ||||||
2026 | 2025 | 2026 | 2025 | ||||
(in thousands) | |||||||
AAON Oklahoma | |||||||
External sales | $ 262,276 | $ 185,120 | $ 506,243 | $ 346,958 | |||
Inter-segment sales | 91,359 | 5,318 | 135,868 | 9,157 | |||
Eliminations | (91,359) | (5,318) | (135,868) | (9,157) | |||
Net sales | 262,276 | 185,120 | 506,243 | 346,958 | |||
Cost of sales1 | 198,659 | 131,603 | 378,354 | 252,841 | |||
Gross profit | 63,617 | 53,517 | 127,889 | 94,117 | |||
AAON Coil Products | |||||||
External sales | $ 146,680 | $ 58,465 | $ 264,291 | $ 152,488 | |||
Inter-segment sales | 7,660 | 3,439 | 14,478 | 7,018 | |||
Eliminations | (7,660) | (3,439) | (14,478) | (7,018) | |||
Net sales | 146,680 | 58,465 | 264,291 | 152,488 | |||
Cost of sales1 | 123,142 | 48,236 | 212,451 | 112,401 | |||
Gross profit | 23,538 | 10,229 | 51,840 | 40,087 | |||
BASX | |||||||
External sales | $ 218,020 | $ 67,982 | $ 353,378 | $ 134,175 | |||
Inter-segment sales | 558 | 507 | 556 | 550 | |||
Eliminations | (558) | (507) | (556) | (550) | |||
Net sales | 218,020 | 67,982 | 353,378 | 134,175 | |||
Cost of sales1 | 152,684 | 48,999 | 255,651 | 99,286 | |||
Gross profit | 65,336 | 18,983 | 97,727 | 34,889 | |||
Consolidated gross profit | $ 152,491 | $ 82,729 | $ 277,456 | $ 169,093 | |||
1 | Presented after intercompany eliminations. |
The reconciliation between consolidated gross profit to consolidated income from operations is as follows: | |||||||
Consolidated gross profit | $ 152,491 | $ 82,729 | $ 277,456 | $ 169,093 | |||
Less: Selling, general and administrative expenses | 83,607 | 59,147 | 151,513 | 110,440 | |||
Add: loss on disposal of assets | — | — | — | 40 | |||
Consolidated income from operations | $ 68,884 | $ 23,582 | $ 125,943 | $ 58,693 | |||
AAON, Inc. and Subsidiaries | |||
Consolidated Balance Sheets | |||
(Unaudited) | |||
June 30, 2026 | December 31, 2025 | ||
Assets | (in thousands, except share and per share data) | ||
Current assets: | |||
Cash and cash equivalents | $ 13 | $ 13 | |
Restricted cash | 12,714 | 1,226 | |
Accounts receivable, net | 360,763 | 314,387 | |
Income tax receivable | 19,212 | 27,445 | |
Inventories, net | 331,328 | 261,151 | |
Contract assets, net | 258,873 | 247,037 | |
Prepaid expenses and other | 12,117 | 17,921 | |
Total current assets | 995,020 | 869,180 | |
Property, plant and equipment, net | 682,779 | 631,262 | |
Intangible assets, net and goodwill | 167,893 | 165,799 | |
Right of use assets | 16,190 | 17,988 | |
Other long-term assets | 1,801 | 2,281 | |
Total assets | $ 1,863,683 | $ 1,686,510 | |
Liabilities and Stockholders' Equity | |||
Current liabilities: | |||
Short-term obligations of NMTC1 | 7,535 | 7,535 | |
Accounts payable | 171,717 | 110,437 | |
Accrued liabilities | 138,267 | 132,213 | |
Contract liabilities | 12,752 | 80,670 | |
Total current liabilities | 330,271 | 330,855 | |
Debt, long-term | 435,000 | 398,320 | |
Deferred tax liabilities | 38,136 | 30,313 | |
Other long-term liabilities | 28,529 | 23,299 | |
New markets tax credit obligations1 | 21,331 | 8,738 | |
Commitments and contingencies (Note 19) | |||
Stockholders' equity: | |||
Preferred stock, $.001 par value, 5,000,000 shares authorized, no shares issued | — | — | |
Common stock, $.004 par value, 200,000,000 shares authorized, 82,448,037 and 81,691,075 issued and outstanding at June 30, 2026 and December 31, 2025, respectively | 330 | 327 | |
Additional paid-in capital | 99,689 | 64,358 | |
Retained earnings | 910,397 | 830,300 | |
Total stockholders' equity | 1,010,416 | 894,985 | |
Total liabilities and stockholders' equity | $ 1,863,683 | $ 1,686,510 | |
1 | Held by variable interest entities |
AAON, Inc. and Subsidiaries | |||
Consolidated Statements of Cash Flows | |||
(Unaudited) | |||
Six Months Ended June 30, | |||
2026 | 2025 | ||
Operating Activities | (in thousands) | ||
Net income | $ 96,474 | $ 44,779 | |
Adjustments to reconcile net income to net cash provided by (used in) operating activities | |||
Depreciation and amortization | 44,716 | 38,879 | |
Amortization of debt issuance costs | 84 | 128 | |
Amortization of right of use assets | 91 | 69 | |
(Recoveries of) Provision for losses on accounts receivable, net of adjustments | (62) | 270 | |
Provision for losses on contract assets, net of adjustments | — | 200 | |
Provision for excess and obsolete inventories, net of write-offs | 1,225 | 288 | |
Share-based compensation | 10,702 | 8,795 | |
Other | — | (71) | |
Deferred income taxes | 7,823 | (2,423) | |
Changes in assets and liabilities: | |||
Accounts receivable | (46,314) | (23,409) | |
Income tax receivable | 8,233 | (3,187) | |
Inventories | (71,402) | (47,848) | |
Contract assets | (11,836) | (97,963) | |
Prepaid expenses and other long-term assets | 6,284 | (68) | |
Accounts payable | 63,877 | 36,397 | |
Contract liabilities | (67,918) | 18,839 | |
Extended warranties | 7,075 | (148) | |
Accrued liabilities and other long-term liabilities | 5,916 | (4,567) | |
Net cash provided by (used in) operating activities | 54,968 | (31,040) | |
Investing Activities | |||
Capital expenditures | (97,282) | (82,515) | |
Grant proceeds received | 1,650 | — | |
Proceeds from sale of property, plant and equipment | — | 40 | |
Acquisition of intangible assets | (5,292) | (7,042) | |
Principal payments from note receivable | — | 25 | |
Net cash used in investing activities | (100,924) | (89,492) | |
Financing Activities | |||
Borrowings of debt | 597,485 | 415,126 | |
Payments of debt | (560,805) | (252,982) | |
Proceeds from financing obligation, net of issuance costs | 12,908 | — | |
Payment related to financing costs | (399) | (1,395) | |
Stock options exercised | 29,100 | 10,025 | |
Repurchase of stock - open market | — | (29,992) | |
Repurchases of stock - LTIP plans (Note 17) | (4,468) | (9,167) | |
Cash dividends paid to stockholders | (16,377) | (16,276) | |
Net cash provided by financing activities | 57,444 | 115,339 | |
Net increase (decrease) in cash, cash equivalents, and restricted cash | 11,488 | (5,193) | |
Cash, cash equivalents, and restricted cash, beginning of period | 1,239 | 6,514 | |
Cash, cash equivalents, and restricted cash, end of period | $ 12,727 | $ 1,321 | |
Use of Non-GAAP Financial Measures
To supplement the Company's consolidated financial statements presented in accordance with generally accepted accounting principles ("GAAP"), additional non-GAAP financial measures are provided and reconciled in the following tables. The Company believes that these non-GAAP financial measures, when considered together with the GAAP financial measures, provide information that is useful to investors in understanding period-over-period operating results. The Company believes that this non-GAAP financial measure enhances the ability of investors to analyze the Company's business trends and operating performance as they are used by management to better understand operating performance. Since adjusted net income, adjusted net income per diluted share, EBITDA, adjusted EBITDA, and adjusted EBITDA margin are non-GAAP measures and are susceptible to varying calculations, adjusted net income, adjusted net income per diluted share, EBITDA, adjusted EBITDA, and adjusted EBITDA margin, as presented, may not be directly comparable with other similarly titled measures used by other companies.
Non-GAAP Adjusted Net Income
The Company defines non-GAAP adjusted net income as net income adjusted for any infrequent events, such as litigation settlements, net of profit sharing and tax effect, in the periods presented.
The following table provides a reconciliation of net income (GAAP) to non-GAAP adjusted net income for the periods indicated:
Three Months Ended June 30, | Six Months Ended June 30, | ||||||
2026 | 2025 | 2026 | 2025 | ||||
(in thousands) | |||||||
Net income, a GAAP measure | $ 56,659 | $ 15,487 | $ 96,474 | $ 44,779 | |||
Add: Memphis incentive fee1 | 1,448 | 3,405 | 1,448 | 6,105 | |||
Profit sharing effect2 | (123) | (289) | (123) | (519) | |||
Tax effect | (332) | (742) | (332) | (1,369) | |||
Non-GAAP adjusted net income | $ 57,652 | $ 17,861 | $ 97,467 | $ 48,996 | |||
Non-GAAP adjusted earnings per diluted share | $ 0.69 | $ 0.21 | $ 1.16 | $ 0.59 | |||
1 | The incentive fee relates to fees payable to our real estate broker associated with the acquisition of our Memphis, Tenn. plant for a percentage of the incentives awarded to us by various entities. |
2 | Profit sharing effect of the Memphis incentive fee in the respective period. |
EBITDA
EBITDA (as defined below) is presented herein and reconciled from the GAAP measure of net income because of its wide acceptance by the investment community as a financial indicator of a company's ability to internally fund operations. The Company defines EBITDA as net income, plus (1) depreciation and amortization, (2) interest expense (income), net and (3) income tax expense. EBITDA is not a measure of net income or cash flows as determined by GAAP. EBITDA margin is defined as EBITDA as a percentage of net sales.
The Company's EBITDA measure provides additional information which may be used to better understand the Company's operations. EBITDA is one of several metrics that the Company uses as a supplemental financial measurement in the evaluation of its business and should not be considered as an alternative to, or more meaningful than, net income, as an indicator of operating performance. Certain items excluded from EBITDA are significant components in understanding and assessing a Company's financial performance. EBITDA, as used by the Company, may not be comparable to similarly titled measures reported by other companies. The Company believes that EBITDA is a widely followed measure of operating performance and is one of many metrics used by the Company's management team and by other users of the Company's consolidated financial statements.
Adjusted EBITDA is calculated as EBITDA adjusted by items in non-GAAP adjusted net income, above, except for taxes, as taxes are already excluded from EBITDA.
The following table provides a reconciliation of net income (GAAP) to EBITDA (non-GAAP) and Adjusted EBITDA (non-GAAP) for the periods indicated:
Three Months Ended June 30, | Six Months Ended June 30, | ||||||
2026 | 2025 | 2026 | 2025 | ||||
(in thousands) | |||||||
Net income, a GAAP measure | $ 56,659 | $ 15,487 | $ 96,474 | $ 44,779 | |||
Depreciation and amortization | 23,813 | 19,936 | 44,716 | 38,879 | |||
Interest expense, net | 6,195 | 4,009 | 11,250 | 6,811 | |||
Income tax expense | 6,188 | 4,018 | 18,454 | 7,209 | |||
EBITDA, a non-GAAP measure | $ 92,855 | $ 43,450 | $ 170,894 | $ 97,678 | |||
Add: Memphis incentive fee1 | 1,448 | 3,405 | 1,448 | 6,105 | |||
Profit sharing effect2 | (123) | (289) | (123) | (519) | |||
Adjusted EBITDA, a non-GAAP measure | $ 94,180 | $ 46,566 | $ 172,219 | $ 103,264 | |||
Adjusted EBITDA margin | 15.0 % | 14.9 % | 15.3 % | 16.3 % | |||
1 | The incentive fee relates to fees payable to our real estate broker associated with the acquisition of our Memphis, Tenn. plant for a percentage of the incentives awarded to us by various entities. |
2 | Profit sharing effect of the Memphis incentive fee in the respective period. |
Non-GAAP Adjusted Selling, General and Administrative Expenses
The following table provides a reconciliation of selling, general and administrative expenses (GAAP) to adjusted selling, general and administrative expenses (non-GAAP) for the periods indicated:
Three Months Ended June 30, | Six Months Ended June 30, | ||||||
2026 | 2025 | 2026 | 2025 | ||||
Non-GAAP Adjusted Selling, General and Administrative Expenses | |||||||
SG&A, a GAAP measure | $ 83,607 | $ 59,147 | $ 151,513 | $ 110,440 | |||
Memphis incentive fee | (1,448) | (3,405) | (1,448) | (6,105) | |||
Profit sharing effect | 123 | 289 | 123 | 519 | |||
Non-GAAP adjusted SG&A expenses | 82,282 | 56,031 | 150,188 | 104,854 | |||
As a percent of sales | 13.1 % | 18.0 % | 13.4 % | 16.5 % | |||
Non-GAAP Adjusted AAON Oklahoma Gross Profit
The following table provides a reconciliation of AAON Oklahoma gross profit (GAAP) to adjusted gross profit (non-GAAP) for the periods indicated:
Three Months Ended June 30, | Six Months Ended June 30, | ||||||
2026 | 2025 | 2026 | 2025 | ||||
Non-GAAP Adjusted AAON Oklahoma Gross profit | |||||||
AAON Oklahoma Net sales | $ 262,276 | $ 185,120 | $ 506,243 | $ 346,958 | |||
AAON Oklahoma Gross profit | $ 63,617 | $ 53,517 | $ 127,889 | $ 94,117 | |||
Memphis facility overhead costs | 18,122 | 3,000 | 27,967 | 5,300 | |||
Adjusted AAON Oklahoma Gross profit | $ 81,739 | $ 56,517 | $ 155,856 | $ 99,417 | |||
Adjusted AAON Oklahoma Gross profit margin | 31.2 % | 30.5 % | 30.8 % | 28.7 % | |||
SOURCE AAON





Share this article