Clean Air Metals Announces a PEA of the Current and Escape PGE-Cu-Ni Deposits of the Thunder Bay North Project, with post-tax NPV5 of C$378m, IRR 29.8%
THUNDER BAY, ON, Dec. 1, 2021 /PRNewswire/ - Clean Air Metals Inc. ("Clean Air Metals" or the "Company") (TSXV: AIR) (FRA: CKU) (OTCQB: CLRMF) is pleased to announce results from an independent Preliminary Economic Assessment (PEA) that was completed for its Thunder Bay North Platinum Group Element (PGE) - Copper (Cu) – Nickel (Ni) Project ("Thunder Bay North" or the "Project") near Thunder Bay, Ontario, Canada. The PEA was prepared by Nordmin Engineering Ltd. ("Nordmin") of Thunder Bay, Ontario, and includes a new stand-alone milling complex and waste storage facility (WSF) with mill feed from both the Current deposit and the Escape deposit, part of the Thunder Bay North Project Mineral Resource Estimate as amended, that was completed by Nordmin (see press release dated January 20, 2021). All amounts are in CAD dollars, unless otherwise stated. Summary results of the PEA are shown below in Table 1.




The PEA was independently prepared by Mr. Glen Kuntz, P.Geo., Mr. Kurt Boyko, P.Eng. and Mr. Brian Wissent, P.Eng. of Nordmin, Mr. Lyn Jones, P.Eng. of Blue Coast Research, Mr. Wilson Muir, P.Eng. of Knight Piésold Ltd., Mr. Kris Tuuttila P.Geo. (Limited) of DST Consulting, and Dr. Geoff Heggie, Exploration Manager of Clean Air Metals, who are considered "Qualified Persons" under National Instrument 43-101 Standards of Disclosure for Mineral Projects. The technical disclosure in this news release is based upon the information in the PEA prepared by or under the supervision of Mr. Kuntz, Mr. Boyko, Mr. Wissent, Mr. Jones, Mr. Muir, Mr. Tuuttila, and Dr. Heggie.
Project Metrics (Table 1)
- The Project has a pre-tax net present value (NPV) of $425.0 million, and after-tax NPV of $378.4 million, at a 5% discount rate.
- The pre-tax internal rate of return (IRR) is 31.1%, and the after-tax IRR is 29.8%.
- The capital payback is 2.4 years from start of production.
- Revenue's average $239.8 million per year from sale of PGE and Copper mineral concentrates.
- Total mined metal production over a 10-year mine life based on the present resource base is expected to be 629 k oz Platinum, 618 k oz Palladium, 111 M pounds Copper, 57 M pounds Nickel, 38 k oz Gold, 850 k oz Silver, or 2,886 k oz PtEq1.
- 65.2% of total mineral production occurs in the first 5 years.
- Operating margin of 59% in the first 5 years and Life-of-Mine Operating margin of 53%.
- The Project is located in close proximity to key infrastructure near the City of Thunder Bay, Canada.
- Base case economics were calculated using a 2-yr trailing average price deck (Table 2)
___________ | |
1 | Equivalency formula can be viewed in the following Link (Click Here) |
PEA Key Metrics
Table 1: Key Financial and Project Metrics
Project Metric | Units | Value |
Pre-tax NPV @ 5% | $M | $425.04 |
After-tax NPV @ 5% | $M | $378.38 |
Pre-tax IRR @ 5% | % (real) | 31.1 |
After-tax IRR @ 5% | % (real) | 29.8 |
Payback Period from start of production | Years | 2.4 |
Initial Capital Expenditure ("Capex") | $M | $367.17 |
Initial EPCM / Indirects (incl. in Capex) | $M | $41.16 |
Initial Contingency (incl. in Capex) | $M | $60.20 |
Maximum Production Rate | Mtpa | 1.3 |
Mine Life | Years | 10 |
Ramp-up Years | Years | 1 |
Long-hole Open Stoping Mill Feed | kt | 10,338 |
Drift and Fill Mill Feed | kt | 1,946 |
Total Mill Feed | kt | 12,284 |
Life of Mine Mill Feed Grade | EqPt (g/t) | 7.3 |
Total Revenue | $M | $2,245 |
Total Operating Costs | $M | $1,057 |
Pre-tax Operating Cashflow | $M | $1,188 |
Total Capital | $M | $536 |
Net Smelter Return (NSR) | $/tonne mill feed | $178.02 |
Operating Margin | % | 53% |
Operating Costs | ||
Underground Mine Operating Costs | $/t mill feed | $47.37 |
Processing Plant / WSF | $/t mill feed | $25.03 |
General and Administration (G&A) Costs | $/t mill feed | $6.87 |
Royalties | $/t mill feed | $2.63 |
Transportation to Smelter | $/t mill feed | $4.71 |
Total Unit Operating Costs | $/t mill feed | $86.61 |
Notes: PtEq Grade = Total Metal Value in 1 Tonne ÷ Pt Price per Oz × 31.10348 g per oz and | ||
The Company has not made a production decision at the Thunder Bay North Project and there is no guarantee that a production decision will be made or that the production rates at the Thunder Bay North Project will be achieved. There are no Mineral Reserves for the Thunder Bay North Project currently. The information reported in the PEA for the Project is preliminary in nature and includes Inferred Mineral Resources that are considered too speculative geologically to have economic considerations applied to them that would enable them to be categorized as Mineral Reserves. Inferred Mineral Resources are based on limited geological evidence and sampling. The tonnage and grade of Inferred Mineral Resources have significant uncertainty as to their existence and as to whether they can be mined economically. There is no certainty that results for the PEA for the Project will be finally realized.
Executive Remarks
Executive Chair Jim Gallagher, P.Eng. stated: "The initial PEA for the Thunder Bay North Project brings together two previously independent deposits into one mining plan which is relatively low risk, low capital, quick to production and generates robust financial metrics. Given the significant potential upside with continued exploration drilling along the known conduits and with the already identified massive sulphide targets we believe that this PEA is a minimum base case that Clean Air Metals will continue to attempt to de-risk towards prefeasibility."
CEO Abraham Drost, P.Geo., stated that "the PEA sets a mine plan that allows the Company to move forward with several de-risking objectives. These include:
- converting mine plan-impacted unpatented mining claims to mining leases;
- engaging with regulators toward early commencement of the mine permitting process;
- continuation of the environmental impact studies (EIS) led by Englobe/DST Engineering;
- commencement of prefeasibility technical studies including optimization and tradeoffs around mining, metallurgy and mill design; and
- negotiation of Impact and Benefit agreements with affected First Nations and Métis."
Significant Production Potential
- The study considers a 1.3 Mtpa (million tonnes per year) 3,600 tpd mill throughput ramp-access underground mining operation with over a 10 year mine (project) life plus 2 years of construction. Early revenue is generated by mining near surface production areas and prioritizing high grade near surface material from the high head grades from the Lower Current and Bridge Zones grading 9.4 g/t PtEq insitu for first 4 years of production.
- Operating costs average $86.61 per tonne mined with an NSR of $178.02 per tonne over a 10-year life of mine (LOM).
Development Capital
- Initial capital expenditures (CAPEX) are $367.17 million (includes EPCM of $41 million and contingency of $60 million) and ongoing capex for the life of the project is $169 million.
Table 2: 2-Year Trailing Price Deck
Metal | Unit | 2 Year Trailing |
Platinum | US$/oz | 969 |
Palladium | US$/oz | 2,214 |
Gold | US$/oz | 1,723 |
Silver | US$/oz | 22 |
Copper | US$/lb | 3.09 |
Nickel | US$/lb | 6.86 |
Note: 2yr price deck provided by CRU as of Aug, 2021. | ||
Clean Air Metals will be hosting a webcast on Thursday, December 2, 2021, at 11:00 am (Eastern Time). Abraham Drost, Chief Executive Officer, and Jim Gallagher, Executive Chair will provide an in-depth review of the Company's PEA and will be available to answer shareholder questions. Copies of the news release and management's presentation will be available on the Company's website at www.cleanairmetals.ca.
Pre-registration will be open Wednesday, December 1, 2021 and the webcast can be accessed by clicking HERE or at the following URL:
A Chrome or Firefox browser is recommended. Please test your connection prior to joining the webcast at https://onlinexperiences.com/Launch/StudioTest.htm
Mine Operations
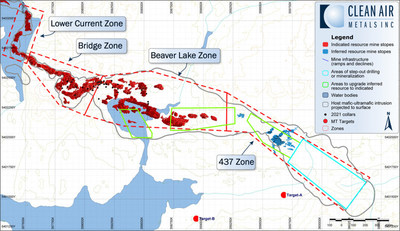
The proposed Thunder Bay North operation involves underground mining at an average rate of 4450 tonnes per day (tpd) (3600 tpd in ore and 850 tpd in waste) with an accompanying process plant with a matching 3,600 tpd capacity. Shown in Figure 1 is the proposed site plan with the mineable Current and Escape deposits.
The Current deposit is accessed via a portal from surface and has a 12-month pre-production development period, which allows for the Current deposit main decline system to connect to the Current main fresh air raise and provide secondary egress for the mine. Contractor decline development is assumed for the 12-month pre-production period as well as the following 2 years.
The Escape deposit is accessed via a separate portal from surface. The main decline development begins 12 months after the Current deposit decline begins and continues for 3 years, until the decline connects with the Escape main fresh air raise. Contractor decline development is assumed for the Escape deposit.
The Current deposit pre-production development period is followed by a production ramp-up period and achieves full production (3,600 tpd) in the first quarter of year 1. The Current deposit production commences in the Current and Bridge mining zones and continues in these areas for the first 3 years. In year 4, the Escape deposit begins production in the High Grade Zone (HGZ) at 1,800 tpd and the Current deposit production rate is reduced to 1,800 tpd. Figures 2 and 3 show long sections of the proposed Current deposit and Escape deposit.
The underground production was scheduled based on 3,600 tpd mill feed and 850 tpd waste, excavated using a fleet of 10-tonne load-haul-dump loaders (LHD), and hauled with 40-tonne trucks, using the Current and Escape declines to haul material to surface.
The underground mining inventory was determined using Deswik's Mineable Shape Optimizer (MSO) software tool. The MSO uses the geological block model to generate shapes (e.g., stopes) based on economic and geometric parameters as listed in Table 3. The mining underground inventory is a combination of the four mining areas (Current, Bridge, Beaver-Cloud, and 437) within the Current deposit and the two mining areas (HGZ and Boundary) within the Escape deposit. The underground inventory spans along a strike length of 3.3 km and to a depth of 700 m within the Current deposit and spans along a strike length of 1 km and to a depth of 500 m within the Escape deposit. The underground stope inventory is constrained by a crown pillar, extending 30 m below the unconsolidated sediments below Current Lake.
The Current and Escape deposits will be mined via a combination of conventional underground long-hole open stope and drift & fill mining methods, backfilled with a combination of cemented paste back fill (CPB), cemented rock fill (CRF) and unconsolidated rock fill (URF). Stopes are designed to be accessed and excavated via overcut and undercut development cross-cut drifts, which connect to the main declines. The main declines provide ventilation, haulage to surface, and mine access. Table 3 shows the underground design parameters and Table 4 shows the underground MSO cutoff.
Table 3: Underground Design Parameters
Parameter | Value |
Long-hole Open Stoping Size | |
Length (Maximum) | 20 m |
Height (Maximum) | 25 m |
Width (Range) | 5 m to 15 m |
Drift and Fill Stoping Dimensions | |
Height | 5 m |
Width | 5 m |
Development Drift Dimensions | |
Ramp | 5 m (height) x 5 m (width) |
Cross-cut | 4.5 m (height) x 5 m (width) |
Mining Dilution & Recovery | |
Underground (UG) Mining Dilution | 9.6% |
UG Mining Recovery | 95% |
Resources Used for MSO and UG Design | Measured + Indicated + Inferred |
Table 4: Underground MSO Cutoff
Parameter | Unit | Current | Bridge | Beaver | Boundary | HGZ |
Direct Mining Cost (LHOS) | $/t mill feed | $34.7 | $28.5 | $30.8 | $32.0 | $34.5 |
Direct Mining Cost (DAF) | $/t mill feed | $44.0 | $43.8 | $46.5 | $47.7 | $52.9 |
Milling / WSF Cost | $/t mill feed | $23.0 | $23.0 | $23.0 | $23.0 | $23.0 |
Indirect / G&A Cost | $/t mill feed | $10.0 | $10.0 | $10.0 | $10.0 | $10.0 |
NSR Cutoff (LHOS) | $/t mill feed | $67.7 | $61.5 | $63.8 | $65.0 | $67.5 |
NSR Cutoff (DAF) | $/t mill feed | $77.0 | $76.8 | $79.5 | $80.7 | $85.9 |
Note: NSR calculation includes mining dilution and recovery, milling recoveries, smelter payables and | ||||||
Mineralogy
Copper is contained primarily as chalcopyrite and approximately two-thirds of the nickel is in sulphide form, primarily as pentlandite. The remaining nickel is mostly hosted by magnesium-silicate minerals, chiefly serpentine and olivine. The platinum, palladium, and gold mineralization is very fine grained, however they are closely associated with all sulphide minerals, including pyrite and pyrrhotite, and recovery of the sulphides will therefore bring along the majority of the precious metal values. Gangue silicates consist of serpentine, amphibole, chlorite, mica and feldspar. Copper and nickel sulphide material liberation indicate a moderately fine grind is required for good recovery of the sulphides.
Metallurgical Test Work
A flotation development program was completed on one master composite and ten variability composites from the Current deposit and three variability composites from the Escape deposit. Flowsheet options considered include separate copper and nickel concentrates, separate copper and bulk concentrates, and a single bulk concentrate. A flowsheet was developed, consisting of primary grinding to a P80 (80% passing) of 65 microns, sequential flotation of copper bearing minerals, followed by nickel or bulk flotation. Regrinding of the copper rougher concentrate to a P80 of ~25 microns followed by two stages of cleaning achieved concentrate grades of ~25% copper. Nickel concentrate grades up to 11% nickel were achieved with fine regrinding to a P80 < 20 microns, but resulted in low nickel and PGE recoveries to a selective nickel concentrate. Replacing the nickel concentrate with a bulk concentrate eliminates the Ni regrind and improves overall metal recovery. Platinum, palladium and gold recovery is closely linked with sulphur recovery. High recoveries of the precious metals are possible if all the sulphides are floated, however the rejection of any of the sulphide minerals leads to an attendant drop in PGE and gold recovery. Table 5 shows the consolidated concentrate average milling recovery for each payable metal.
Table 5: Consolidated Average Milling Recovery
Payable Metal | Consolidated |
Platinum | 82% |
Palladium | 86% |
Gold | 80% |
Silver | 68% |
Copper | 95% |
Nickel | 51% |
Mineral Processing
The conceptional process plant has been designed as a conventional milling operation with a capacity of 3,600 tpd.
Run of mine (ROM) mineralized material will be reduced to P80 of 300 mm by a single jaw crusher. Crusher discharge would be transferred to a surface stockpile, from which material would be reclaimed by two active apron feeders. A front-end loader would be utilized on occasion to minimize size segregation and to motivate the pile during the winter period.
A conventional semi-autogenous grinding (SAG) and ball mill grinding circuit is proposed. The conceptual design targets a grind size P80 of 65μm, utilizing a SAG size of 6.7 m diameter by 2.8 m (EGL) long and a ball mill size of 4.5 m by 7m (EGL) long. The SAG mill is closed-in with a pebble circuit where pebbles are crushed prior to being recycled to the SAG feed. The ball mill will be closed-in with hydrocyclones, with cyclone overflow reporting to the copper rougher circuit. Figure 4 shows the conceptual process plant flow diagram.
The flotation circuit will produce two separate marketable concentrates. A copper-PGE concentrate will be the primary float, utilizing a regrind stage of the rougher float product prior to two subsequent stages of cleaning. Cu-PGE concentrate will be thickened and dewatered via a filter press prior to being stored in a covered stockpile prior to shipment.
Copper rougher tails will be pumped to a bulk concentrate flotation circuit which consists of rougher stage, and four subsequent cleaning stages. The bulk concentrate product will be thickened and dewatered via a filter press prior to being stored in a covered stockpile prior to shipment.
Copper-PGE concentrate is anticipated to amount to approximately 53 Tpd (Dmt), with an assumed target moisture content of 8% which amounts to an annual concentrate production of 20,650 Wmt. The remaining bulk concentrate production will be approximately 119 Tpd (Dmt), with an assumed target moisture content of 8% which translates to an annual concentrate production of 46,500 Wmt.
It is anticipated that the two separate concentrate products will be shipped by truck to separate regional smelters suited to handle the separate marketable concentrate products.
Clean Air Metals' management have received indicative terms from selected smelters and refiners. The source of smelting terms is specifically excluded, as smelting terms are confidential in nature. The net payable for a metal is calculated as the payable content of the contained metal, less a minimum deduction (in g/t for palladium, gold, platinum and silver and a % for copper), if applicable. Table 6 shows the net payable rates and deductions for the copper concentrate and sulphide concentrate.
Table 6: Smelter Payable % and Deductions
Payable | Payable % | Deductions | Payable % | Deductions |
(Copper Concentrate) | (Bulk Concentrate) | |||
Platinum | 90% | 1.5 g/t | 90% | 1.5 g/t |
Palladium | 90% | 2.0 g/t | 90% | 2.0 g/t |
Gold | 98% | 1.0 g/t | 98% | 1.0 g/t |
Silver | 98% | 30 g/t | 92% | 30 g/t |
Copper | 96.65% | 1% | 40% | 1% |
Nickel | 65% | |||
The treatment charges (TC) and refining charges (RC) are charges deducted from the payable value of the concentrates to account for the costs of smelting and refining. The TC and RC are influenced by global supply and demand and governed by mine and smelter economics based on copper prices and operating costs. The TC and RC applicable to each concentrate may be based on variable annual negotiations, fixed rates and/or market benchmarks. Table 7 shows the TC and RC charges for the copper concentrate and bulk concentrate. The TC and RC shown in Table 7 was calculated from a 2-year trailing benchmark from CRU (Aug'19 - Jul'21).
Table 7: Smelter TC/RC
Payable | TC | RC | TC | RC |
(Copper Concentrate) | (Bulk Concentrate) | |||
Platinum | US$15/oz | US$15/oz | ||
Palladium | US$15/oz | US$15/oz | ||
Gold | US$4.5/oz | US$4.5/oz | ||
Silver | US$0.45/oz | US$0.45/oz | ||
Copper | US$67.33/wmt | US$0.067/lb | ||
Nickel | US$150/wmt | |||
CRU Consulting (a division of CRU International Ltd), provided the two-year trailing average metal prices used in the revenue projections for the PEA. Nordmin applied these 2-year trailing averages to the minable mineral resource and economic model within the PEA (Table 2). Currently there are no metal streaming or hedging agreements in place.
Onsite Project Infrastructure
Waste Storage Facility
The conceptional WSF will be located to the north of the Plant Site with sufficient offsets from local waterbodies and contain a maximum of 6.0 million tonnes of potentially acid generating (PAG) filtered tailings and 1.3 million tonnes of PAG waste rock. The WSF will be constructed in two stages, with the initial WSF designed to contain 1.3 million tonnes of filtered tailings and 0.4 million tonnes of waste rock to support the first two years of mining. The WSF footprint will be expanded during Year 2 of operations and then the entire WSF footprint will be used to place the waste and raise the facility using the upstream construction method to establish a paddock.
The foundation materials in the area typically consist of a veneer of silty sand with varying gravel content overlying competent bedrock. The overburden will be removed from the WSF footprint to expose the bedrock and drains will be strategically installed to route any collected seepage to perimeter water collection ponds. A starter perimeter berm consisting of non-PAG waste rock from underground mine development, locally quarried rockfill, and locally processed filter zone material will be placed to allow for initial waste placement. The filtered tailings will be transported to the WSF using conveyors and the material will be placed and compacted with a dozer and compactor. The PAG waste rock will be hauled to the WSF and strategically co-disposed with the tailings. Waste and the perimeter berm materials will be placed in generally level lifts across the entire WSF footprint to raise the facility. This approach will prevent ponding of water on the WSF surface and allow any runoff to shed from the WSF. During the winter months, snow will be removed from the interim surfaces as the material is placed.
The WSF will be progressively reclaimed during operations by placing the overburden removed from the foundation excavation on the perimeter embankment slopes and establishing vegetation. A soil cover will be placed on the final WSF surface and vegetation will be established on the cover at closure.
Water Management
Water management for the WSF will include a series of water collection ditches and ponds along the toe of the WSF. The collected water will be pumped to a central water management pond (WMP), which will also be used to collect contact water from the plant site and other site infrastructure. The WMP will provide temporary storage of contact water during normal operations. A floating pump and pipeline will be installed at the WMP to convey the contact water to the mill for re-use in the process or to a water treatment facility. It is expected that the site will operate under a hydrological surplus and contact water will need to be treated, as required, and discharged over a portion of each year. The WMP will also temporarily store runoff from the environmental design flood (EDF) and safely pass runoff resulting from the inflow design flood (IDF) via a spillway.
Offsite Project Infrastructure
Power
Power is assumed to be supplied via a new 230 kV E-W tie line running to the south-east of the project site (expected completion date of 2022) that is accessed by construction of approximately 6 km of new 230 kV power lines. The estimated cost of an electrical substation and power to site is at an estimate costed of $9.36 million.
Access
Access to the mine site is in discussion with a major forestry company via a combination of upgrades to existing logging roads and construction of new roads, totaling 10.5 km, connecting to Highway 527 to the West, at an estimated cost of $1.82 million.
Capital Costs Summary
The initial project capital cost is estimated at $367.2 million, including a contingency allowance of 20% to 25% for major items. The duration of the detailed design and construction phase of the project is estimated at 24 months. The capital cost estimates are detailed in Table 8.
Table 8: Total Capital Cost Estimates
|
Units |
Initial | Ongoing |
Total | |
Category | ||||
Underground Capital Development | $M | $15 | $62 | $77 |
Underground Major Infrastructure | $M | $2 | $12 | $14 |
Underground Mobile Fleet | $M | $27 | $22 | $49 |
Processing Plant / Concentrate Loadout | $M | $154 | $0 | $154 |
Waste Storage Facility | $M | $12 | $10 | $22 |
Other Surface Site Infrastructure | $M | $36 | $7 | $43 |
Offsite Infrastructure | $M | $9 | $1 | $9 |
Pre-Production G&A | $M | $11 | $0 | $11 |
Sustaining Capital | $M | $0 | $46 | $46 |
Mine Closure | $M | $0 | $30 | $30 |
Salvage | $M | $0 | ($30) | ($30) |
EPCM | $M | $41 | $0 | $41 |
Contingency | $M | $60 | $10 | $70 |
Total | $M | $367 | $169 | $536 |
Operating Costs Summary
The operating cost estimates are detailed in Table 9.
Table 9: Total Operating Cost Estimates
Category | Life of Mine $M | LOM Average $/t (Total Mill Feed) |
Underground Mine Operating Costs | $577 | $47.37 |
Processing Plant & WSF | $305 | $25.03 |
G&A Costs | $84 | $6.87 |
Royalties | $33 | $2.63 |
Transportation to Smelter | $58 | $4.71 |
Total | $1,057 | $86.61 |
Financial Analysis and Sensitivity
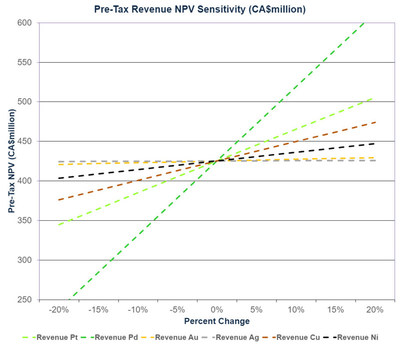
The expected project cashflows were modelled using a simple discounted cashflow model, using a discount rate of 5%. The project cashflow is scheduled annually and uses an exchange rate of 1.3 CAD to USD. All values are in CAD, unless stated otherwise.
A simple tax model was constructed using a depletion model for depreciation estimates. No opening balance of tax credits or eligible prior expenditure was used. Table 10 summarizes the estimated total LOM cashflows. The column at the right is the NPV (cost) of those cashflows. Table 11 summarizes the post-tax revenue and cost NPV sensitivity, Table 12 summarizes the post-Tax discount rate NPV sensitivity, Figures 5 and 6 summarize the post-tax revenue NPV sensitivity and post-tax cost NPV sensitivity, respectively.
Table 10: Key Financials
Cashflow | Units | LOM |
Total Revenue | $M | $2,245 |
Total Operating Costs | $M | $1,057 |
Pre-tax Operating Cashflow | $M | $1,188 |
Total Capital | $M | $536 |
Pre-Tax Accumulated Cashflow | $M | $652 |
Pre-Tax NPV @ 5% Discount | $M | $425 |
Pre-Tax IRR | % | 31.1% |
Taxes | $M | $70 |
Post-Tax Accumulated Cashflow | $M | $582 |
Post-Tax NPV @ 5% Discount | $M | $378 |
Post-Tax IRR | % | 29.8% |
Table 11: Post-Tax Revenue and Cost NPV Sensitivity
Post-Tax NPV Sensitivity (CA$million) | |||||||||
Sensitivity Item | -20% | -15% | -10% | -5% | 0% | 5% | 10% | 15% | 20% |
Revenue Pt | 315 | 331 | 347 | 363 | 378 | 394 | 410 | 426 | 441 |
Revenue Pd | 231 | 268 | 305 | 342 | 378 | 415 | 452 | 488 | 524 |
Revenue Au | 375 | 376 | 377 | 378 | 378 | 379 | 380 | 381 | 382 |
Revenue Ag | 378 | 378 | 378 | 378 | 378 | 379 | 379 | 379 | 379 |
Revenue Cu | 340 | 350 | 359 | 369 | 378 | 388 | 398 | 407 | 417 |
Revenue Ni | 361 | 366 | 370 | 374 | 378 | 383 | 387 | 391 | 396 |
Initial Capital | 433 | 419 | 406 | 392 | 378 | 365 | 351 | 338 | 324 |
Ongoing Capital | 404 | 398 | 391 | 385 | 378 | 372 | 366 | 359 | 353 |
Underground Operating | 442 | 427 | 411 | 395 | 378 | 362 | 346 | 330 | 314 |
Processing Plant / WSF | 412 | 404 | 395 | 387 | 378 | 370 | 362 | 353 | 345 |
Other Operating (G&A, | 398 | 393 | 388 | 383 | 378 | 373 | 369 | 364 | 359 |
Table 12: Post-Tax Discount Rate NPV Sensitivity
Discount Rate | Post-Tax NPV |
(%) | (CA$million) |
0% | 582 |
3% | 450 |
5% | 378 |
7% | 317 |
12% | 199 |
Updated Mineral Resource
Nordmin examined and modelled the mineralization within the Current and Escape deposits for the purpose of grade concentration and isolation of composites, while including lithological, geochemical, and structural correlations between rock types that are influencing the mineralization at each respective deposit. Wireframes were initially created on 10 m to 20 m plan sections and adjusted on vertical section views to edit and smooth each wireframe where required. When not cut off by drilling, the wireframes terminate at the contact of the conduit or due to lack of drilling, whichever was most appropriate. No wireframe overlapping exists within a given domain, but all domains are independent of each other.
Domain wireframes were modelled for seven grade elements, including combined Platinum ("Pt") and Palladium ("Pd"), Gold ("Au"), Silver ("Ag"), Copper ("Cu"), Nickel ("Ni"), Cobalt ("Co"), and Rhodium ("Rh"). Each domain was built using geology, mineralization, and grade bin for a combination of Background grade ("BG"), Low Grade ("LG"), Medium Grade ("MG"), and High Grade ("HG"). Background grades were isolated through applying the overall conduit wireframe.
The Mineral Resource Estimate (MRE) is predominately based on an unchanged geological model and methodologies utilized to calculate the 2021 MRE. The differences in the Current deposit relate to the incorporation of approximately 7,200 m of infill drilling within the Lower Bridge/Upper Beaver area and the corresponding reinterpretation of the infill drilling and incorporating updated metal prices (Table 2), metallurgical and smelter recoveries (Table 5 and Table 6).
The Thunder Bay North Project 2021 PEA, while based largely on MSO analysis in continuous mineralized material within the indicated mineral resource category, is preliminary in nature and includes an economic analysis that is based in part on Inferred Mineral Resources. Inferred mineral resources are considered too speculative geologically for the application of economic considerations that would enable them to be categorized as Mineral Reserves and there is no certainty that the results will be realized. Mineral Resources do not have demonstrated economic viability and are not Mineral Reserves. Table 13 shows the MRE grades and Table 14 shows the MRE contained metals.
Table 13: Thunder Bay North Resource Estimate (Effective Date November 1, 2021)
Category | Area | Tonnes | Pd | Pt | Au | Ag | Cu | Ni | Co | Rh | PtEq |
(g/t) | (g/t) | (g/t) | (g/t) | (%) | (%) | (g/t) | (g/t) | (g/t) | |||
Indicated - | Upper Current | 1,123,518 | 1.54 | 1.67 | 0.10 | 2.29 | 0.41 | 0.21 | 155.30 | 0.07 | 8.19 |
Lower Current | 1,574,152 | 2.38 | 2.56 | 0.13 | 2.99 | 0.52 | 0.23 | 159.05 | 0.05 | 11.49 | |
Bridge | 3,261,258 | 1.90 | 2.14 | 0.11 | 2.77 | 0.47 | 0.20 | 148.33 | 0.05 | 9.37 | |
Beaver | 3,592,490 | 1.39 | 1.54 | 0.06 | 1.61 | 0.27 | 0.22 | 147.57 | 0.03 | 6.90 | |
Cloud | 837,545 | 0.83 | 0.88 | 0.05 | 1.28 | 0.21 | 0.15 | 147.87 | 0.04 | 4.58 | |
Indicated - | Steepledge North | 124,611 | 0.84 | 0.73 | 0.06 | 1.30 | 0.29 | 0.18 | 157.85 | 0.01 | 4.63 |
Steepledge South | 42,812 | 1.05 | 0.89 | 0.05 | 1.15 | 0.28 | 0.17 | 142.66 | 0.00 | 5.02 | |
Escape South | 3,996,938 | 1.22 | 0.95 | 0.13 | 2.52 | 0.53 | 0.29 | 211.89 | 0.06 | 7.73 | |
Comprised of: | |||||||||||
Escape South Perimeter | 1,672,990 | 0.62 | 0.51 | 0.08 | 1.47 | 0.37 | 0.21 | 176.82 | 0.04 | 4.69 | |
Escape South HGZ | 2,323,948 | 1.67 | 1.28 | 0.16 | 3.31 | 0.66 | 0.34 | 238.05 | 0.08 | 9.99 | |
TOTAL | 14,553,324 | 1.54 | 1.58 | 0.10 | 2.30 | 0.42 | 0.23 | 167.33 | 0.05 | 8.12 | |
Inferred - | Beaver | 505,794 | 0.84 | 0.88 | 0.06 | 1.66 | 0.27 | 0.20 | 151.67 | 0.02 | 4.72 |
437-SE | 4,769,004 | 0.60 | 0.63 | 0.07 | 0.98 | 0.33 | 0.13 | 114.94 | 0.01 | 3.74 | |
Inferred - | Steepledge North | 97,464 | 0.59 | 0.50 | 0.05 | 0.58 | 0.27 | 0.21 | 149.59 | 0.00 | 3.74 |
Steepledge South | 1,990,612 | 0.90 | 0.78 | 0.07 | 1.18 | 0.33 | 0.17 | 177.16 | 0.00 | 4.74 | |
Escape South | 714,722 | 0.61 | 0.49 | 0.08 | 0.97 | 0.36 | 0.19 | 177.20 | 0.00 | 4.03 | |
Comprised of: | |||||||||||
Escape South Perimeter | 649,938 | 0.62 | 0.50 | 0.08 | 0.92 | 0.35 | 0.19 | 176.30 | 0.00 | 4.03 | |
Escape South HGZ | 64,784 | 0.53 | 0.40 | 0.09 | 1.43 | 0.36 | 0.20 | 186.07 | 0.01 | 4.01 | |
TOTAL | 8,077,595 | 0.69 | 0.67 | 0.07 | 1.07 | 0.33 | 0.15 | 138.50 | 0.01 | 4.07 | |
Table 14: Thunder Bay North Resource Estimate Contained Metal
Category | Area | Tonnes | Pd | Pt | Au | Ag | Cu | Ni | Co | Rh | PtEq |
(oz) | (oz) | (oz) | (oz) | (t) | (t) | (t) | (oz) | (oz) | |||
Indicated - | Upper Current | 1,123,518 | 55,607 | 60,222 | 3,568 | 82,691 | 4,628 | 2,309 | 174 | 2,420 | 295,814 |
Lower Current | 1,574,152 | 120,255 | 129,778 | 6,507 | 151,304 | 8,107 | 3,627 | 250 | 2,715 | 581,322 | |
Bridge | 3,261,258 | 199,559 | 224,187 | 11,958 | 290,047 | 15,358 | 6,412 | 484 | 4,880 | 982,764 | |
Beaver | 3,592,490 | 160,524 | 177,526 | 7,401 | 185,975 | 9,574 | 7,834 | 530 | 4,033 | 797,121 | |
Cloud | 837,545 | 22,344 | 23,618 | 1,426 | 34,385 | 1,718 | 1,223 | 124 | 1,200 | 123,229 | |
Indicated - | Steepledge North | 124,611 | 3,379 | 2,931 | 250 | 5,200 | 359 | 218 | 20 | 45 | 18,560 |
Steepledge South | 42,812 | 1,448 | 1,223 | 75 | 1,581 | 119 | 72 | 6 | 0 | 6,913 | |
Escape South | 3,996,938 | 156,402 | 121,942 | 16,136 | 324,200 | 21,263 | 11,435 | 847 | 8,219 | 992,858 | |
Comprised of: | |||||||||||
Escape South Perimeter | 1,672,990 | 31,966 | 26,451 | 4,382 | 76,875 | 6,027 | 3,425 | 294 | 2,129 | 246,577 | |
Escape South HGZ | 2,323,948 | 124,437 | 95,491 | 11,754 | 247,325 | 15,236 | 8,010 | 553 | 6,090 | 746,281 | |
TOTAL | 14,553,324 | 719,518 | 741,426 | 47,322 | 1,075,381 | 61,126 | 33,131 | 2,435 | 23,511 | 3,798,581 | |
Inferred - | Beaver | 505,794 | 13,618 | 14,268 | 995 | 27,012 | 1,369 | 1,035 | 77 | 329 | 76,677 |
437-SE | 4,769,004 | 92,264 | 96,427 | 10,111 | 150,294 | 15,545 | 6,089 | 548 | 1,324 | 573,599 | |
Inferred - | Steepledge North | 97,464 | 1,846 | 1,578 | 169 | 1,805 | 260 | 204 | 15 | 0 | 11,730 |
Steepledge South | 1,990,612 | 57,381 | 50,208 | 4,410 | 75,364 | 6,613 | 3,308 | 353 | 0 | 303,144 | |
Escape South | 714,722 | 14,020 | 11,348 | 1,824 | 22,227 | 2,541 | 1,373 | 127 | 70 | 92,496 | |
Comprised of: | |||||||||||
Escape South Perimeter | 649,938 | 12,913 | 10,507 | 1,647 | 19,252 | 2,306 | 1,242 | 115 | 41 | 84,146 | |
Escape South HGZ | 64,784 | 1,108 | 841 | 177 | 2,975 | 235 | 131 | 12 | 29 | 8,350 | |
TOTAL | 8,077,595 | 179,130 | 173,829 | 17,508 | 276,702 | 26,329 | 12,009 | 1,119 | 1,724 | 1,057,646 | |
Mineral Resource Estimate Notes | |
1. | Underground Mineral Resources were prepared in accordance with NI 43-101 and the CIM Definition Standards for Mineral Resources and Mineral Reserves (2014) and the CIM Estimation of Mineral Resources and Mineral Reserves Best Practice Guidelines (2019). Mineral Resources that are not Mineral Reserves do not have demonstrated economic viability. This estimate of Mineral Resources may be materially affected by environmental, permitting, legal, title, taxation, sociopolitical, marketing, or other relevant issues. |
2. | Underground Mineral Resources are based on a 2-year trailing price deck (table 2 above) as of September 30, 2021. |
3. | Resource excludes all material immediately below Current Lake, above a minimum crown pillar thickness of 20 m which is assumed to be not recoverable by underground methods. |
4. | Minor variations may occur during the addition of rounded numbers. |
5. | Calculations used metric units (metres (m), tonnes (t) and grams/tonne (g/t)). |
6. | Assays were variably capped on a domain by domain basis. |
7. | Specific gravity was applied using Ordinary Kriging (OK) estimation. |
8. | Mineral Resource effective date November 1, 2021. |
9. | All figures are rounded to reflect the relative accuracy of the estimates and totals may not add correctly. |
10. | Reported from within a mineralization envelope accounting for mineral continuity. |
Input Parameters for Resource Calculation Mining Cutoff Grade
The cutoff value used for the mineral resource for Current deposit is US$93/tonne (CA$121/tonne) insitu contained value and the Escape deposit is US$100/tonne (CA$130/tonne) insitu contained value. The cutoff value is calculated based on estimations as follows: direct mining operating cost, onsite milling operating cost, tailings management facility operating cost, indirect operating cost, G&A cost, onsite milling metal recoveries, offsite smelting metal recoveries, and smelter metal payable percentages.
Estimated operating costs, onsite estimated mill metal recoveries, offsite estimated smelting metal recoveries and estimated smelter payable percentages used for mineral resource cutoff grade calculations are summarized in Table 15. For resource cutoff calculation purposes, a mining recovery of 100.0% and 0.0% mining dilution were applied.
Table 15: Mineral Resource Estimate Cutoff Grade Calculation
Parameter | Unit | Value | Value |
Currency used for Evaluation | $ | CAD | CAD |
Mill Daily Throughput / Mining Rate | Tonnes per day | 3600 | 3600 |
Long Hole Open Stoping Component | % | 75% | 75% |
Drift and Fill Component | % | 25% | 25% |
Direct Mining Cost | $/t mill feed | $30 | $31 |
Milling / WSF Cost | $/t mill feed | $21 | $21 |
Indirect / G&A Cost | $/t mill feed | $10 | $10 |
Transportation to Refinery Charges | $/t mill feed | $4.9 | $4.5 |
Royalties | % | 1.3% | 1.5% |
Milling Recovery | % | 77% | 77% |
Smelter Recovery & Payables | % | 73% | 68% |
Insitu Contained Value Cutoff ($CAD) | $/t mill feed | $121 | $130 |
Insitu Contained Value Cutoff ($USD) | $/t mill feed | $93 | $100 |
Clean Air Metals expects to complete a mineral resource update in 2022 on the greater than 35,000 m of step-out and delineation drilling that has been completed on the Escape deposit since the January 20, 2021 resource statement. Much of the inferred material in the present PEA mine plan has been a focus of infill drilling activity as previously disclosed and is expected to convert to indicated mineral inventory. Continuity of mineralization has been also demonstrated geophysically (using the Magnetometric Resistivity (MMR) technique). The additional drilling is expected to support the use of the MSO algorithm in a prefeasibility study.
Mineral Resource Estimate Methodology
The Current deposit drill hole database is comprised of 171,465 m from 767 diamond drill holes completed between 2006 and 2021. The Escape deposit drill hole database is comprised of 49,383 m from 137 drill holes completed between 2008 and 2020.
The 3D geological modelling integrates assay and geological data collected from diamond core drilling; surface geologic mapping; airborne magnetic; and radiometric geophysical surveys.
The Current and Escape deposit block models were estimated using nearest neighbours (NN), inverse distance squared (ID2), inverse distance cubed (ID3), and ordinary kriging (OK) interpolation methods for global comparisons and validation purposes. The OK method was used for the MRE; it was selected over ID2, ID3, and NN as the OK method was the most representative approach to controlling the smoothing of grades.
Zonal controls were used to constrain the grade estimates to within each low grade and high grade wireframes. These controls prevented the assays from individual domain wireframes from influencing the block grades of one another, acting as a "hard boundary" between the zones.
Search orientations were used for estimation of the block model and were based on the shape of the modelled mineral domains. A total of three nested searches were performed on all zones. The search distances were based upon the variography ranges.
Search ellipsoids defined by metal modelled variograms, which range from 130 to 140 m in the major axis, 100 m in the minor axis, and 9 to 18 m in the vertical axis. The MRE was estimated with 3 m composites utilizing ordinary kriging and local varying anisotropy. The search radius of the first search was based upon the first structure of the variogram, the second search is approximately two times the first search pass and the third search pass is 1.5 times the initial search. Search strategies for each domain used an elliptical search with a minimum and maximum number of composites. Unestimated blocks were left as absent and not reported in the MRE.
Tables 16 and 17 below illustrate the sensitivity of the MRE to different cutoff grades for a potential underground operation scenario with reasonable outlook for economic extraction. The reader is cautioned that the figures provided in these tables should not be interpreted as a statement of Mineral Resources. Quantities and estimated grades for different cutoff grades are presented for the sole purpose of demonstrating the sensitivity of the resource model to the choice of a specific cutoff grade.
Mineral Resource Estimate
- The Mineral Resources were classified using the 2014 CIM Definition standards and the 2019 CIM Best Practice Guidelines and has an effective date of November 1, 2021. The updated MRE comprises a 14.6 million tonne Indicated Mineral Resource, averaging 8.12 g/t PtEq and an 8.1 million tonne Inferred Mineral Resource, averaging 4.07 g/t PtEq., reported at a cutoff insitu contained value of US$93/tonne for Current deposit and a cutoff insitu contained value of US$100/tonne for Escape deposit (Table 16). Figure 7 shows the PtEq (g/t) Grade-Tonne Curve.
- The current resource represents a 4.5% increase in the indicated material on a contained PtEq metal ounce basis in comparison to the prior January 20, 2021 MRE due to the estimation of 2021 7,500 m infill drilling within the Bridge/Beaver portion of the Current deposit. The infill drilling improved the continuity of medium and higher grade portions of the deposit.
Note: PtEq Grade = Total Metal Value in 1 Tonne ÷ Pt Price per Oz × 31.10348 g per Oz. For the MRE, total metal value includes 8 metals (Platinum, Palladium, Gold, Silver, Rhodium, Cobalt, Copper and Nickel)
Optimization Opportunities and Next Steps
Clean Air Metals has identified additional tradeoff opportunities at a prefeasibility level to enhance sustainability and overall project economics, including:
- Optimization of mineral processing, metals recovery, to potentially make rhodium and cobalt payable metals and to improve total playability of nickel.
- Negotiating competitive rather than Indicative smelter payable terms as project is de-risked and timeline to production reduced.
- Review of direct shipping and toll-milling options to local processor reducing capital intensity of mill concentrator and WSF construction.
- Reduction of PEA-level 20% contingency allowance.
- Sourcing refurbished rather than brand new OEM milling equipment.
- Exploration targeting yielded 1) detailed delineation of braided magma streams in the Beaver zone down plunge in the Current deposit, and 2) discovery of high grade massive sulphide deposits consistent with the Talnakh mineral deposit model, in structures beneath and in the feeder zone areas at the base of the Current and Escape magma conduit intrusions and along the conjoining Escape Lake Fault.
Table 16: Mineral Resource Sensitivity to Reporting Cutoff (Indicated)
Category | Cutoff Insitu | Tonnes | Pt (g/t) | Pd (g/t) | Au (g/t) | Ag (g/t) | Rh (g/t) | Co (g/t) | Cu (%) | Ni (%) | PtEq (g/t) | PdEq (g/t) |
Indicated | 77 | 15,191,639 | 1.55 | 1.41 | 0.08 | 1.95 | 0.04 | 146 | 0.33 | 0.19 | 7.19 | 3.15 |
86 | 13,143,362 | 1.73 | 1.57 | 0.09 | 2.11 | 0.05 | 148 | 0.36 | 0.20 | 7.91 | 3.46 | |
Current | 93 | 11,879,626 | 1.87 | 1.70 | 0.09 | 2.22 | 0.05 | 150 | 0.38 | 0.20 | 8.44 | 3.69 |
Deposit | 100 | 10,880,057 | 2.00 | 1.81 | 0.10 | 2.33 | 0.05 | 151 | 0.40 | 0.21 | 8.93 | 3.91 |
110 | 9,755,864 | 2.16 | 1.96 | 0.10 | 2.46 | 0.05 | 153 | 0.42 | 0.22 | 9.58 | 4.19 | |
120 | 8,878,497 | 2.32 | 2.12 | 0.11 | 2.65 | 0.05 | 155 | 0.41 | 0.22 | 9.91 | 4.48 | |
Indicated | 77 | 5,932,329 | 0.72 | 0.92 | 0.07 | 1.51 | 0.02 | 188 | 0.33 | 0.20 | 5.05 | 2.21 |
86 | 5,116,115 | 0.81 | 1.03 | 0.11 | 2.21 | 0.06 | 201 | 0.47 | 0.26 | 6.75 | 2.95 | |
Escape | 93 | 4,639,233 | 0.87 | 1.11 | 0.12 | 2.33 | 0.06 | 205 | 0.50 | 0.27 | 7.14 | 3.13 |
Deposit | 100 | 4,164,360 | 0.94 | 1.20 | 0.12 | 2.47 | 0.06 | 210 | 0.52 | 0.28 | 7.61 | 3.33 |
110 | 3,515,820 | 1.07 | 1.37 | 0.13 | 2.66 | 0.07 | 216 | 0.56 | 0.30 | 8.39 | 3.67 | |
120 | 2,995,727 | 1.21 | 1.55 | 0.14 | 2.86 | 0.07 | 222 | 0.59 | 0.31 | 9.21 | 4.03 |
Table 17: Mineral Resource Sensitivity to Reporting Cutoff (Inferred)
Category | Cutoff Insitu ($/t) | Tonnes | Pt (g/t) | Pd (g/t) | Au (g/t) | Ag (g/t) | Rh (g/t) | Co (g/t) | Cu (%) | Ni (%) | PtEq (g/t) | PdEq (g/t) |
Inferred | 77 | 8,301,417 | 0.56 | 0.53 | 0.06 | 0.94 | 0.01 | 120 | 0.27 | 0.13 | 3.41 | 1.49 |
86 | 6,097,335 | 0.60 | 0.63 | 0.06 | 1.02 | 0.01 | 119 | 0.30 | 0.13 | 3.70 | 1.62 | |
Current | 93 | 5,274,818 | 0.65 | 0.62 | 0.07 | 1.05 | 0.01 | 118 | 0.32 | 0.14 | 3.83 | 1.68 |
Deposit | 100 | 4,840,267 | 0.67 | 0.64 | 0.07 | 1.05 | 0.01 | 120 | 0.32 | 0.14 | 3.90 | 1.71 |
110 | 3,256,414 | 0.72 | 0.69 | 0.07 | 1.09 | 0.01 | 123 | 0.33 | 0.14 | 4.11 | 1.80 | |
120 | 1,188,886 | 0.94 | 0.90 | 0.07 | 1.24 | 0.02 | 138 | 0.31 | 0.16 | 5.02 | 2.20 | |
Inferred | 77 | 5,347,493 | 0.54 | 0.62 | 0.06 | 1.03 | 0.00 | 162 | 0.28 | 0.17 | 3.71 | 1.62 |
86 | 4,227,441 | 0.60 | 0.69 | 0.06 | 1.07 | 0.00 | 167 | 0.30 | 0.17 | 4.00 | 1.75 | |
Escape | 93 | 3,405,362 | 0.65 | 0.75 | 0.07 | 1.11 | 0.00 | 172 | 0.32 | 0.17 | 4.27 | 1.87 |
Deposit | 100 | 2,802,798 | 0.70 | 0.81 | 0.07 | 1.10 | 0.00 | 176 | 0.34 | 0.17 | 4.52 | 1.98 |
110 | 2,220,097 | 0.77 | 0.90 | 0.07 | 1.11 | 0.00 | 181 | 0.35 | 0.18 | 4.83 | 2.11 | |
120 | 1,706,029 | 0.84 | 0.99 | 0.08 | 1.15 | 0.00 | 187 | 0.36 | 0.18 | 5.17 | 2.26 |
About the Thunder Bay North Project Property
Thunder Bay North Project is located in the Tartan and Greenwich Lake Areas approximately 50 km north of the City of Thunder Bay, Ontario, Canada. The site is paved highway accessible from Thunder Bay on Trans-Canada Highway 11-17 and then north on Highway 527 to the Escape Lake Road network. The proximity of the mine site plan to power (235 kV East-West Tie Line) and transportation infrastructure (paved Highway 527) within the Company's mining claims is felt to offer a competitive advantage.
Proximity to mining supply and services and a skilled workforce within one hour from the City of Thunder Bay is expected to facilitate a future construction decision. Partnerships with affected First Nations (the "Participating Communities") who bring joint-venture capacity and a willing workforce for supply and services to a future mining operation at Thunder Bay North.
Environmental and Social
Clean Air Metals acknowledges that the project is within the Robinson-Superior Treaty territory and that the land on which the project lies is the traditional territory of the Fort William First Nation, Red Rock Indian Band and Biinjitiwaabik Zaaging Anishinaabek. Clean Air Metals has signed a Memorandum of Agreement (January 9, 2020) with each of the three proximate First Nation communities (the Participating Communities).
Clean Air Metals, as well as previous owners, have engaged environmental consulting firms to complete a variety of environmental baseline studies across the project, resulting in a robust historical data set. Baseline data collection is continuing to be collected on physical environment studies (hydrology, surface water, sediment, hydrogeology, metals leaching and acid rock drainage, meteorology and noise), biological environment studies (fish and fish habitat, mammals, birds, species at risk, vegetation and wetlands) and archaeological studies. The data will be used to advance an anticipated Provincial Environmental Assessment and future permitting. Based on the current mine plans, the project is not anticipated to be subject to the federal Impact Assessment Act.
Exploration Upside
A total of 37,100 m of core drilling in 2021 has been completed on the Escape deposit since the Mineral Resource update reported January 20, 2021. Although the Escape South HGZ Area (shown in Figure 8 below) of the PEA mine plan is fully Indicated, a further 10,705 m of drilling in 2022 is required to bring the Steepledge South Area portion of the PEA mine plan into the Indicated Mineral Resource category. A further 19,895 m of drilling in 2022 will also be required in the Lower Beaver Lake Zone and Upper 437 Zone of the Current deposit to bring the PEA mine plan fully into Indicated Mineral Resource (shown in Figure 9 below).
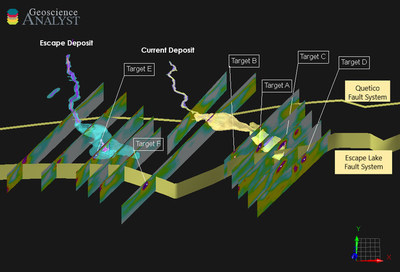
In terms of exploration upside, a total of 16,700 m of drilling is planned at the base of the Escape and Current deposits where six (6) ultra-low resistivity magnetotelluric (MT) anomalies termed Anomalies A, B, C, D, E, F have been identified (shown in Figure 10) along the Escape Lake Fault zone. The feeder system and Escape Lake Fault are important from a massive sulphide exploration perspective. High grade massive sulphide intercepts in core have been discovered within the Current deposit including hole BL10-197 which intersected 52.7 g/t Pt, 41.5 g/t Pd, 3.6 g/t Au, 60.5 g/t Ag and 11.5% Cu over 2.6 m between 187.4- 190.0 m downhole and hole ELR20-041 in the Escape deposit which intersected 7.93 g/t Palladium (Pd), 6.41 g/t Platinum (Pt), 4.76% Copper (Cu), 2.5% Nickel (Ni), 0.151% Cobalt (Co) over 0.5 m from 337.0 m–337.5 m downhole attest to the deposits capacity to host massive sulphide. Given the demonstrated similarity of the Thunder Bay North magmatic system with the Talnakh complex at Norilsk, it is felt that larger deposits should be in the system. The Escape Lake Fault system is erosionally recessive and wet. The exploration team is waiting for a hard freeze to complete additional geophysics (deep seeking pulse EM) and set up the drill.
Please see the link below for Figures 1 to 10.
Figure 1: Site Plan with Mineable Current and Escape Deposits - Link (Click Here)
Figure 2: Current Deposit Long Section (Facing South-West) - Link (Click Here)
Figure 3: Escape Deposit Long Section (Facing South-West) - Link (Click Here)
Figure 4: Conceptual Process Plant Flow Diagram - Link (Click Here)
Figure 5: Post-Tax Revenue NPV Sensitivity - Link (Click Here)
Figure 6: Post-Tax Cost NPV Sensitivity - Link (Click Here)
Figure 7: PtEq (g/t) Grade-Tonne Curve - Link (Click Here)
Figure 8: Escape Deposit Indicated and Inferred Mineable Inventory - Link (Click Here)
Figure 9: Current Deposit Indicated and Inferred Mineable Inventory - Link (Click Here)
Figure 10: Massive Sulphide Targets A-F; Low-resistivity magnetotelluric (MT) anomalies- Link (Click Here)
Technical Information & Qualified Person
The PEA was independently prepared by Mr. Glen Kuntz, P.Geo., Mr. Kurt Boyko, P.Eng. and Mr. Brian Wissent, P.Eng. of Nordmin, Mr. Lyn Jones, P.Eng. of Blue Coast Research, Mr. Wilson Muir, P.Eng. of Knight Piésold Ltd., Mr. Kris Tuuttila P.Geo. (Limited) of DST Consulting, and Dr. Geoff Heggie, Exploration Manager of Clean Air Metals, who are considered "Qualified Persons" under National Instrument 43-101 Standards of Disclosure for Mineral Projects. The technical disclosure in this news release is based upon the information in the PEA prepared by or under the supervision of Mr. Kuntz, Mr. Boyko, Mr. Wissent, Mr. Jones, Mr. Muir, Mr. Tuuttila, and Dr. Heggie.
The technical information in this release has been reviewed and verified by Mr. Glen Kuntz, P.Geo. and Dr. Geoff Heggie who are a "Qualified Persons" for the purpose of National Instrument 43-101.
After-tax results were calculated by Clean Air Metals' management team and verified by the Company Auditor and are not considered independent.
The Company will file a technical report prepared in accordance with National Instrument 43-101 on www.sedar.com within 45 days of this news release.
Carbon Neutrality – Opportunities and Risks
The Thunder Bay Project principal payable commodity suite will be a significant contributor to carbon neutrality. Platinum is critical to the emerging hydrogen economy. Palladium continues to be a regulated and required component for pollution control in catalytic converters in internal combustion engines. Copper is the conductor of choice for electric vehicles (EV) and electrical grid infrastructure. Nickel is a proven EV battery metal.
Future underground mine production at Thunder Bay North would feature a small footprint and be powered by an electrical power grid that is 100% renewable with majority hydroelectric, plus wind and solar. In terms of mine design, the Company will maximize use of electric-powered equipment. The Company is coordinating with a major forestry company operator around co-funding of tree replanting efforts in legacy areas including old gravel pits and decommissioned forestry access roads. The Company will investigate carbon sequestration within ultramafic mine tailing material.
From an Environmental, Social and Governance (ESG) perspective, the Company will help develop capacity in affected aboriginal communities and Métis Nations towards building capacity, training and development of meaningful business opportunities around supply and services, construction and operations at a potential future mine site development. The Company has a diverse Board of Directors and is committed to publishing a full baseline report around ESG factors.
Social Engagement
Clean Air Metals Inc. and its wholly-owned subsidiary Panoramic PGMs (Canada) Ltd. acknowledge that the Thunder Bay North Project is on the traditional territories of the Fort William First Nation, Red Rock First Nation and Biinjitiwabik Zaaging Anishinabek. The parties together are the Cooperating Participants in a Memorandum of Agreement dated January 9, 2021.
The Company appreciates the opportunity to work in these territories and remains committed to the recognition and respect of those who have lived, travelled, and gathered on the lands since time immemorial. Clean Air Metals is committed to stewarding Indigenous heritage and remains committed to building, fostering and encouraging a respectful relationship with First Nations, Métis, and Inuit peoples based upon principles of mutual trust, respect, reciprocity and collaboration in the spirit of reconciliation.
About Clean Air Metals Inc.
Clean Air Metals' flagship asset is the 100% owned, high grade Thunder Bay North Project, a platinum, palladium, copper, nickel project located near the City of Thunder Bay, Ontario and the Lac des Iles Mine owned by Impala Platinum. The Clean Air Metals project hosts the Current deposit and magma conduit and the Company is actively exploring the Escape deposit, a twin structure to the Current deposit. Executive Chair Jim Gallagher and CEO Abraham Drost lead an experienced team of geologists and engineers who are using the Noril'sk magma conduit stratigraphic and mineral deposit model to guide ongoing exploration and development studies. As the former CEO of North American Palladium Ltd. which owned the Lac des Iles Mine prior to the sale to Impala Platinum in December 2019, Jim Gallagher and team are credited with the mine turnaround and creation of significant value for shareholders.
ON BEHALF OF THE BOARD OF DIRECTORS
"Abraham Drost"
Abraham Drost, Chief Executive Officer of Clean Air Metals Inc.
Website: www.cleanairmetals.ca
Neither the TSX Venture Exchange nor its Regulation Services Provider (as that term is defined in policies of the TSX Venture Exchange) accepts responsibility for the adequacy or accuracy of this release.
Cautionary Notes
The information contained herein contains "forward-looking statements" within the meaning of applicable securities legislation, including statements regarding the potential of the Thunder Bay North Project and the Escape Lake and Current Lake deposits and timing of technical studies (include the preliminary economic assessment) and mineral resource estimates. Forward-looking statements relate to information that is based on assumptions of management, forecasts of future results, and estimates of amounts not yet determinable. Any statements that express predictions, expectations, beliefs, plans, projections, objectives, assumptions or future events or performance are not statements of historical fact and may be "forward-looking statements." Forward-looking statements are subject to a variety of risks and uncertainties which could cause actual events or results to differ from those reflected in the forward-looking statements, including, without limitation: political and regulatory risks associated with mining and exploration; risks related to the maintenance of stock exchange listings; risks related to environmental regulation and liability; the potential for delays in exploration or development activities or the completion of feasibility studies; the uncertainty of profitability; risks and uncertainties relating to the interpretation of drill results, the geology, grade and continuity of mineral deposits; risks related to the inherent uncertainty of production and cost estimates and the potential for unexpected costs and expenses; results of prefeasibility and feasibility studies, and the possibility that future exploration, development or mining results will not be consistent with the Company's expectations; risks related to commodity price fluctuations; and other risks and uncertainties related to the Company's prospects, properties and business detailed elsewhere in the Company's disclosure record.
Should one or more of these risks and uncertainties materialize, or should underlying assumptions prove incorrect, actual results may vary materially from those described in forward-looking statements. Investors are cautioned against attributing undue certainty to forward-looking statements. These forward-looking statements are made as of the date hereof and the Company does not assume any obligation to update or revise them to reflect new events or circumstances, except in accordance with applicable securities laws. Actual events or results could differ materially from the Company's expectations or projection.
SOURCE Clean Air Metals Inc.

Share this article