Couchbase Announces Fourth Quarter and Fiscal 2023 Financial Results
SANTA CLARA, Calif., March 7, 2023 /PRNewswire/ -- Couchbase, Inc. (NASDAQ: BASE), the cloud database platform company, today announced financial results for its fourth quarter and fiscal year ended January 31, 2023.
"We delivered another strong quarter of sustained growth along with substantial operational progress in fiscal 2023," said Matt Cain, Chair, President and CEO of Couchbase. "This is a direct result of great execution across the company, which we are particularly pleased with despite this more challenging macro environment. As we begin fiscal 2024, we remain sharply focused on delivering top-line growth, increasing Capella adoption, driving further sales and marketing efficiency and improving profitability."
Fourth Quarter Fiscal 2023 Financial Highlights
- Revenue: Total revenue for the quarter was $41.6 million, an increase of 19% year-over-year. Subscription revenue for the quarter was $38.1 million, an increase of 16% year-over-year.
- Annual recurring revenue (ARR): Total ARR as of January 31, 2023 was $163.7 million, an increase of 23% year-over-year, or 24% on a constant currency basis. See the section titled "Key Business Metrics" below for details.
- Gross margin: Gross margin for the quarter was 85.7%, compared to 88.2% for the fourth quarter of fiscal 2022. Non-GAAP gross margin for the quarter was 86.3%, compared to 88.7% for the fourth quarter of fiscal 2022. See the section titled "Use of Non-GAAP Financial Measures" and the tables titled "Reconciliation of GAAP to Non-GAAP Results" below for details.
- Loss from operations: Loss from operations for the quarter was $18.5 million, compared to $12.7 million for the fourth quarter of fiscal 2022. Non-GAAP operating loss for the quarter was $9.9 million, compared to $9.1 million for the fourth quarter of fiscal 2022.
- Cash flow: Cash flow used in operating activities for the quarter was $10.2 million, compared to $2.7 million in the fourth quarter of fiscal 2022. Capital expenditures were $1.6 million during the quarter, leading to negative free cash flow of $11.8 million, compared to negative free cash flow of $2.7 million in the fourth quarter of fiscal 2022.
- Remaining performance obligations (RPO): RPO as of January 31, 2023 was $165.9 million, an increase of 3% year-over-year.
Full Year Fiscal 2023 Financial Highlights
- Revenue: Total revenue for the year was $154.8 million, an increase of 25% year-over-year. Subscription revenue for the year was $142.9 million, an increase of 23% year-over-year.
- Gross margin: Gross margin for the year was 86.9%, compared to 88.0% for fiscal 2022. Non-GAAP gross margin for the year was 87.6%, compared to 88.4% for fiscal 2022.
- Loss from operations: Loss from operations for the year was $69.3 million, compared to $56.3 million for fiscal 2022. Non-GAAP operating loss for the year was $41.3 million, compared to $45.5 million for fiscal 2022.
- Cash flow: Cash flows used in operating activities for the year were $41.2 million, compared to $41.6 million in fiscal 2022. Capital expenditures were $5.6 million during the year, leading to negative free cash flow of $46.8 million, compared to negative free cash flow of $42.4 million in fiscal 2022.
Recent Business Highlights
- Announced the Couchbase Capella Database-as-a-Service (DBaaS) offering on Azure, allowing customers to improve alignment with applications and support hybrid and multi-cloud strategies from a single platform. Microsoft Azure customers worldwide gain access to Capella to take advantage of the scalability, reliability and agility of Capella on Azure to drive application development and shape business strategies.
- Announced a newly enhanced Independent Software Vendor (ISV) partner program that provides training, certifications, migration support and resources to cost-efficiently help ISVs modernize applications.
- Recognized in the Gartner® Magic Quadrant™ for Cloud Database Management Systems, December 2022.
- Appointed Fidelma Butler as Chief People Officer to lead the people function. Butler brings a wealth of experience and leadership, with a focus on scaling SaaS teams and building award-winning company culture, and was previously a vice president at Zendesk.
Financial Outlook
For the first quarter and full year of fiscal 2024, Couchbase expects:
Q1 FY2024 Outlook | FY2024 Outlook | |||
Total Revenue | $39.5-40.1 million | $171.7-174.7 million | ||
Total ARR | $169.2-172.2 million | $190.0-194.0 million | ||
Non-GAAP Operating Loss | $14.9-14.1 million | $44.0-40.0 million |
The guidance provided above is based on several assumptions that are subject to change and many of which are outside our control. If actual results vary from these assumptions, our expectations may change. There can be no assurance that we will achieve these results.
Couchbase is not able, at this time, to provide GAAP targets for operating loss for the first quarter or full year of fiscal 2024 because of the difficulty of estimating certain items excluded from non-GAAP operating loss that cannot be reasonably predicted, such as charges related to stock-based compensation expense. The effect of these excluded items may be significant.
Conference Call Information
Couchbase will host a live webcast at 2:00 p.m. Pacific Time (or 5:00 p.m. Eastern Time) on Tuesday, March 7, 2023, to discuss its financial results and business highlights. The conference call can be accessed by dialing 877-407-8029 from the United States, or +1 201-689-8029 from international locations. The live webcast and a webcast replay can be accessed from the investor relations page of Couchbase's website at investors.couchbase.com.
Gartner, Magic Quadrant for Cloud Database Management Systems, December 2022
GARTNER and Magic Quadrant are registered trademarks of Gartner, Inc. and/or its affiliates in the U.S. and internationally and is used herein with permission. All rights reserved. Gartner does not endorse any vendor, product or service depicted in its research publications and does not advise technology users to select only those vendors with the highest ratings or other designation. Gartner research publications consist of the opinions of Gartner's Research & Advisory organization and should not be construed as statements of fact. Gartner disclaims all warranties, expressed or implied, with respect to this research, including any warranties of merchantability or fitness for a particular purpose.
About Couchbase
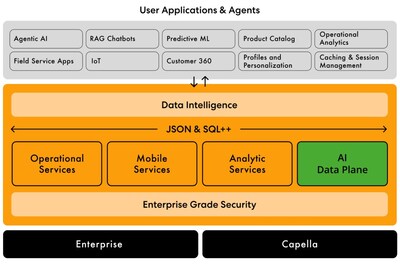
Modern customer experiences need a flexible database platform that can power applications spanning from cloud to edge and everything in between. Couchbase's mission is to simplify how developers and architects develop, deploy and consume modern applications wherever they are. We have reimagined the database with our fast, flexible and affordable cloud database platform Capella, allowing organizations to quickly build applications that deliver premium experiences to their customers – all with best-in-class price performance. More than 30% of the Fortune 100 trust Couchbase to power their modern applications. For more information, visit www.couchbase.com and follow us on Twitter @couchbase.
Couchbase has used, and intends to continue using, its investor relations website and the corporate blog at blog.couchbase.com to disclose material non-public information and to comply with its disclosure obligations under Regulation FD. Accordingly, you should monitor our investor relations website and the corporate blog in addition to following our press releases, SEC filings and public conference calls and webcasts.
Use of Non-GAAP Financial Measures
In addition to our financial information presented in accordance with GAAP, we believe certain non-GAAP financial measures are useful to investors in evaluating our operating performance. We use certain non-GAAP financial measures, collectively, to evaluate our ongoing operations and for internal planning and forecasting purposes. We believe that non-GAAP financial measures, when taken together with the corresponding GAAP financial measures, may be helpful to investors because they provide consistency and comparability with past financial performance and meaningful supplemental information regarding our performance by excluding certain items that may not be indicative of our business, results of operations or outlook. Non-GAAP financial measures are presented for supplemental informational purposes only, have limitations as analytical tools and should not be considered in isolation or as a substitute for financial information presented in accordance with GAAP and may be different from similarly-titled non-GAAP financial measures used by other companies. In addition, other companies, including companies in our industry, may calculate similarly-titled non-GAAP financial measures differently or may use other measures to evaluate their performance, all of which could reduce the usefulness of our non-GAAP financial measures as tools for comparison. Investors are encouraged to review the related GAAP financial measures and the reconciliation of these non-GAAP financial measures to their most directly comparable GAAP financial measures (provided in the financial statement tables included in this press release), and not to rely on any single financial measure to evaluate our business.
Non-GAAP gross profit, non-GAAP gross margin, non-GAAP operating loss, non-GAAP operating margin, non-GAAP net loss attributable to common stockholders and non-GAAP net loss per share attributable to common stockholders: We define these non-GAAP financial measures as their respective GAAP measures, excluding expenses related to stock-based compensation expense, employer taxes on employee stock transactions and restructuring charges. We use these non-GAAP financial measures in conjunction with GAAP measures to assess our performance, including in the preparation of our annual operating budget and quarterly forecasts, to evaluate the effectiveness of our business strategies and to communicate with our board of directors concerning our financial performance.
Beginning with the first quarter of fiscal 2023, we have excluded employer payroll taxes on employee stock transactions, which is a cash expense, from our non-GAAP results. These payroll taxes have been excluded from our non-GAAP results because they are tied to the timing and size of the exercise or vesting of the underlying equity awards, and the price of our common stock at the time of vesting or exercise may vary from period to period independent of the operating performance of our business. Prior period non-GAAP financial measures have not been adjusted to reflect this change, and the effect of this change is not material for any period previously presented.
Free cash flow: We define free cash flow as cash used in operating activities less additions of property and equipment, which includes capitalized internal-use software costs. We believe free cash flow is a useful indicator of liquidity that provides our management, board of directors and investors with information about our future ability to generate or use cash to enhance the strength of our balance sheet and further invest in our business and pursue potential strategic initiatives.
Please see the reconciliation tables at the end of this press release for the reconciliation of GAAP and non-GAAP results.
Key Business Metrics
We review a number of operating and financial metrics, including ARR, to evaluate our business, measure our performance, identify trends affecting our business, formulate business plans and make strategic decisions.
We define ARR as of a given date as the annualized recurring revenue that we would contractually receive from our customers in the month ending 12 months following such date. Based on historical experience with customers, we assume all contracts will be automatically renewed at the same levels unless we receive notification of non-renewal and are no longer in negotiations prior to the measurement date. ARR also includes revenue from consumption-based cloud credits of Couchbase Capella products. ARR for Couchbase Capella products in a customer's initial year is calculated as described above; after a customer's initial year it is calculated by annualizing the prior 90 days of actual consumption, assuming no increases or reductions in usage. ARR excludes revenue derived from the use of cloud products only based on on-demand arrangements and services revenue. ARR should be viewed independently of revenue, and does not represent our revenue under GAAP on an annualized basis, as it is an operating metric that can be impacted by contract start and end dates and renewal dates. ARR is not intended to be a replacement for forecasts of revenue. Although we seek to increase ARR as part of our strategy of targeting large enterprise customers, this metric may fluctuate from period to period based on our ability to acquire new customers and expand within our existing customers. We believe that our ARR is an important indicator of the growth and performance of our business. We updated our definition of ARR beginning in the first quarter of fiscal 2023 to include revenue from consumption-based cloud credits of Couchbase Capella products by annualizing the prior 90 days of actual consumption, assuming no increases or reductions in usage, and updated in the third quarter of fiscal 2023 to clarify that the 90-day actual consumption methodology is only used after a customer's initial year. The reason for these changes is to better reflect the ARR for Couchbase Capella products following the launch of Couchbase Capella in fiscal 2022. ARR for prior periods have not been adjusted to reflect these changes as they are not material to any period previously presented.
We also attempt to represent the changes in the underlying business operations by eliminating fluctuations caused by changes in foreign currency exchange rates within the current period. We calculate constant currency growth rates by applying the applicable prior period exchange rates to current period results.
Forward-Looking Statements
This press release contains "forward-looking" statements within the meaning of the Private Securities Litigation Reform Act of 1995 that are based on management's beliefs and assumptions and on information currently available to management. Forward-looking statements include, but are not limited to, quotations of management, the section titled "Financial Outlook" above and statements about Couchbase's market position, strategies and potential market opportunities. Forward-looking statements generally relate to future events or our future financial or operating performance. Forward-looking statements include all statements that are not historical facts and, in some cases, can be identified by terms such as "anticipate," "expect," "intend," "plan," "believe," "continue," "could," "potential," "remain," "may," "might," "will," "would" or similar expressions and the negatives of those terms. However, not all forward-looking statements contain these identifying words. Forward-looking statements involve known and unknown risks, uncertainties and other factors, including factors beyond our control, which may cause our actual results, performance or achievements to be materially different from any future results, performance or achievements expressed or implied by the forward-looking statements. These risks include, but are not limited to: our history of net losses and ability to achieve or maintain profitability in the future; our ability to continue to grow on pace with historical rates; our ability to manage our growth effectively; intense competition and our ability to compete effectively; cost-effectively acquiring new customers or obtaining renewals, upgrades or expansions from our existing customers; the market for our products and services being relatively new and evolving, and our future success depending on the growth and expansion of this market; our ability to innovate in response to changing customer needs, new technologies or other market requirements; our limited operating history, which makes it difficult to predict our future results of operations; the significant fluctuation of our future results of operations and ability to meet the expectations of analysts or investors; our significant reliance on revenue from subscriptions, which may decline and, the recognition of a significant portion of revenue from subscriptions over the term of the relevant subscription period, which means downturns or upturns in sales are not immediately reflected in full in our results of operations; and the impact of geopolitical and macroeconomic factors and the ongoing COVID-19 pandemic. Further information on risks that could cause actual results to differ materially from forecasted results are included in our filings with the Securities and Exchange Commission that we may file from time to time, including those more fully described in our Quarterly Report on Form 10-Q for the quarter ended October 31, 2022. Additional information will be made available in our Annual Report on Form 10-K for the year ended January 31, 2023 that will be filed with the Securities and Exchange Commission, which should be read in conjunction with this press release and the financial results included herein. Any forward-looking statements contained in this press release are based on assumptions that we believe to be reasonable as of this date. Except as required by law, we assume no obligation to update these forward-looking statements, or to update the reasons if actual results differ materially from those anticipated in the forward-looking statements.
Couchbase, Inc. Condensed Consolidated Statements of Operations | ||||
(in thousands, except per share data) (unaudited) | ||||
Three Months Ended January 31, | Year Ended January 31, | |||
2023 | 2022 | 2023 | 2022 | |
Revenue: | ||||
License | $ 4,977 | $ 6,540 | $ 19,885 | $ 19,008 |
Support and other | 33,158 | 26,245 | 123,010 | 97,279 |
Total subscription revenue | 38,135 | 32,785 | 142,895 | 116,287 |
Services | 3,488 | 2,279 | 11,929 | 7,255 |
Total revenue | 41,623 | 35,064 | 154,824 | 123,542 |
Cost of revenue: | ||||
Subscription(1) | 3,214 | 2,311 | 10,762 | 8,529 |
Services(1) | 2,738 | 1,817 | 9,497 | 6,252 |
Total cost of revenue | 5,952 | 4,128 | 20,259 | 14,781 |
Gross profit | 35,671 | 30,936 | 134,565 | 108,761 |
Operating expenses: | ||||
Research and development(1) | 15,000 | 13,372 | 57,760 | 51,639 |
Sales and marketing(1) | 29,303 | 23,658 | 111,067 | 89,372 |
General and administrative(1) | 8,207 | 6,574 | 33,390 | 24,008 |
Restructuring(1) | 1,663 | — | 1,663 | — |
Total operating expenses | 54,173 | 43,604 | 203,880 | 165,019 |
Loss from operations | (18,502) | (12,668) | (69,315) | (56,258) |
Interest expense | (25) | (26) | (101) | (656) |
Other income (expense), net | 1,938 | (256) | 1,960 | (300) |
Loss before income taxes | (16,589) | (12,950) | (67,456) | (57,214) |
Provision for income taxes | 25 | 286 | 1,038 | 1,015 |
Net loss | $ (16,614) | $ (13,236) | $ (68,494) | $ (58,229) |
Cumulative dividends on Series G | — | — | — | (2,917) |
Net loss attributable to common stockholders | $ (16,614) | $ (13,236) | $ (68,494) | $ (61,146) |
Net loss per share attributable to common | $ (0.37) | $ (0.30) | $ (1.53) | $ (2.37) |
Weighted-average shares used in computing | 45,281 | 43,688 | 44,787 | 25,777 |
_______________________________ | ||||
(1) Includes stock-based compensation expense as follows: | ||||
Stock-based compensation expense | Three Months Ended January 31, | Year Ended January 31, | ||
2023 | 2022 | 2023 | 2022 | |
Cost of revenue—subscription | $ 144 | $ 73 | $ 535 | $ 196 |
Cost of revenue—services | 116 | 80 | 433 | 196 |
Research and development | 2,046 | 1,119 | 7,937 | 3,343 |
Sales and marketing | 2,563 | 1,447 | 9,426 | 3,968 |
General and administrative | 1,922 | 868 | 7,390 | 3,047 |
Restructuring | 65 | — | 65 | — |
Total stock-based compensation expense | $ 6,856 | $ 3,587 | $ 25,786 | $ 10,750 |
Couchbase, Inc. | |||
Condensed Consolidated Balance Sheets | |||
(in thousands) | |||
(unaudited) | |||
As of | As of | ||
Assets | |||
Current assets | |||
Cash and cash equivalents | $ 40,446 | $ 95,688 | |
Short-term investments | 127,856 | 110,266 | |
Accounts receivable, net | 39,847 | 36,696 | |
Deferred commissions | 13,096 | 11,783 | |
Prepaid expenses and other current assets | 8,234 | 8,559 | |
Total current assets | 229,479 | 262,992 | |
Property and equipment, net | 7,430 | 4,288 | |
Operating lease right-of-use assets(2) | 6,940 | — | |
Deferred commissions, noncurrent | 7,524 | 8,243 | |
Other assets | 1,666 | 1,219 | |
Total assets | $ 253,039 | $ 276,742 | |
Liabilities and Stockholders' Equity | |||
Current liabilities | |||
Accounts payable | $ 1,407 | $ 1,923 | |
Accrued compensation and benefits | 12,641 | 16,143 | |
Other accrued expenses | 6,076 | 3,231 | |
Operating lease liabilities(2) | 3,117 | — | |
Deferred revenue | 71,716 | 69,010 | |
Total current liabilities | 94,957 | 90,307 | |
Operating lease liabilities, noncurrent(2) | 4,543 | — | |
Deferred revenue, noncurrent | 3,275 | 2,713 | |
Other liabilities | — | 507 | |
Total liabilities | 102,775 | 93,527 | |
Stockholders' equity | |||
Preferred stock | — | — | |
Common stock | — | — | |
Additional paid-in capital | 561,547 | 525,392 | |
Accumulated other comprehensive loss | (807) | (195) | |
Accumulated deficit | (410,476) | (341,982) | |
Total stockholders' equity | 150,264 | 183,215 | |
Total liabilities and stockholders' equity | $ 253,039 | $ 276,742 | |
_______________________________
(2) | The Company adopted ASU 2016-02, "Leases" (Topic 842) using the modified retrospective method as of February 1, 2022 and elected the |
Couchbase, Inc. | |||||||
Condensed Consolidated Statements of Cash Flows | |||||||
(in thousands) | |||||||
(unaudited) | |||||||
Three Months Ended January 31, | Year Ended January 31, | ||||||
2023 | 2022 | 2023 | 2022 | ||||
Cash flows from operating activities | |||||||
Net loss | $ (16,614) | $ (13,236) | $ (68,494) | $ (58,229) | |||
Adjustments to reconcile net loss to net cash used in | |||||||
Depreciation and amortization | 867 | 710 | 3,171 | 2,824 | |||
Amortization of debt issuance costs | — | — | — | 52 | |||
Stock-based compensation, net of amounts capitalized | 6,856 | 3,587 | 25,786 | 10,750 | |||
Amortization of deferred commissions | 4,447 | 3,940 | 16,996 | 13,763 | |||
Non-cash lease expense | 757 | — | 2,909 | — | |||
Foreign currency transaction (gains) losses | (774) | 377 | 524 | 382 | |||
Other | (593) | 164 | (416) | 267 | |||
Changes in operating assets and liabilities | |||||||
Accounts receivable | (16,941) | (14,289) | (3,537) | (730) | |||
Deferred commissions | (5,321) | (8,867) | (17,590) | (20,495) | |||
Prepaid expenses and other assets | (850) | (333) | (159) | (6,217) | |||
Accounts payable | (1,971) | (1,604) | (495) | (491) | |||
Accrued compensation and benefits | 3,579 | 6,213 | (3,497) | 7,030 | |||
Accrued expenses and other liabilities | 2,803 | (86) | 3,103 | (493) | |||
Operating lease liabilities | (824) | — | (2,754) | — | |||
Deferred revenue | 14,376 | 20,772 | 3,268 | 10,013 | |||
Net cash used in operating activities | (10,203) | (2,652) | (41,185) | (41,574) | |||
Cash flows from investing activities | |||||||
Purchases of short-term investments | (33,976) | (46,200) | (144,613) | (112,479) | |||
Maturities and sales of short-term investments | 45,750 | 1,800 | 126,893 | 21,268 | |||
Additions to property and equipment | (1,553) | (5) | (5,646) | (819) | |||
Net cash provided by (used in) investing activities | 10,221 | (44,405) | (23,366) | (92,030) | |||
Cash flows from financing activities | |||||||
Payments of debt | — | — | — | (25,000) | |||
Proceeds from exercise of stock options | 1,189 | 1,562 | 5,222 | 7,495 | |||
Proceeds from issuance of common stock under ESPP | — | — | 4,484 | — | |||
Proceeds from initial public offering, net of underwriting discounts and commissions | — | — | — | 214,854 | |||
Payment for fractional shares in reverse stock split | — | — | — | (9) | |||
Payments of deferred offering costs | — | — | — | (4,930) | |||
Net cash provided by financing activities | 1,189 | 1,562 | 9,706 | 192,410 | |||
Effect of exchange rate changes on cash, cash | 458 | (257) | (397) | (415) | |||
Net increase (decrease) in cash, cash equivalents and | 1,665 | (45,752) | (55,242) | 58,391 | |||
Cash, cash equivalents, and restricted cash at | 39,324 | 141,983 | 96,231 | 37,840 | |||
Cash, cash equivalents, and restricted cash at end of | $ 40,989 | $ 96,231 | $ 40,989 | $ 96,231 | |||
Reconciliation of cash, cash equivalents, and | |||||||
Cash and cash equivalents | $ 40,446 | $ 95,688 | $ 40,446 | $ 95,688 | |||
Restricted cash included in other assets | 543 | 543 | 543 | 543 | |||
Total cash, cash equivalents and restricted cash | $ 40,989 | $ 96,231 | $ 40,989 | $ 96,231 | |||
Couchbase, Inc. | ||||
Reconciliation of GAAP to Non-GAAP Results | ||||
(in thousands, except per share data) | ||||
(unaudited) | ||||
Three Months Ended January 31, | Year Ended January 31, | |||
2023 | 2022 | 2023 | 2022 | |
Reconciliation of GAAP gross profit to | ||||
Total revenue | $ 41,623 | $ 35,064 | $ 154,824 | $ 123,542 |
Gross profit | $ 35,671 | $ 30,936 | $ 134,565 | $ 108,761 |
Add: Stock-based compensation expense | 260 | 153 | 968 | 392 |
Add: Employer taxes on employee stock transactions | 5 | — | 41 | — |
Non-GAAP gross profit | $ 35,936 | $ 31,089 | $ 135,574 | $ 109,153 |
Gross margin | 85.7 % | 88.2 % | 86.9 % | 88.0 % |
Non-GAAP gross margin | 86.3 % | 88.7 % | 87.6 % | 88.4 % |
Three Months Ended January 31, | Year Ended January 31, | |||
2023 | 2022 | 2023 | 2022 | |
Reconciliation of GAAP operating | ||||
GAAP research and development | $ 15,000 | $ 13,372 | $ 57,760 | $ 51,639 |
Less: Stock-based compensation expense | (2,046) | (1,119) | (7,937) | (3,343) |
Less: Employer taxes on employee stock transactions | (27) | — | (165) | — |
Non-GAAP research and development | $ 12,927 | $ 12,253 | $ 49,658 | $ 48,296 |
GAAP sales and marketing | $ 29,303 | $ 23,658 | $ 111,067 | $ 89,372 |
Less: Stock-based compensation expense | (2,563) | (1,447) | (9,426) | (3,968) |
Less: Employer taxes on employee stock transactions | (76) | — | (294) | — |
Non-GAAP sales and marketing | $ 26,664 | $ 22,211 | $ 101,347 | $ 85,404 |
GAAP general and administrative | $ 8,207 | $ 6,574 | $ 33,390 | $ 24,008 |
Less: Stock-based compensation expense | (1,922) | (868) | (7,390) | (3,047) |
Less: Employer taxes on employee stock transactions | (8) | — | (106) | — |
Non-GAAP general and administrative | $ 6,277 | $ 5,706 | $ 25,894 | $ 20,961 |
GAAP restructuring expense | $ 1,663 | $ — | $ 1,663 | $ — |
Less: Restructuring | (1,663) | — | (1,663) | — |
Non-GAAP restructuring | $ — | $ — | $ — | $ — |
Three Months Ended January 31, | Year Ended January 31, | |||
2023 | 2022 | 2023 | 2022 | |
Reconciliation of GAAP operating loss to | ||||
Total revenue | $ 41,623 | $ 35,064 | $ 154,824 | $ 123,542 |
Loss from operations | $ (18,502) | $ (12,668) | $ (69,315) | $ (56,258) |
Add: Stock-based compensation expense | 6,791 | 3,587 | 25,721 | 10,750 |
Add: Employer taxes on employee stock transactions | 116 | — | 606 | — |
Add: Restructuring | 1,663 | — | 1,663 | — |
Non-GAAP operating loss | $ (9,932) | $ (9,081) | $ (41,325) | $ (45,508) |
Operating margin | (44) % | (36) % | (45) % | (46) % |
Non-GAAP operating margin | (24) % | (26) % | (27) % | (37) % |
Three Months Ended January 31, | Year Ended January 31, | |||
2023 | 2022 | 2023 | 2022 | |
Reconciliation of GAAP net loss | ||||
Net loss attributable to common stockholders | $ (16,614) | $ (13,236) | $ (68,494) | $ (61,146) |
Add: Stock-based compensation expense | 6,791 | 3,587 | 25,721 | 10,750 |
Add: Employer taxes on employee stock transactions | 116 | — | 606 | — |
Add: Restructuring | 1,663 | — | 1,663 | — |
Non-GAAP net loss attributable to common stockholders | $ (8,044) | $ (9,649) | $ (40,504) | $ (50,396) |
GAAP net loss per share attributable to common stockholders | $ (0.37) | $ (0.30) | $ (1.53) | $ (2.37) |
Non-GAAP net loss per share attributable to common stockholders | $ (0.18) | $ (0.22) | $ (0.90) | $ (1.96) |
Weighted average shares outstanding, basic and diluted | 45,281 | 43,688 | 44,787 | 25,777 |
_______________________________ | ||||
(1) For the three months and year ended January 31, 2023, stock-based compensation expense related to | ||||
The following table presents a reconciliation of free cash flow to net cash used in operating activities, the most directly | ||||
Three Months Ended January 31, | Year Ended January 31, | |||
2023 | 2022 | 2023 | 2022 | |
Net cash used in operating activities | $ (10,203) | $ (2,652) | $ (41,185) | $ (41,574) |
Less: Additions to property and equipment | (1,553) | (5) | (5,646) | (819) |
Free cash flow | $ (11,756) | $ (2,657) | $ (46,831) | $ (42,393) |
Net cash provided by (used in) investing activities | $ 10,221 | $ (44,405) | $ (23,366) | $ (92,030) |
Net cash provided by financing activities | $ 1,189 | $ 1,562 | $ 9,706 | $ 192,410 |
Couchbase, Inc. | ||||||||||||
Key Business Metrics | ||||||||||||
(in millions) | ||||||||||||
(unaudited) | ||||||||||||
As of | ||||||||||||
Oct. 31, | Jan. 31, | April 30, | July 31, | Oct. 31, | Jan. 31, | |||||||
2021 | 2022 | 2022 | 2022 | 2022 | 2023 | |||||||
Annual Recurring Revenue | $ 122.3 | $ 132.9 | $ 139.7 | $ 145.2 | $ 151.7 | $ 163.7 | ||||||
SOURCE Couchbase, Inc.



Share this article