EPAM Reports Results for Fourth Quarter and Full Year 2021
Fourth Quarter 2021
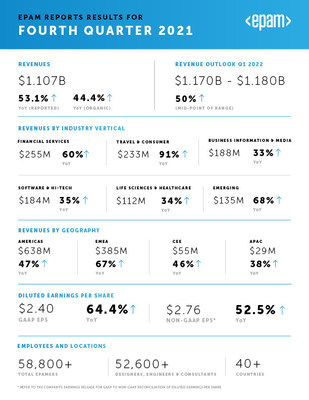
- Revenues of $1.107 billion, up 53.1% year-over-year
- GAAP Income from Operations was 15.0% of revenues and Non-GAAP Income from Operations was 18.6% of revenues
- GAAP Diluted EPS of $2.40, an increase of 64.4%, and Non-GAAP Diluted EPS of $2.76, an increase of 52.5% year-over-year
Full Year 2021
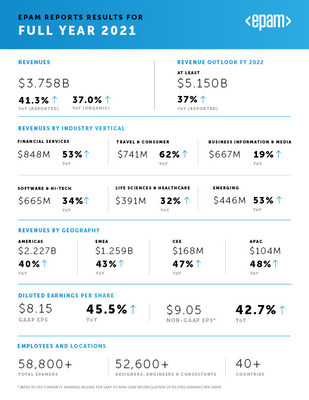
- Revenues of $3.758 billion, up 41.3% year-over-year
- GAAP Income from Operations was 14.4% of revenues and Non-GAAP Income from Operations was 18.0% of revenues
- GAAP Diluted EPS of $8.15, an increase of 45.5%, and Non-GAAP Diluted EPS of $9.05, an increase of 42.7% year-over-year
NEWTOWN, Pa., Feb. 17, 2022 /PRNewswire/ -- EPAM Systems, Inc. (NYSE: EPAM), a leading digital transformation services and product engineering company, today announced results for its fourth quarter and full year ended December 31, 2021.
"We are pleased with our outstanding fourth quarter and 2021 financial performance, despite the ongoing challenges of the global pandemic and continuing geopolitical uncertainties in some of our core talent markets. Our results demonstrate a new level of maturity and scale and underscore our ability to grow and operate an increasingly global organization, while continuing to deliver our trademark quality for our customers," said Arkadiy Dobkin, CEO & President, EPAM. "In 2021, we expanded in consulting and industry domains and added depth in critical engineering disciplines like data, cybersecurity and AI. We were able to do so through a combination of organic efforts and targeted M&A, which enabled us to broaden our capabilities and significantly grow our global and in-market talent footprint. Today, we are well positioned to address the uncertainties ahead by leveraging our broad global reach and deep regional insights, and by applying our Engineering DNA and entrepreneurial culture, to continue making the future real for our clients, employees and global and local communities."
Fourth Quarter 2021 Highlights
- Revenues increased to $1.107 billion, a year-over-year increase of $384 million, or 53.1%. On a constant currency basis, revenues were up 54.1% compared to the fourth quarter of 2020. Acquisitions completed in the last twelve months contributed 8.7% to revenue growth in the quarter;
- GAAP income from operations was $166 million, an increase of $54 million, or 47.9% , compared to $112 million in the fourth quarter of 2020;
- Non-GAAP income from operations was $206 million, an increase of $71 million, or 52.0%, compared to $136 million in the fourth quarter of 2020;
- Diluted earnings per share ("EPS") on a GAAP basis was $2.40, an increase of $0.94, or 64.4%, compared to $1.46 in the fourth quarter of 2020; and
- Non-GAAP diluted EPS was $2.76, an increase of $0.95, or 52.5%, compared to $1.81 in the fourth quarter of 2020.
Full Year 2021 Highlights
- Revenues increased to $3.758 billion, a year-over-year increase of $1.099 billion, or 41.3%. On a constant currency basis, revenues were up 39.9% year-over-year. Acquisitions contributed 4.3% to revenue growth for the year;
- GAAP income from operations was $542 million, an increase of $163 million, or 43.0%, compared to $379 million in 2020;
- Non-GAAP income from operations was $678 million, an increase of $205 million, or 43.5%, compared to $473 million in 2020;
- Diluted EPS on a GAAP basis was $8.15, an increase of $2.55, or 45.5%, compared to $5.60 in 2020; and
- Non-GAAP diluted EPS was $9.05, an increase of $2.71, or 42.7%, compared to $6.34 in 2020.
Cash Flow and Other Metrics
- Cash provided by operating activities was $285 million in the fourth quarter of 2021, an increase from $159 million in the fourth quarter of 2020; and was $572 million in 2021, an increase from $544 million in 2020;
- Cash, cash equivalents and restricted cash totaled $1.449 billion as of December 31, 2021, an increase of $125 million, or 9.5%, from $1.324 billion as of December 31, 2020; and
- Total headcount was approximately 58,800 as of December 31, 2021. Included in this number were approximately 52,600 delivery professionals, an increase of 43.2% from December 31, 2020.
2022 Outlook - Full Year and First Quarter
Full Year
EPAM expects the following for the full year:
- The Company expects revenues will be at least $5.150 billion for 2022 reflecting a year-over-year growth rate of at least 37%, which includes an unfavorable foreign currency translation impact of approximately 1%. Revenue growth on a constant currency basis will be at least 38%. The Company expects acquisitions will contribute approximately 6% to reported revenues;
- For the full year, EPAM expects GAAP income from operations to be in the range of 13.5% to 14.5% of revenues and non-GAAP income from operations to be in the range of 16.5% to 17.5% of revenues;
- The Company expects its GAAP effective tax rate to be approximately 15% and its non-GAAP effective tax rate to be approximately 22%; and
- EPAM expects GAAP diluted EPS to be in the range of $10.43 to $10.76 for the year, and non-GAAP diluted EPS will be in the range of $11.36 to $11.69 for the year. The Company expects weighted average diluted shares outstanding for the year of 59.8 million.
First Quarter
EPAM expects the following for the first quarter:
- The Company expects revenues will be in the range of $1.170 billion to $1.180 billion for the first quarter reflecting a year-over-year growth rate of approximately 50% at the mid-point of the range. EPAM expects that foreign currency translation will have a 1% unfavorable impact on year-over-year revenue growth during the quarter. The Company expects year-over-year revenue growth on a constant currency basis to be approximately 51% at the mid-point of the range. The Company expects acquisitions will contribute approximately 9% to reported revenues;
- For the first quarter, EPAM expects GAAP income from operations to be in the range of 14.5% to 15.5% of revenues and non-GAAP income from operations to be in the range of 16.5% to 17.5% of revenues;
- The Company expects its GAAP effective tax rate to be approximately 8% and its non-GAAP effective tax rate to be approximately 22%; and
- EPAM expects GAAP diluted EPS will be in the range of $2.65 to $2.73 for the quarter, and non-GAAP diluted EPS will be in the range of $2.58 to $2.66 for the quarter. The Company expects weighted average diluted shares outstanding for the quarter of 59.5 million.
Conference Call Information
EPAM will host a conference call to discuss results on Thursday, February 17, 2022, at 8:00 a.m. EST. The live conference call will be available by dialing +1 (844) 707-0662 or +1 (703) 318-2250 (outside of the U.S.). A webcast of the conference call can be accessed in the Investor Relations section of the Company's website at https://investors.epam.com. A replay will be available approximately one hour after the call by dialing +1 (855) 859-2056 or +1 (404) 537-3406 (outside of the U.S.) and entering the conference ID 9155729. The replay will be available until February 24, 2022.
About EPAM Systems
Since 1993, EPAM Systems, Inc. (NYSE: EPAM) has leveraged its advanced software engineering heritage to become the foremost global digital transformation services provider – leading the industry in digital and physical product development and digital platform engineering services. Through its innovative strategy; integrated advisory, consulting and design capabilities; and unique 'Engineering DNA,' EPAM's globally deployed hybrid teams help make the future real for clients and communities around the world by powering better enterprise, education and health platforms that connect people, optimize experiences, and improve people's lives. Selected by Newsweek as a 2021 Most Loved Workplace, EPAM's global multi-disciplinary teams serve customers in more than 40 countries across five continents. As a recognized leader, EPAM is listed among the top 15 companies in Information Technology Services on the Fortune 1000 and ranked as the top IT services company on Fortune's 100 Fastest-Growing Companies list for the last three consecutive years. EPAM is also listed among Ad Age's top 25 World's Largest Agency Companies and in 2020, Consulting Magazine named EPAM Continuum a top 20 Fastest-Growing Firm. Learn more at www.epam.com and follow EPAM on Twitter and LinkedIn.
Non-GAAP Financial Measures
EPAM supplements results reported in accordance with United States generally accepted accounting principles, referred to as GAAP, with non-GAAP financial measures. Management believes these measures help illustrate underlying trends in EPAM's business and uses the measures to establish budgets and operational goals, communicate internally and externally, for managing EPAM's business and evaluating its performance. Management also believes these measures help investors compare EPAM's operating performance with its results in prior periods. EPAM anticipates that it will continue to report both GAAP and certain non-GAAP financial measures in its financial results, including non-GAAP results that exclude stock-based compensation expenses, acquisition-related costs including amortization of intangible assets, impairment of assets, certain other one-time charges and benefits, changes in fair value of contingent consideration, foreign exchange gains and losses, excess tax benefits related to stock-based compensation, and the related effect on income taxes of the pre-tax adjustments. Management also compares operating results on a basis of "constant currency," which is also a non-GAAP financial measure. This measure excludes the effect of foreign currency exchange rate fluctuations by translating the current period revenues and expenses into U.S. dollars at the weighted average exchange rates of the prior period of comparison. Because EPAM's reported non-GAAP financial measures are not calculated in accordance with GAAP, these measures are not comparable to GAAP and may not be comparable to similarly described non-GAAP measures reported by other companies within EPAM's industry. Consequently, EPAM's non-GAAP financial measures should not be evaluated in isolation or supplant comparable GAAP measures, but rather, should be considered together with the information in EPAM's consolidated financial statements, which are prepared in accordance with GAAP.
Forward-Looking Statements
This press release includes estimates and statements which may constitute forward-looking statements made pursuant to the safe harbor provisions of the Private Securities Litigation Reform Act of 1995, the accuracy of which are necessarily subject to risks, uncertainties, and assumptions as to future events that may not prove to be accurate. Our estimates and forward-looking statements are mainly based on our current expectations and estimates of future events and trends, which affect or may affect our business and operations. These statements may include words such as "may," "will," "should," "believe," "expect," "anticipate," "intend," "plan," "estimate" or similar expressions. Those future events and trends may relate to, among other things, the anticipated impact of the COVID-19 pandemic, political and civil unrest or military action in the geographies where we conduct business and operate, and the effect that they may have on our revenues, operations, access to capital, profitability and customer demand. Other factors that could cause actual results to differ materially from those expressed or implied include general economic conditions, the risk factors discussed in the Company's most recent Annual Report on Form 10-K and the factors discussed in the Company's Quarterly Reports on Form 10-Q for the 2020 fiscal year, particularly under the headings "Management's Discussion and Analysis of Financial Condition and Results of Operations" and "Risk Factors" and other filings with the Securities and Exchange Commission. Although we believe that these estimates and forward-looking statements are based upon reasonable assumptions, they are subject to several risks and uncertainties and are made in light of information currently available to us. EPAM undertakes no obligation to update or revise any forward-looking statements, whether as a result of new information, future events, or otherwise, except as may be required under applicable securities law.
EPAM SYSTEMS, INC. AND SUBSIDIARIES | |||||||
Three Months Ended | Year Ended | ||||||
2021 | 2020 | 2021 | 2020 | ||||
Revenues | $ 1,107,464 | $ 723,493 | $ 3,758,144 | $ 2,659,478 | |||
Operating expenses: | |||||||
Cost of revenues (exclusive of depreciation and amortization) | 727,267 | 465,792 | 2,483,697 | 1,732,522 | |||
Selling, general and administrative expenses | 190,939 | 128,929 | 648,736 | 484,758 | |||
Depreciation and amortization expense | 23,591 | 16,779 | 83,395 | 62,874 | |||
Income from operations | 165,667 | 111,993 | 542,316 | 379,324 | |||
Interest and other (loss)/income, net | (4,356) | (2,053) | (1,727) | 3,822 | |||
Foreign exchange loss | (1,362) | (7,920) | (7,197) | (4,667) | |||
Income before provision for income taxes | 159,949 | 102,020 | 533,392 | 378,479 | |||
Provision for income taxes | 17,670 | 16,481 | 51,740 | 51,319 | |||
Net income | $ 142,279 | $ 85,539 | $ 481,652 | $ 327,160 | |||
Net income per share: | |||||||
Basic | $ 2.51 | $ 1.53 | $ 8.52 | $ 5.87 | |||
Diluted | $ 2.40 | $ 1.46 | $ 8.15 | $ 5.60 | |||
Shares used in calculation of net income per share: | |||||||
Basic | 56,754 | 56,031 | 56,511 | 55,727 | |||
Diluted | 59,254 | 58,774 | 59,064 | 58,446 | |||
EPAM SYSTEMS, INC. AND SUBSIDIARIES | |||
As of December 31, 2021 | As of December 31, 2020 | ||
Assets | |||
Current assets | |||
Cash and cash equivalents | $ 1,446,625 | $ 1,322,143 | |
Short-term investments | — | 60,007 | |
Trade receivables and contract assets, net of allowance of $5,521 and $4,886, respectively | 768,928 | 501,062 | |
Prepaid and other current assets | 53,927 | 29,570 | |
Total current assets | 2,269,480 | 1,912,782 | |
Property and equipment, net | 236,214 | 169,533 | |
Operating lease right-of-use assets, net | 184,841 | 228,672 | |
Intangible assets, net | 101,143 | 51,975 | |
Goodwill | 530,723 | 211,956 | |
Deferred tax assets | 143,928 | 92,454 | |
Other noncurrent assets | 56,898 | 53,960 | |
Total assets | $ 3,523,227 | $ 2,721,332 | |
Liabilities | |||
Current liabilities | |||
Accounts payable | $ 24,847 | $ 10,189 | |
Accrued compensation and benefits expenses | 502,997 | 294,709 | |
Accrued expenses and other current liabilities | 142,014 | 79,690 | |
Short-term debt | 16,018 | — | |
Income taxes payable, current | 27,440 | 20,603 | |
Operating lease liabilities, current | 50,104 | 60,759 | |
Total current liabilities | 763,420 | 465,950 | |
Long-term debt | 30,234 | 25,038 | |
Income taxes payable, noncurrent | 42,454 | 43,448 | |
Operating lease liabilities, noncurrent | 142,802 | 180,604 | |
Other noncurrent liabilities | 48,480 | 23,274 | |
Total liabilities | 1,027,390 | 738,314 | |
Commitments and contingencies | |||
Stockholders' equity | |||
Common stock, $0.001 par value; 160,000 authorized; 56,868 and 56,128 shares issued, 56,849 and 56,108 shares outstanding at December 31, 2021 and December 31, 2020, respectively | 57 | 56 | |
Additional paid-in capital | 711,912 | 660,771 | |
Retained earnings | 1,829,532 | 1,347,880 | |
Treasury stock | (177) | (177) | |
Accumulated other comprehensive loss | (54,207) | (25,512) | |
Total EPAM Systems Inc. stockholders' equity | 2,487,117 | 1,983,018 | |
Noncontrolling interest in consolidated subsidiaries | 8,720 | — | |
Total equity | 2,495,837 | 1,983,018 | |
Total liabilities and stockholders' equity | $ 3,523,227 | $ 2,721,332 | |
EPAM SYSTEMS, INC. AND SUBSIDIARIES | |||
Reconciliation of revenue growth as reported on a GAAP basis to revenue growth on a constant currency basis is presented in the table below: | |||
Three Months Ended | Year Ended | ||
Revenue growth as reported | 53.1 % | 41.3 % | |
Foreign exchange rates impact | 1.0 % | (1.4) % | |
Revenue growth on a constant currency basis (1) | 54.1 % | 39.9 % | |
(1) | Constant currency revenue results are calculated by translating current period revenues in local currency into U.S. dollars at the weighted average exchange rates of the comparable prior period. |
Reconciliation of various income statement amounts from GAAP to non-GAAP for the three months and years ended December 31, 2021 and 2020: | |||||||||||
Three Months Ended December 31, 2021 | Year Ended December 31, 2021 | ||||||||||
GAAP | Adjustments | Non-GAAP | GAAP | Adjustments | Non-GAAP | ||||||
Cost of revenues (exclusive of depreciation and amortization)(2) | $ 727,267 | $ (17,028) | $ 710,239 | $ 2,483,697 | $ (51,580) | $ 2,432,117 | |||||
Selling, general and administrative expenses(3) | $ 190,939 | $ (17,874) | $ 173,065 | $ 648,736 | $ (66,651) | $ 582,085 | |||||
Income from operations(4) | $ 165,667 | $ 40,763 | $ 206,430 | $ 542,316 | $ 135,877 | $ 678,193 | |||||
Operating margin | 15.0 % | 3.6 % | 18.6 % | 14.4 % | 3.6 % | 18.0 % | |||||
Net income(5) | $ 142,279 | $ 21,439 | $ 163,718 | $ 481,652 | $ 52,609 | $ 534,261 | |||||
Diluted earnings per share | $ 2.40 | $ 2.76 | $ 8.15 | $ 9.05 | |||||||
Three Months Ended December 31, 2020 | Year Ended December 31, 2020 | ||||||||||
GAAP | Adjustments | Non-GAAP | GAAP | Adjustments | Non-GAAP | ||||||
Cost of revenues (exclusive of depreciation and amortization)(2) | $ 465,792 | $ (8,989) | $ 456,803 | $ 1,732,522 | $ (32,785) | $ 1,699,737 | |||||
Selling, general and administrative expenses(3) | $ 128,929 | $ (11,746) | $ 117,183 | $ 484,758 | $ (48,243) | $ 436,515 | |||||
Income from operations(4) | $ 111,993 | $ 23,860 | $ 135,853 | $ 379,324 | $ 93,368 | $ 472,692 | |||||
Operating margin | 15.5 % | 3.3 % | 18.8 % | 14.3 % | 3.5 % | 17.8 % | |||||
Net income(5) | $ 85,539 | $ 20,565 | $ 106,104 | $ 327,160 | $ 43,480 | $ 370,640 | |||||
Diluted earnings per share | $ 1.46 | $ 1.81 | $ 5.60 | $ 6.34 | |||||||
Items (2) through (5) above are detailed in the table below with the specific cross-reference noted in the appropriate item. |
Three Months Ended December 31, | Year Ended December 31, | ||||||
2021 | 2020 | 2021 | 2020 | ||||
Stock-based compensation expenses | $ 17,028 | $ 8,989 | $ 51,580 | $ 32,785 | |||
Total adjustments to GAAP cost of revenues(2) | 17,028 | 8,989 | 51,580 | 32,785 | |||
Stock-based compensation expenses | 16,989 | 11,455 | 60,075 | 42,453 | |||
Other acquisition-related expenses | 812 | 1,009 | 6,397 | 1,868 | |||
One-time charges/(benefits) | 73 | (718) | 179 | 3,922 | |||
Total adjustments to GAAP selling, general and administrative expenses(3) | 17,874 | 11,746 | 66,651 | 48,243 | |||
Amortization of purchased intangible assets | 5,861 | 3,125 | 17,646 | 12,340 | |||
Total adjustments to GAAP income from operations(4) | 40,763 | 23,860 | 135,877 | 93,368 | |||
Change in fair value of contingent consideration included in Interest and other (loss)/ income, net | 7,420 | 3,308 | 8,782 | 1,827 | |||
Impairment of investment | — | — | — | 313 | |||
Foreign exchange loss | 1,362 | 7,920 | 7,197 | 4,667 | |||
Provision for income taxes: | |||||||
Tax effect on non-GAAP adjustments | (9,307) | (6,868) | (27,619) | (20,049) | |||
Excess tax benefits related to stock-based compensation | (18,799) | (7,655) | (71,628) | (36,646) | |||
Total adjustments to GAAP net income(5) | $ 21,439 | $ 20,565 | $ 52,609 | $ 43,480 | |||
EPAM SYSTEMS, INC. AND SUBSIDIARIES |
The below guidance constitutes forward-looking statements within the meaning of the federal securities laws and is based on a number of assumptions that are subject to change and many of which are outside the control of the Company. Actual results may differ materially from the Company's expectations depending on factors discussed in the Company's filings with the Securities and Exchange Commission. |
Reconciliation of expected revenue growth on a GAAP basis to expected revenue growth on a constant currency basis is presented in the table below: | |||
First Quarter 2022 (at mid-point of range) | Full Year 2022 (at least) | ||
Revenue growth | 50 % | 37 % | |
Foreign exchange rates impact | 1 % | 1 % | |
Revenue growth on a constant currency basis(6) | 51 % | 38 % | |
(6) | Constant currency revenue results are calculated by translating current period projected revenues in local currency into U.S. dollars at the weighted average exchange rates of the comparable prior period. |
Reconciliation of expected GAAP to non-GAAP income from operations as a percentage of revenues is presented in the table below: | |||
First Quarter 2022 | Full Year 2022 | ||
GAAP income from operations as a percentage of revenues | 14.5% to 15.5 % | 13.5% to 14.5 % | |
Stock-based compensation expenses | 1.6 % | 2.4 % | |
Included in cost of revenues (exclusive of depreciation and amortization) | 0.7 % | 1.1 % | |
Included in selling, general and administrative expenses | 0.9 % | 1.3 % | |
Amortization of purchased intangible assets | 0.4 % | 0.6 % | |
Non-GAAP income from operations as a percentage of revenues | 16.5% to 17.5% | 16.5% to 17.5% | |
Reconciliation of expected GAAP to non-GAAP effective tax rate is presented in the table below: | |||
First Quarter 2022 | Full Year 2022 | ||
GAAP effective tax rate (approximately) | 8 % | 15 % | |
Tax effect on non-GAAP adjustments | 1.8 % | 2.0 % | |
Excess tax benefits related to stock-based compensation | 12.2 % | 5.0 % | |
Non-GAAP effective tax rate (approximately) | 22 % | 22 % | |
Reconciliation of expected GAAP to non-GAAP diluted earnings per share is presented in the table below: | |||
First Quarter 2022 | Full Year 2022 | ||
GAAP diluted earnings per share | $2.65 to $2.73 | $10.43 to $10.76 | |
Stock-based compensation expenses | 0.32 | 1.94 | |
Included in cost of revenues (exclusive of depreciation and amortization) | 0.15 | 0.90 | |
Included in selling, general and administrative expenses | 0.17 | 1.04 | |
Other acquisition-related expenses | 0.02 | 0.06 | |
Amortization of purchased intangible assets | 0.10 | 0.40 | |
Foreign exchange loss | 0.02 | 0.10 | |
Provision for income taxes: | |||
Tax effect on non-GAAP adjustments | (0.07) | (0.45) | |
Excess tax benefits related to stock-based compensation | (0.46) | (1.12) | |
Non-GAAP diluted earnings per share | $2.58 to $2.66 | $11.36 to $11.69 | |
SOURCE EPAM Systems, Inc.





Share this article