Accessibility Statement Skip Navigation
  • Resources
  • Blog
  • Journalists
  • Client Login
  • Send a Release
Return to PR Newswire homepage
  • News
  • Products
  • Contact
When typing in this field, a list of search results will appear and be automatically updated as you type.

Searching for your content...

No results found. Please change your search terms and try again.
  • News in Focus
      • Browse News Releases

      • All News Releases
      • All Public Company
      • English-only
      • News Releases Overview

      • Multimedia Gallery

      • All Multimedia
      • All Photos
      • All Videos
      • Multimedia Gallery Overview

      • Trending Topics

      • All Trending Topics
  • Business & Money
      • Auto & Transportation

      • All Automotive & Transportation
      • Aerospace, Defense
      • Air Freight
      • Airlines & Aviation
      • Automotive
      • Maritime & Shipbuilding
      • Railroads and Intermodal Transportation
      • Supply Chain/Logistics
      • Transportation, Trucking & Railroad
      • Travel
      • Trucking and Road Transportation
      • Auto & Transportation Overview

      • View All Auto & Transportation

      • Business Technology

      • All Business Technology
      • Blockchain
      • Broadcast Tech
      • Computer & Electronics
      • Computer Hardware
      • Computer Software
      • Data Analytics
      • Electronic Commerce
      • Electronic Components
      • Electronic Design Automation
      • Financial Technology
      • High Tech Security
      • Internet Technology
      • Nanotechnology
      • Networks
      • Peripherals
      • Semiconductors
      • Business Technology Overview

      • View All Business Technology

      • Entertain­ment & Media

      • All Entertain­ment & Media
      • Advertising
      • Art
      • Books
      • Entertainment
      • Film and Motion Picture
      • Magazines
      • Music
      • Publishing & Information Services
      • Radio & Podcast
      • Television
      • Entertain­ment & Media Overview

      • View All Entertain­ment & Media

      • Financial Services & Investing

      • All Financial Services & Investing
      • Accounting News & Issues
      • Acquisitions, Mergers and Takeovers
      • Banking & Financial Services
      • Bankruptcy
      • Bond & Stock Ratings
      • Conference Call Announcements
      • Contracts
      • Cryptocurrency
      • Dividends
      • Earnings
      • Earnings Forecasts & Projections
      • Financing Agreements
      • Insurance
      • Investments Opinions
      • Joint Ventures
      • Mutual Funds
      • Private Placement
      • Real Estate
      • Restructuring & Recapitalization
      • Sales Reports
      • Shareholder Activism
      • Shareholder Meetings
      • Stock Offering
      • Stock Split
      • Venture Capital
      • Financial Services & Investing Overview

      • View All Financial Services & Investing

      • General Business

      • All General Business
      • Awards
      • Commercial Real Estate
      • Corporate Expansion
      • Earnings
      • Environmental, Social and Governance (ESG)
      • Human Resource & Workforce Management
      • Licensing
      • New Products & Services
      • Obituaries
      • Outsourcing Businesses
      • Overseas Real Estate (non-US)
      • Personnel Announcements
      • Real Estate Transactions
      • Residential Real Estate
      • Small Business Services
      • Socially Responsible Investing
      • Surveys, Polls and Research
      • Trade Show News
      • General Business Overview

      • View All General Business

  • Science & Tech
      • Consumer Technology

      • All Consumer Technology
      • Artificial Intelligence
      • Blockchain
      • Cloud Computing/Internet of Things
      • Computer Electronics
      • Computer Hardware
      • Computer Software
      • Consumer Electronics
      • Cryptocurrency
      • Data Analytics
      • Electronic Commerce
      • Electronic Gaming
      • Financial Technology
      • Mobile Entertainment
      • Multimedia & Internet
      • Peripherals
      • Social Media
      • STEM (Science, Tech, Engineering, Math)
      • Supply Chain/Logistics
      • Wireless Communications
      • Consumer Technology Overview

      • View All Consumer Technology

      • Energy & Natural Resources

      • All Energy
      • Alternative Energies
      • Chemical
      • Electrical Utilities
      • Gas
      • General Manufacturing
      • Mining
      • Mining & Metals
      • Oil & Energy
      • Oil and Gas Discoveries
      • Utilities
      • Water Utilities
      • Energy & Natural Resources Overview

      • View All Energy & Natural Resources

      • Environ­ment

      • All Environ­ment
      • Conservation & Recycling
      • Environmental Issues
      • Environmental Policy
      • Environmental Products & Services
      • Green Technology
      • Natural Disasters
      • Environ­ment Overview

      • View All Environ­ment

      • Heavy Industry & Manufacturing

      • All Heavy Industry & Manufacturing
      • Aerospace & Defense
      • Agriculture
      • Chemical
      • Construction & Building
      • General Manufacturing
      • HVAC (Heating, Ventilation and Air-Conditioning)
      • Machinery
      • Machine Tools, Metalworking and Metallurgy
      • Mining
      • Mining & Metals
      • Paper, Forest Products & Containers
      • Precious Metals
      • Textiles
      • Tobacco
      • Heavy Industry & Manufacturing Overview

      • View All Heavy Industry & Manufacturing

      • Telecomm­unications

      • All Telecomm­unications
      • Carriers and Services
      • Mobile Entertainment
      • Networks
      • Peripherals
      • Telecommunications Equipment
      • Telecommunications Industry
      • VoIP (Voice over Internet Protocol)
      • Wireless Communications
      • Telecomm­unications Overview

      • View All Telecomm­unications

  • Lifestyle & Health
      • Consumer Products & Retail

      • All Consumer Products & Retail
      • Animals & Pets
      • Beers, Wines and Spirits
      • Beverages
      • Bridal Services
      • Cannabis
      • Cosmetics and Personal Care
      • Fashion
      • Food & Beverages
      • Furniture and Furnishings
      • Home Improvement
      • Household, Consumer & Cosmetics
      • Household Products
      • Jewelry
      • Non-Alcoholic Beverages
      • Office Products
      • Organic Food
      • Product Recalls
      • Restaurants
      • Retail
      • Supermarkets
      • Toys
      • Consumer Products & Retail Overview

      • View All Consumer Products & Retail

      • Entertain­ment & Media

      • All Entertain­ment & Media
      • Advertising
      • Art
      • Books
      • Entertainment
      • Film and Motion Picture
      • Magazines
      • Music
      • Publishing & Information Services
      • Radio & Podcast
      • Television
      • Entertain­ment & Media Overview

      • View All Entertain­ment & Media

      • Health

      • All Health
      • Biometrics
      • Biotechnology
      • Clinical Trials & Medical Discoveries
      • Dentistry
      • FDA Approval
      • Fitness/Wellness
      • Health Care & Hospitals
      • Health Insurance
      • Infection Control
      • International Medical Approval
      • Medical Equipment
      • Medical Pharmaceuticals
      • Mental Health
      • Pharmaceuticals
      • Supplementary Medicine
      • Health Overview

      • View All Health

      • Sports

      • All Sports
      • General Sports
      • Outdoors, Camping & Hiking
      • Sporting Events
      • Sports Equipment & Accessories
      • Sports Overview

      • View All Sports

      • Travel

      • All Travel
      • Amusement Parks and Tourist Attractions
      • Gambling & Casinos
      • Hotels and Resorts
      • Leisure & Tourism
      • Outdoors, Camping & Hiking
      • Passenger Aviation
      • Travel Industry
      • Travel Overview

      • View All Travel

  • Policy & Public Interest
      • Policy & Public Interest

      • All Policy & Public Interest
      • Advocacy Group Opinion
      • Animal Welfare
      • Congressional & Presidential Campaigns
      • Corporate Social Responsibility
      • Domestic Policy
      • Economic News, Trends, Analysis
      • Education
      • Environmental
      • European Government
      • FDA Approval
      • Federal and State Legislation
      • Federal Executive Branch & Agency
      • Foreign Policy & International Affairs
      • Homeland Security
      • Labor & Union
      • Legal Issues
      • Natural Disasters
      • Not For Profit
      • Patent Law
      • Public Safety
      • Trade Policy
      • U.S. State Policy
      • Policy & Public Interest Overview

      • View All Policy & Public Interest

  • People & Culture
      • People & Culture

      • All People & Culture
      • Aboriginal, First Nations & Native American
      • African American
      • Asian American
      • Children
      • Diversity, Equity & Inclusion
      • Hispanic
      • Lesbian, Gay & Bisexual
      • Men's Interest
      • People with Disabilities
      • Religion
      • Senior Citizens
      • Veterans
      • Women
      • People & Culture Overview

      • View All People & Culture

      • In-Language News

      • Arabic
      • español
      • português
      • Česko
      • Danmark
      • Deutschland
      • España
      • France
      • Italia
      • Nederland
      • Norge
      • Polska
      • Portugal
      • Россия
      • Slovensko
      • Suomi
      • Sverige
  • Overview
  • Distribution by PR Newswire
  • AI Tools
  • Multichannel Amplification
  • Guaranteed Paid Placement
  • SocialBoost
  • All Products
  • General Inquiries
  • Editorial Bureaus
  • Partnerships
  • Media Inquiries
  • Worldwide Offices
  • Hamburger menu
  • PR Newswire: news distribution, targeting and monitoring
  • Send a Release
    • ALL CONTACT INFO
    • Contact Us

      888-776-0942
      from 8 AM - 10 PM ET

  • Send a Release
  • Client Login
  • Resources
  • Blog
  • Journalists
  • RSS
  • News in Focus
    • Browse All News
    • Multimedia Gallery
    • Trending Topics
  • Business & Money
    • Auto & Transportation
    • Business Technology
    • Entertain­ment & Media
    • Financial Services & Investing
    • General Business
  • Science & Tech
    • Consumer Technology
    • Energy & Natural Resources
    • Environ­ment
    • Heavy Industry & Manufacturing
    • Telecomm­unications
  • Lifestyle & Health
    • Consumer Products & Retail
    • Entertain­ment & Media
    • Health
    • Sports
    • Travel
  • Policy & Public Interest
  • People & Culture
    • People & Culture
  • Send a Release
  • Client Login
  • Resources
  • Blog
  • Journalists
  • RSS
  • Overview
  • Distribution by PR Newswire
  • AI Tools
  • Multichannel Amplification
  • SocialBoost
  • All Products
  • Send a Release
  • Client Login
  • Resources
  • Blog
  • Journalists
  • RSS
  • General Inquiries
  • Editorial Bureaus
  • Partnerships
  • Media Inquiries
  • Worldwide Offices
  • Send a Release
  • Client Login
  • Resources
  • Blog
  • Journalists
  • RSS

Home sales slow as rising mortgage rates drive up monthly payments


News provided by

Zillow

Oct 19, 2022, 08:00 ET

Share this article

Share toX

Share this article

Share toX

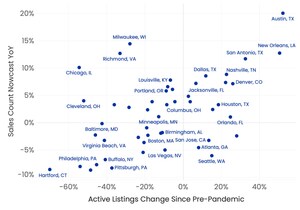
High-growth and high-cost metros across the West are seeing the largest value declines from peak levels

  • The typical U.S. home value stayed steady from August, halting declines in previous months. Values are still up 44% compared to 2019.
  • Home sales in September took a significant step down since August and are nearly 30% lower than at this time last year.
  • Inventory levels are up 3% over 2021, but new listings continue to fall.

SEATTLE, Oct. 19, 2022 /PRNewswire/ -- The housing market continued to cool in September, though rebalancing from monumental appreciation is producing vastly different conditions depending on region and metro, according to Zillow®'s latest market report1. Affordability issues are driving the pullback in activity; steep prices mixed with high and volatile mortgage rates have stunted sales and frozen current owners in their homes, reducing the flow of new inventory. 

Continue Reading
Zillow logo (PRNewsfoto/Zillow Group)

Current homeowners are looking at home prices and the mortgage market and deciding to stay put. Among home sellers, 71% are also buyers. Homeowners who either bought or refinanced at record-low rates over the past two years understand that current rates are going to yield a lot less home than they're currently in unless they seek out a much more affordable area.

At the national level, home values stayed roughly steady from August to September after dropping slightly in the previous two months. The typical U.S. home value is $358,283, up 12.9% from last year and nearly $110,000 (43.5%) above 2019. Of the 100 largest metros, exactly half saw home values rise from August to September. 

"The late-summer mortgage rate reprieve brought a short-lived surge of buyers back into the market, proving that many priced-out home shoppers are poised to buy when homeownership becomes more affordable," said Jeff Tucker, senior economist at Zillow. "Unfortunately, shoppers this winter are more likely to contend with mortgage rates in the ballpark of 7%, making even this summer's rising rates look modest by comparison. Still, as many rate-sensitive shoppers stay sidelined, those who forge ahead now will find more options and more eager sellers than anytime since the pandemic began."

Home values have fallen the furthest from peak levels in expensive and high-growth metros in the Mountain states and on the West Coast; the largest drops are in Austin (-8.2%), San Francisco (-7.9%) and Salt Lake City (-6.8%). Among the 100 largest U.S. metros, the 17 with the largest home value declines from peak levels are in the West. However, owners in these areas should still have significant equity in their homes; home value appreciation since 2019 ranges from 26% in San Francisco to 65% in Austin.  

Sales slowed significantly in September. The number of newly pending listings fell 18% month over month and are down 29.3% compared to last year, in part because of a sharp deceleration in activity at the end of the month, when rates were highest. Sales are down more than 6% from September 2019. Mortgage rates — the largest driver of monthly payments — rose through September and are so volatile, they are hurting buyers' ability to plan for the future.

The flow of new for-sale listings to the market remained anemic; an 11.4% drop from August was the third straight month of double-digit declines. Although the flow of new listings typically slows down at this time of year, the decline from this year's spring peak is larger than in 2019. But even as demand has fallen off, tight supply could insulate the market from a significant price correction.

Total inventory is now 3% above levels a year ago, but remains 38% below that of 2019. Considering the drastic decline in new additions to the market, the rise in total inventory is due to listings staying on the market longer. Listings' median time on the market rose from August and now stands at 19 days. That's a more leisurely pace than last year's 11 days on market, but much faster than in September 2019, when listings typically waited a month before the seller accepted an offer. 

Buyers still in the market are seeing far less competitive conditions than in months past, giving them more time to decide on a home, less chance of a bidding war and greater leverage in negotiations. 

Now at 27.5% nationwide, the share of listings with a price cut is also rising — up from 18.3% in 2021 and September 2019's rate of 22.3%. Among the top-100 largest metro areas, those with the largest share of price cuts are Boise (47.8%), Phoenix (45%), Ogden, Utah (44.4%), and Salt Lake City (43.9%). 

Although rent growth is moderating, rapid increases throughout the pandemic have drastically reduced rental affordability. Zillow's rent index pegs typical U.S. rent at $2,084, with 10.8% annual growth in September, down from a record-breaking peak of 17.2% in February. Month-over-month growth has declined to a more normal rate of 0.3% — far from the peak of 2.2% seen in July 2021. 

But the share of renters' income that goes toward housing has marched up, from 29% in September 2019 to 35% now. When housing costs require more than 30% of a household's income, it becomes a financial burden, leaving less to spend on other essentials, like groceries. And a typical renter spending more than 32% of their income on rent has been tied to a more rapid increase in homelessness. Since 2019, rents have risen the most in Miami (51.5%), Tampa (49.1%) and Phoenix (43.8%). 

Metropolitan Area*

September Zillow Home Value Index (ZHVI) (Raw)

Sept. ZHVI Year-Over-Year Change (Raw)

Sept. ZHVI Month- Over- Month Change (Raw)

Change in Typical Days on Market Since 2021

Share of Listings With a Price Cut 

Zillow Observed Rent Index (ZORI)

Zillow Observed Rent Index Year-Over-Year Change

United States

$358,283

12.9 %

0.0 %

8

27.5 %

$2,084

10.8 %

New York, NY

$619,774

8.4 %

-0.1 %

8

16.8 %

$3,321

15.5 %

Los Angeles, CA

$895,380

5.6 %

-0.6 %

11

26.4 %

$3,019

10.3 %

Chicago, IL

$311,696

9.2 %

0.0 %

5

30.0 %

$1,942

8.8 %

Dallas–Fort Worth, TX

$389,153

16.8 %

-0.4 %

2

36.7 %

$1,876

11.4 %

Philadelphia, PA

$339,514

9.5 %

0.3 %

1

25.9 %

$1,843

8.1 %

Houston, TX

$313,520

14.0 %

-0.1 %

10

32.9 %

$1,628

6.7 %

Washington, DC

$551,350

6.2 %

0.4 %

6

28.8 %

$2,310

7.5 %

Miami–Fort Lauderdale, FL

$477,984

25.7 %

0.6 %

8

21.2 %

$2,912

18.8 %

Atlanta, GA

$382,424

17.6 %

-0.3 %

11

32.8 %

$2,024

8.9 %

Boston, MA

$651,398

8.2 %

-0.1 %

1

22.2 %

$2,902

10.7 %

San Francisco, CA

$1,375,410

2.8 %

-0.1 %

7

26.6 %

$3,304

6.0 %

Detroit, MI

$239,993

7.3 %

-0.1 %

6

28.5 %

$1,495

8.3 %

Riverside, CA

$570,079

8.6 %

-0.9 %

18

30.8 %

$2,647

8.1 %

Phoenix, AZ

$451,313

8.1 %

-2.3 %

24

45.0 %

$1,951

6.6 %

Seattle, WA

$757,495

8.9 %

-0.1 %


36.5 %

$2,368

8.0 %

Minneapolis–St. Paul, MN

$371,712

5.8 %

-0.2 %

7

29.3 %

$1,652

4.3 %

San Diego, CA

$879,980

8.9 %

-0.6 %

13

32.9 %

$3,191

15.0 %

St. Louis, MO

$244,924

10.0 %

0.1 %

1

25.1 %

$1,315

9.7 %

Tampa, FL

$391,114

23.2 %

-0.2 %

11

35.5 %

$2,167

12.0 %

Baltimore, MD

$377,121

7.4 %

-0.2 %

3

27.1 %

$1,815

4.2 %

Denver, CO

$622,434

9.8 %

0.0 %


39.7 %

$2,046

7.1 %

Pittsburgh, PA

$209,094

3.9 %

-0.5 %

2

29.3 %

$1,351

7.5 %

Portland, OR

$565,487

6.1 %

0.1 %

12

35.2 %

$1,979

8.5 %

Charlotte, NC

$388,986

18.9 %

-0.3 %

9

35.2 %

$1,861

12.0 %

Sacramento, CA

$591,512

4.0 %

0.5 %

15

37.3 %

$2,342

5.4 %

San Antonio, TX

$340,964

15.4 %

-0.3 %

14

33.7 %

$1,533

8.0 %

Orlando, FL

$402,021

23.4 %

-0.3 %

10

30.3 %

$2,103

14.1 %

Cincinnati, OH

$265,795

10.8 %

0.5 %

1

25.5 %

$1,479

12.1 %

Cleveland, OH

$220,205

10.0 %

-0.3 %

1

26.3 %

$1,369

7.5 %

Kansas City, MO

$288,727

11.0 %

0.0 %

2

27.3 %

$1,400

11.3 %

Las Vegas, NV

$433,068

12.3 %

-1.9 %

24

42.0 %

$1,871

4.5 %

Columbus, OH

$306,419

13.1 %

-0.1 %

2

28.1 %

$1,510

10.4 %

Indianapolis, IN

$276,020

15.9 %

0.5 %

4

32.5 %

$1,530

11.5 %

San Jose, CA


7

24.1 %

$3,420

9.4 %

Austin, TX

$553,280

6.2 %

-0.9 %

25

38.9 %

$1,950

8.2 %

Virginia Beach, VA

$335,226

11.4 %

0.5 %

0

20.8 %

$1,674

6.0 %

Nashville, TN

$455,447

21.6 %

-0.1 %

13

38.3 %

$1,923

11.3 %

Providence, RI

$452,022

9.8 %

0.4 %

3

21.8 %

$1,968

10.3 %

Milwaukee, WI

$269,220

6.8 %

-0.4 %

-2

17.4 %

$1,279

7.6 %

Jacksonville, FL

$380,452

22.6 %

0.2 %

16

37.8 %

$1,820

9.4 %

Memphis, TN

$236,039

14.8 %

0.1 %

1

22.2 %

$1,543

9.1 %

Oklahoma City, OK

$222,517

14.4 %

0.5 %

5

29.1 %

$1,373

8.2 %

Louisville, KY

$244,904

10.3 %

0.4 %

3

30.4 %

$1,326

12.4 %

Hartford, CT

$321,994

9.2 %

-0.6 %

-2

19.7 %

$1,721

9.2 %

Richmond, VA

$343,978

12.5 %

0.6 %

1

23.1 %

$1,668

11.3 %

New Orleans, LA

$269,526

8.4 %

-1.0 %

-2

31.6 %

$1,548

8.9 %

Buffalo, NY

$245,515

8.6 %

-0.4 %

1

20.7 %

$1,291

8.3 %

Raleigh, NC

$450,960

17.8 %

-0.1 %

11

40.9 %

$1,836

11.1 %

Birmingham, AL

$250,875

13.1 %

0.0 %

6

22.4 %

$1,390

8.4 %

Salt Lake City, UT

$584,819

8.2 %

0.4 %

14

43.9 %

$1,751

12.2 %

*Table ordered by market size 

1  The Zillow Real Estate Market Report is a monthly overview of the national and local real estate markets. The reports are compiled by Zillow Research. For more information, visit www.zillow.com/research.

About Zillow Group
Zillow Group, Inc. (NASDAQ: Z and ZG) is reimagining real estate to make it easier to unlock life's next chapter. As the most visited real estate website in the United States, Zillow® and its affiliates offer customers an on-demand experience for selling, buying, renting, or financing with transparency and ease. 

Zillow Group's affiliates and subsidiaries include Zillow®; Zillow Premier Agent®; Zillow Home Loans™; Zillow Closing Services™; Trulia®; Out East®; StreetEasy®; HotPads®; and ShowingTime+™, which houses ShowingTime®, Bridge Interactive®, and dotloop®. Zillow Home Loans, LLC is an Equal Housing Lender, NMLS #10287 (www.nmlsconsumeraccess.org). 

SOURCE Zillow

WANT YOUR COMPANY'S NEWS FEATURED ON PRNEWSWIRE.COM?

icon3
440k+
Newsrooms &
Influencers
icon1
9k+
Digital Media
Outlets
icon2
270k+
Journalists
Opted In
GET STARTED

Modal title

Also from this source

Zillow brings AI-powered Virtual Staging to Showcase listings

Zillow brings AI-powered Virtual Staging to Showcase listings

Zillow® today announced the launch of Virtual Staging, an AI-powered feature built directly into Zillow Showcase℠, the company's premium listing...

US housing market reaches record $55.1 trillion

US housing market reaches record $55.1 trillion

America's homes are now worth a record $55.1 trillion, a massive $20 trillion jump since the eve of the pandemic, according to a new Zillow® analysis....

More Releases From This Source

Explore

Real Estate

Real Estate

Residential Real Estate

Residential Real Estate

Banking & Financial Services

Banking & Financial Services

Surveys, Polls and Research

Surveys, Polls and Research

News Releases in Similar Topics

Contact PR Newswire

  • Call PR Newswire at 888-776-0942
    from 8 AM - 9 PM ET
  • Chat with an Expert
  • General Inquiries
  • Editorial Bureaus
  • Partnerships
  • Media Inquiries
  • Worldwide Offices

Products

  • For Marketers
  • For Public Relations
  • For IR & Compliance
  • For Agency
  • All Products

About

  • About PR Newswire
  • About Cision
  • Become a Publishing Partner
  • Become a Channel Partner
  • Careers
  • Accessibility Statement
  • APAC
  • APAC - Simplified Chinese
  • APAC - Traditional Chinese
  • Brazil
  • Canada
  • Czech
  • Denmark
  • Finland
  • France
  • Germany
  • India
  • Indonesia
  • Israel
  • Italy
  • Japan
  • Korea
  • Mexico
  • Middle East
  • Middle East - Arabic
  • Netherlands
  • Norway
  • Poland
  • Portugal
  • Russia
  • Slovakia
  • Spain
  • Sweden
  • United Kingdom
  • Vietnam

My Services

  • All New Releases
  • Platform
  • ProfNet
  • Data Privacy

Do not sell or share my personal information:

  • Submit via [email protected] 
  • Call Privacy toll-free: 877-297-8921

Contact PR Newswire

Products

About

My Services
  • All News Releases
  • Platform
  • ProfNet
Call PR Newswire at
888-776-0942
  • Terms of Use
  • Privacy Policy
  • Information Security Policy
  • Site Map
  • RSS
  • Cookies
Copyright © 2025 Cision US Inc.