HORMEL FOODS REPORTS THIRD QUARTER FISCAL 2025 RESULTS
Company Delivered Strong Top-Line Results; Leadership Aligned on a Clear Mission of Profitable Growth
AUSTIN, Minn., Aug. 28, 2025 /PRNewswire/ -- Hormel Foods Corporation (NYSE: HRL), a Fortune 500 global branded food company, today reported results for the third quarter of fiscal 2025, which ended July 27, 2025. All comparisons are to the comparable period of fiscal 2024, unless otherwise noted.
EXECUTIVE SUMMARY — THIRD QUARTER
- Net sales of $3.03 billion; organic net sales1 up 6%
- Operating income of $240 million; adjusted operating income1 of $254 million
- Operating margin of 7.9%; adjusted operating margin1 of 8.4%
- Earnings before income taxes of $237 million; adjusted earnings before income taxes1 of $251 million
- Effective tax rate of 22.3%
- Diluted earnings per share of $0.33; adjusted diluted earnings per share1 of $0.35
- Cash flow from operations of $157 million
EXECUTIVE COMMENTARY AND FOURTH QUARTER OUTLOOK
"I am honored to rejoin this great company and partner with John Ghingo and the entire leadership team to focus on restoring profitable growth," said Jeff Ettinger, interim chief executive officer. "As I have started to meet with team members across the organization, I am confident in the capabilities of our team and the opportunities for our company.
"The third quarter demonstrated the relevance of our portfolio, evidenced by our strong organic volume and net sales performance across each of our segments," said Ettinger. "Our earnings results, however, were disappointing, and we fell short of our expectations. The steep rise in commodity input costs affecting our industry was the largest contributor to our shortfall. This inflation was partially mitigated by our Transform and Modernize (T&M) initiative.
"Regarding the fourth quarter, we expect continued net sales growth supported by our leading positions in the marketplace. To address commodity inflation, we are taking targeted pricing actions. We expect profit recovery to lag into next year, with the near-term pressures we experienced in the third quarter persisting through the fourth quarter.
"We are confident in our portfolio's ability to continue delivering impressive top-line results, despite today's dynamic consumer environment, and we are committed to translating that performance into improved earnings," said Ettinger. "Our entire team is aligned on a clear mission: build on our top-line momentum, urgently return bottom-line growth, and deliver long-term, sustainable value."
Fourth Quarter | |
Net Sales | $3.15 - $3.25 billion |
Organic Net Sales1 Growth Rate | 1% - 4% |
Diluted Earnings per Share | $0.36 - $0.38 |
Adj. Diluted Earnings per Share1 | $0.38 - $0.40 |
PROGRESS EXECUTING STRATEGIC PRIORITIES – Q3 HIGHLIGHTS
"I am proud of the top-line momentum we built in the third quarter," said John Ghingo, president. "The gap between this performance and our profitability is not the outcome we were aiming for and certainly overshadows several bright spots across the business. Still, we advanced our key priorities during the quarter, which positions us well for the sustained health of our company."
Drive focus and growth in our Retail business
- Jennie-O® lean ground turkey delivered another impressive quarter of results, fueled by sustained consumer demand and expanded distribution. The brand advanced its category leadership, capturing incremental dollar share.2
- The team leveraged the iconic equity of the SPAM® brand through partnerships with customers on significant summer programs, the kickoff of a high-impact limited-time-only design, and the launch of new SPAM® singles flavors: bacon, and hot and spicy.
Expand leadership in Foodservice
- In a highly competitive pizza toppings landscape, Hormel® premium pepperoni grew volume by over 20% in the quarter.3
- As customers seek solutions, they consistently turned to Hormel Foods and our high-performing direct selling team – recognized for the 24th consecutive year by Selling Power as one of the best companies to sell for,4 a testament to the value we consistently deliver.
Aggressively develop our global presence
- Our in-country China team serves as a key engine of innovation for the segment, with recent innovation continuing to perform well. Meat-snacking innovation delivered strong performance, and the team strategically launched Skippy® cones into a new channel, further accelerating distribution growth globally.
Execute our enterprise entertaining & snacking vision
- The Planters® brand made notable progress this quarter, with a focus on closing distribution gaps, strengthening brand equity and investing in innovation – highlighted by the launch of the limited-time bar nuts variety to reengage consumers and drive excitement for summer snacking. These actions enabled the brand to reach year-over-year dollar sales growth at the end of the quarter,5 while growing household penetration.6
- The launch of the Wholly® guacamole chili lime variety brought a bold, customizable twist to refrigerated dips, elevating summer snacking and entertaining with the craveable flavor fusion of chili lime seasoning and America's No. 1 branded refrigerated guacamole.2
Continue to transform & modernize our Company
- As anticipated, the T&M initiative delivered another impactful quarter, with approximately 90 projects contributing measurable value and earnings to the enterprise.
- Through the T&M initiative, the team continued the work of optimizing our manufacturing network. This included the strategic decision to partially close one facility and reallocate production volume to other locations within our broader network, aimed at enhancing operational efficiency and long-term scalability.
- Hormel® pepperoni underwent a brand renovation, with modernized packaging, the debut of the "Boldly Irresistible" campaign, and the launch of new flavors to drive consumer engagement and accelerate growth. As the No.1 retail pepperoni brand,2 this strategic refresh positions the brand for continued category leadership and long-term relevance.
SEGMENT HIGHLIGHTS – THIRD QUARTER
Retail
- Volume up 5%
- Net sales up 5%
- Segment profit down 4%
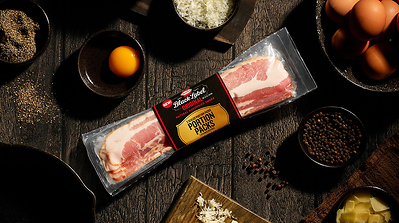
Net sales growth was wide ranging in the Retail segment in the third quarter of fiscal 2025. Meaningful volume and net sales contributions came from the turkey portfolio, Planters® snack nuts and the SPAM® family of products. Other brands which grew volume and net sales in the quarter include Wholly® guacamole, Hormel® Black Label® bacon, Hormel® chili, and Gatherings® party trays. Retail segment profit declined in the third quarter of fiscal 2025, as robust top-line growth was more than offset by input cost pressures and higher selling, general and administrative expenses.
Foodservice
- Volume down 4%; organic volume1 up 2%
- Net sales up 3%; organic net sales1 up 7%
- Segment profit down 1%
Organic volume1 and organic net sales1 growth were broad-based in the Foodservice segment in the third quarter of fiscal 2025, with significant contributions from the customized solutions business, Planters® snack nuts and the Jennie-O® turkey portfolio. Other branded products, such as Hormel® pepperoni, Hormel® Fire Braised™ meats and Café H® globally inspired proteins, delivered strong volume and net sales growth. Segment profit decreased for the third quarter of fiscal 2025 as meaningful net sales growth was more than offset by the rise in commodity input costs and margin pressures, primarily in non-core businesses. The Foodservice segment continued to benefit from an extensive range of solutions-based products, its direct-selling organization and a diverse channel presence during the third quarter.
International
- Volume up 8%
- Net sales up 6%
- Segment profit down 13%
Strong volume and net sales performance in the International segment was driven by growth across the China market and robust exports of SPAM® luncheon meat in the third quarter of fiscal 2025. International segment profit decreased in the third quarter of fiscal 2025, as meaningful net sales growth was more than offset by competitive pressures in Brazil and lower pork offal margins.
SELECTED FINANCIAL DETAILS – THIRD QUARTER FISCAL 2025
- Advertising investments were $41 million, compared to $40 million last year. In the fourth quarter of fiscal 2025, the Company expects advertising investments to decline compared to the prior year.
- The effective tax rate was 22.3%, compared to 21.7% last year, primarily due to decreased benefits from the purchase of federal transferable energy credits compared to the prior year. The effective tax rate for fiscal 2025 is expected to be approximately 22.0%.
- Capital expenditures were $72 million, compared to $65 million last year. The largest projects in the quarter were related to capacity expansions for Hormel® Fire Braised™ products, Applegate® products, and investments in data and technology. Capital expenditures for fiscal 2025 are estimated to be approximately $300 million.
- Depreciation and amortization expense was $65 million, comparable to last year. The full-year expectation for fiscal 2025 is approximately $260 million.
- The Company returned approximately $159 million to stockholders during the quarter through dividends.
PRESENTATION
A conference call will be webcast at 8 a.m. CT on Aug 28, 2025. Access is available at hormelfoods.com by clicking on "Investors." The call will also be available via telephone by dialing 800-549-8228 (toll-free) or 646-564-2877 (international) and providing the conference ID 56462. An audio replay is available at hormelfoods.com. The webcast replay will be available at noon CT, Aug 28, 2025, and will remain on the website for one year.
ABOUT HORMEL FOODS - Inspired People. Inspired Food.™
Hormel Foods Corporation, based in Austin, Minnesota, is a global branded food company with approximately $12 billion in annual revenue across more than 80 countries worldwide. Its brands include Planters®, Skippy®, SPAM®, Hormel® Natural Choice®, Applegate®, Justin's®, Wholly®, Hormel® Black Label®, Columbus®, Jennie-O® and more than 30 other beloved brands. The company is a member of the S&P 500 Index and the S&P 500 Dividend Aristocrats, was named one of the best companies to work for by U.S. News & World Report, one of America's most responsible companies by Newsweek, recognized by TIME magazine as one of the World's Best Companies and has received numerous other awards and accolades for its corporate responsibility and community service efforts. The company lives by its purpose statement — Inspired People. Inspired Food.™ — to bring some of the world's most trusted and iconic brands to tables across the globe. For more information, visit hormelfoods.com.
FORWARD-LOOKING STATEMENTS
This press release contains "forward-looking" information within the meaning of the federal securities laws. The "forward-looking" information may include statements concerning the Company's outlook for the future as well as other statements of beliefs, future plans, strategies, or anticipated events and similar expressions concerning matters that are not historical facts. Words or phrases such as "should result," "believe," "intend," "plan," "are expected to," "targeted," "will continue," "will approximate," "is anticipated," "estimate," "project," or similar expressions are intended to identify forward-looking statements. Such statements are subject to certain risks and uncertainties that could cause actual results to differ materially from historical earnings and those anticipated or projected, which factors include, but are not limited to, risks related to the deterioration of economic conditions; risks associated with acquisitions, joint ventures, equity investments, and divestitures; risks and uncertainties associated with intangible assets, including any future goodwill or intangible assets impairment charges; the risk of disruption of operations, including at owned facilities, co-manufacturers, suppliers, logistics providers, customers, or other third-party service providers; the risk that the Company may fail to realize anticipated cost savings or operating profit improvements associated with strategic initiatives, including the Transform and Modernize initiative; risk of loss of a significant contract or unfavorable changes in the Company's relationships with significant customers; risk of the Company's inability to protect information technology (IT) systems against, or effectively respond to, cyber attacks, security breaches or other IT interruptions, against or involving the Company's IT systems or those of others with whom it does business; risk of the Company's failure to timely replace legacy technologies; deterioration of labor relations or labor availability or increases to labor costs; general risks of the food industry, including those related to food safety, such as costs resulting from food contamination, product recalls, the remediation of food safety events at its facilities, including the production disruption at the Suffolk, Virginia, facility, food-specific laws or regulations, or outbreaks of disease among livestock and poultry flocks; fluctuations in commodity prices and availability of raw materials and other inputs; fluctuations in market demand for the Company's products, including due to private label products and lower-priced alternatives; risks related to the Company's ability to respond to changing consumer preferences, diets and eating patterns, and the success of innovation and marketing investments; damage to the Company's reputation or brand image; risks associated with climate change, or legal, regulatory, or market measures to address climate change; risks of litigation; potential sanctions and compliance costs arising from government regulation; compliance with stringent environmental regulations and potential environmental litigation; and risks arising from the fact that the Company operates globally, with product manufactured and sold in foreign markets and a variety of inputs sourced from around the world, these risks including geopolitical risk, exchange rate risk, legal, tax, and regulatory risk, and risks associated with trade policies, export and import controls, and tariffs. Please refer to the cautionary statements regarding "Risk Factors" and "Forward-Looking Statements" that appear in our most recent Annual Report on Form 10-K and Quarterly reports on Form 10-Q, which can be accessed at www.hormelfoods.com in the "Investors" section, for additional information. In making these statements, the Company is not undertaking, and specifically declines to undertake, any obligation to address or update each or any factor in future filings or communications regarding the Company's business or results, and is not undertaking to address how any of these factors may have caused changes to discussions or information contained in previous filings or communications. Though the Company has attempted to list comprehensively these important cautionary risk factors, the Company wishes to caution investors and others that other factors may in the future prove to be important in affecting the Company's business or results of operations. The Company cautions readers not to place undue reliance on forward-looking statements, which represent current views as of the date made.
Note: Due to rounding, numbers presented throughout this press release may not sum precisely to the totals provided, and percentages may not precisely reflect the absolute figures.
END NOTES
1 | Non-GAAP measure. Organic volume and organic net sales exclude the impact of the sale of Hormel Health Labs, LLC in the Foodservice segment in the fourth quarter of fiscal 2024. Adjusted performance measures exclude nonrecurring impacts of the Company's Transform and Modernize initiative, loss on sale of business, and legal matters. See Appendix: Non-GAAP Measures to this press release for more information. |
2 | Circana Total US MULO+; Latest 13 Weeks Ended 7/13/2025. |
3 | Internal data. |
4 | Selling Power magazine's 60 Best Companies to Sell for 2025 list. |
5 | Circana Total US MULO+; Latest 4 Weeks Ended 7/13/2025. |
6 | Circana Scan Panel, Total US – All Outlets, Latest 4 Weeks Ended 7/13/2025. |
HORMEL FOODS CORPORATION | ||||||||
CONSOLIDATED STATEMENTS OF OPERATIONS | ||||||||
In thousands, except per share amounts | ||||||||
Unaudited | ||||||||
Quarter Ended | Nine Months Ended | |||||||
July 27, 2025 | July 28, 2024 | July 27, 2025 | July 28, 2024 | |||||
Net Sales | $ 3,032,876 | $ 2,898,443 | $ 8,920,499 | $ 8,782,706 | ||||
Cost of Products Sold | 2,545,567 | 2,410,075 | 7,473,524 | 7,281,798 | ||||
Gross Profit | 487,309 | 488,369 | 1,446,975 | 1,500,908 | ||||
Selling, General, and Administrative | 258,713 | 259,653 | 773,158 | 766,707 | ||||
Equity in Earnings of Affiliates | 11,153 | 7,977 | 42,614 | 39,250 | ||||
Operating Income | 239,748 | 236,693 | 716,430 | 773,452 | ||||
Interest and Investment Income | 16,227 | 10,484 | 27,084 | 43,416 | ||||
Interest Expense | 19,461 | 21,459 | 58,438 | 61,464 | ||||
Earnings Before Income Taxes | 236,514 | 225,719 | 685,076 | 755,404 | ||||
Provision for Income Taxes | 52,818 | 48,984 | 151,107 | 170,733 | ||||
Effective Tax Rate | 22.3 % | 21.7 % | 22.1 % | 22.6 % | ||||
Net Earnings | 183,696 | 176,735 | 533,968 | 584,671 | ||||
Less: Net Earnings (Loss) Attributable | (46) | 34 | (366) | (170) | ||||
Net Earnings Attributable to Hormel | $ 183,742 | $ 176,701 | $ 534,334 | $ 584,842 | ||||
Net Earnings Per Share | ||||||||
Basic | $ 0.33 | $ 0.32 | $ 0.97 | $ 1.07 | ||||
Diluted | $ 0.33 | $ 0.32 | $ 0.97 | $ 1.07 | ||||
Weighted-average Shares Outstanding | ||||||||
Basic | 550,408 | 548,685 | 550,048 | 547,858 | ||||
Diluted | 550,723 | 549,266 | 550,396 | 548,624 | ||||
Dividends Declared Per Share | $ 0.2900 | $ 0.2825 | $ 0.8700 | $ 0.8475 | ||||
HORMEL FOODS CORPORATION | ||||
CONSOLIDATED CONDENSED STATEMENTS OF FINANCIAL POSITION | ||||
In thousands | ||||
Unaudited | ||||
July 27, 2025 | October 27, 2024 | |||
Assets | ||||
Cash and Cash Equivalents | $ 599,189 | $ 741,881 | ||
Short-term Marketable Securities | 31,480 | 24,742 | ||
Accounts Receivable | 764,338 | 817,908 | ||
Inventories | 1,821,860 | 1,576,300 | ||
Taxes Receivable | 50,559 | 50,380 | ||
Prepaid Expenses and Other Current Assets | 55,064 | 35,265 | ||
Total Current Assets | 3,322,490 | 3,246,476 | ||
Goodwill | 4,923,218 | 4,923,487 | ||
Intangible Assets | 1,721,487 | 1,732,705 | ||
Pension Assets | 192,123 | 205,964 | ||
Investments in Affiliates | 698,632 | 719,481 | ||
Other Assets | 426,068 | 411,889 | ||
Net Property, Plant, and Equipment | 2,212,709 | 2,194,728 | ||
Total Assets | $ 13,496,726 | $ 13,434,729 | ||
Liabilities and Shareholders' Investment | ||||
Accounts Payable & Accrued Expenses | $ 766,788 | $ 801,984 | ||
Accrued Marketing Expenses | 117,328 | 108,156 | ||
Employee-related Expenses | 251,860 | 283,490 | ||
Interest and Dividends Payable | 174,361 | 175,941 | ||
Taxes Payable | 28,454 | 21,916 | ||
Current Maturities of Long-term Debt | 6,740 | 7,813 | ||
Total Current Liabilities | 1,345,531 | 1,399,299 | ||
Long-term Debt Less Current Maturities | 2,850,165 | 2,850,944 | ||
Pension and Post-retirement Benefits | 386,554 | 379,891 | ||
Deferred Income Taxes | 595,066 | 589,366 | ||
Other Long-term Liabilities | 226,316 | 211,219 | ||
Accumulated Other Comprehensive Loss | (275,006) | (263,331) | ||
Other Shareholders' Investment | 8,368,098 | 8,267,342 | ||
Total Liabilities and Shareholders' Investment | $ 13,496,726 | $ 13,434,729 | ||
HORMEL FOODS CORPORATION | ||||||||
CONSOLIDATED CONDENSED STATEMENTS OF CASH FLOWS | ||||||||
In thousands | ||||||||
Unaudited | ||||||||
Quarter Ended | Nine Months Ended | |||||||
July 27, 2025 | July 28, 2024 | July 27, 2025 | July 28, 2024 | |||||
Operating Activities | ||||||||
Net Earnings | $ 183,696 | $ 176,735 | $ 533,968 | $ 584,671 | ||||
Depreciation and Amortization | 64,692 | 63,658 | 194,527 | 191,354 | ||||
Decrease (Increase) in Working Capital | (95,844) | (34,834) | (255,011) | 43,777 | ||||
Other | 4,154 | 12,431 | 48,860 | 38,315 | ||||
Net Cash Provided by (Used in) | 156,698 | 217,990 | 522,345 | 858,117 | ||||
Investing Activities | ||||||||
Net Sale (Purchase) of Securities | (1,434) | (607) | (6,170) | (6,106) | ||||
Proceeds from Sale of Business | — | — | 13,139 | — | ||||
Purchases of Property, Plant, and | (72,194) | (65,481) | (219,444) | (172,656) | ||||
Proceeds from (Purchases of) Affiliates | (584) | (6,231) | (3,283) | (6,681) | ||||
Other | 7,890 | 8,136 | 10,767 | 8,544 | ||||
Net Cash Provided by (Used in) | (66,323) | (64,183) | (204,991) | (176,899) | ||||
Financing Activities | ||||||||
Proceeds from Long-term Debt | — | — | — | 497,765 | ||||
Repayments of Long-term Debt and | (2,005) | (952,277) | (6,250) | (956,797) | ||||
Dividends Paid on Common Stock | (159,467) | (154,943) | (473,692) | (459,978) | ||||
Other | (1,784) | 6,325 | 24,057 | 39,187 | ||||
Net Cash Provided by (Used in) | (163,256) | (1,100,895) | (455,884) | (879,823) | ||||
Effect of Exchange Rate Changes on | 2,381 | (1,806) | (4,161) | (453) | ||||
Increase (Decrease) in Cash and Cash | (70,499) | (948,893) | (142,692) | (199,057) | ||||
Cash and Cash Equivalents at Beginning | 669,688 | 1,486,368 | 741,881 | 736,532 | ||||
Cash and Cash Equivalents at End of | $ 599,189 | $ 537,476 | $ 599,189 | $ 537,476 | ||||
HORMEL FOODS CORPORATION | ||||||||||||
SEGMENT DATA | ||||||||||||
In thousands | ||||||||||||
Unaudited | ||||||||||||
Quarter Ended | Nine Months Ended | |||||||||||
July 27, | July 28, | % | July 27, | July 28, | % | |||||||
Volume (lbs.) | ||||||||||||
Retail | 712,912 | 680,214 | 4.8 | 2,127,075 | 2,170,621 | (2.0) | ||||||
Foodservice | 248,540 | 259,947 | (4.4) | 734,988 | 777,785 | (5.5) | ||||||
International | 85,138 | 78,529 | 8.4 | 239,225 | 231,681 | 3.3 | ||||||
Total Volume (lbs.) | 1,046,590 | 1,018,690 | 2.7 | 3,101,288 | 3,180,087 | (2.5) | ||||||
Net Sales | ||||||||||||
Retail | $ 1,858,434 | $ 1,767,251 | 5.2 | $ 5,532,401 | $ 5,467,078 | 1.2 | ||||||
Foodservice | 986,976 | 954,021 | 3.5 | 2,853,603 | 2,799,110 | 1.9 | ||||||
International | 187,466 | 177,171 | 5.8 | 534,495 | 516,517 | 3.5 | ||||||
Total Net Sales | $ 3,032,876 | $ 2,898,443 | 4.6 | $ 8,920,499 | $ 8,782,706 | 1.6 | ||||||
Segment Profit | ||||||||||||
Retail | $ 122,566 | $ 127,932 | (4.2) | $ 378,847 | $ 409,836 | (7.6) | ||||||
Foodservice | 140,711 | 142,487 | (1.2) | 420,170 | 441,952 | (4.9) | ||||||
International | 18,941 | 21,792 | (13.1) | 58,193 | 65,026 | (10.5) | ||||||
Total Segment Profit | 282,218 | 292,211 | (3.4) | 857,210 | 916,814 | (6.5) | ||||||
Net Unallocated Expense | 45,658 | 66,526 | (31.4) | 171,769 | 161,239 | 6.5 | ||||||
Noncontrolling Interest | (46) | 34 | (234.1) | (366) | (170) | (114.7) | ||||||
Earnings Before | $ 236,514 | $ 225,719 | 4.8 | $ 685,076 | $ 755,404 | (9.3) | ||||||
APPENDIX: NON-GAAP MEASURES
This press release includes measures of financial performance that are not defined by U.S. generally accepted accounting principles (GAAP). The Company utilizes these non-GAAP measures to understand and evaluate operating performance on a consistent basis. These measures may also be used when making decisions regarding resource allocation and in determining incentive compensation. The Company believes these non-GAAP measures provide useful information to investors because they aid analysis and understanding of the Company's results and business trends relative to past performance and the Company's competitors. Non-GAAP measures are not intended to be a substitute for GAAP measures in analyzing financial performance. These non-GAAP measures are not calculated in accordance with GAAP and may be different from non-GAAP measures used by other companies.
Transform and Modernize (T&M) Initiative
In the fourth quarter of fiscal 2023, the Company announced a multi-year T&M initiative. In presenting non-GAAP measures, the Company adjusts for (i.e., excludes) expenses for this initiative that are non-recurring, which are primarily project-based external consulting fees and expenses related to supply chain and portfolio optimization (e.g., asset write-offs, severance, or relocation-related costs). The Company believes that non-recurring costs associated with the T&M initiative are not reflective of the Company's ongoing operating cost structure; therefore, the Company is excluding these discrete costs. The Company does not adjust for (i.e., does not exclude) certain costs related to the T&M initiative that are expected to continue after the project ends, such as software license fees and internal employee expenses, because those costs are considered ongoing in nature as a component of normal operating costs. The Company also does not adjust for savings realized through the T&M initiative as these are considered ongoing in nature and reflective of expected future operating performance.
Loss on Sale of Business
In the first quarter of fiscal 2025, the Company sold Mountain Prairie, LLC, a non-core sow operation, resulting in a loss on the sale. The Company believes the one-time detriment from the sale, including transaction costs, is not reflective of the Company's ongoing operating cost structure, is not indicative of the Company's core operating performance, and is not meaningful when comparing the Company's operating performance against that of prior periods. Thus, the Company has adjusted for (i.e. excluded) the loss.
Legal Matters
From time to time, the Company incurs expenses related to discrete legal matters that the Company believes are not indicative of the Company's core operating performance, do not reflect expected future operating costs, and are not meaningful when comparing the Company's operating performance against that of prior periods. The Company adjusts for (i.e., excludes) these expenses.
Litigation Settlements
In fiscal 2025 and 2024, the Company entered into settlement agreements with certain plaintiffs in its pending antitrust litigation.
Organic Volume and Organic Net Sales
The non-GAAP measures of organic volume and organic net sales are presented to provide investors with additional information to facilitate the comparison of past and present operations. Organic volume and organic net sales exclude the impact of the sale of Hormel Health Labs, LLC in the Foodservice segment in the fourth quarter of fiscal 2024.
The tables below show the calculations to reconcile from the GAAP measures to the non-GAAP measures presented in this press release. The tax impacts were calculated using the effective tax rate for the quarter in which the transactions occurred.
HORMEL FOODS CORPORATION | |||||||
RECONCILIATION OF NON-GAAP MEASURES | |||||||
Unaudited | |||||||
Quarter Ended | Nine Months Ended | ||||||
In thousands, except per share amounts | July 27, | July 28, | July 27, | July 28, | |||
Cost of Products Sold (GAAP) | $ 2,545,567 | $ 2,410,075 | $ 7,473,524 | $ 7,281,798 | |||
Transform and Modernize Initiative(1) | (1,010) | (1,226) | (3,973) | (4,646) | |||
Adjusted Cost of Products Sold (Non-GAAP) | $ 2,544,557 | $ 2,408,848 | $ 7,469,551 | $ 7,277,152 | |||
SG&A (GAAP) | $ 258,713 | $ 259,653 | $ 773,158 | $ 766,707 | |||
Transform and Modernize Initiative(2) | (13,485) | (12,280) | (41,228) | (31,016) | |||
Loss on Sale of Business | — | — | (11,324) | — | |||
Litigation Settlements | — | (17,000) | (240) | (28,750) | |||
Adjusted SG&A (Non-GAAP) | $ 245,228 | $ 230,373 | $ 720,366 | $ 706,941 | |||
Operating Income (GAAP) | $ 239,748 | $ 236,693 | $ 716,430 | $ 773,452 | |||
Transform and Modernize Initiative(1)(2) | 14,496 | 13,506 | 45,202 | 35,663 | |||
Loss on Sale of Business | — | — | 11,324 | — | |||
Litigation Settlements | — | 17,000 | 240 | 28,750 | |||
Adjusted Operating Income (Non-GAAP) | $ 254,244 | $ 267,200 | $ 773,196 | $ 837,864 | |||
Earnings Before Income Taxes (GAAP) | $ 236,514 | $ 225,719 | $ 685,076 | $ 755,404 | |||
Transform and Modernize Initiative(1)(2) | 14,496 | 13,506 | 45,202 | 35,663 | |||
Loss on Sale of Business | — | — | 11,324 | — | |||
Litigation Settlements | — | 17,000 | 240 | 28,750 | |||
Adjusted Earnings Before Income Taxes (Non- | $ 251,010 | $ 256,225 | $ 741,842 | $ 819,816 | |||
Provision for Income Taxes (GAAP) | $ 52,818 | $ 48,984 | $ 151,107 | $ 170,733 | |||
Transform and Modernize Initiative(1)(2) | 3,233 | 2,931 | 9,960 | 8,009 | |||
Loss on Sale of Business | — | — | 2,469 | — | |||
Litigation Settlements | — | 3,689 | 52 | 6,333 | |||
Adjusted Provision for Income Taxes (Non-GAAP) | $ 56,051 | $ 55,603 | $ 163,588 | $ 185,074 | |||
Net Earnings Attributable to Hormel Foods | $ 183,742 | $ 176,701 | $ 534,334 | $ 584,842 | |||
Transform and Modernize Initiative(1)(2) | 11,263 | 10,575 | 35,242 | 27,654 | |||
Loss on Sale of Business | — | — | 8,855 | — | |||
Litigation Settlements | — | 13,311 | 188 | 22,417 | |||
Adjusted Net Earnings Attributable to Hormel | $ 195,005 | $ 200,588 | $ 578,620 | $ 634,913 | |||
Diluted Earnings Per Share (GAAP) | $ 0.33 | $ 0.32 | $ 0.97 | $ 1.07 | |||
Transform and Modernize Initiative(1)(2) | 0.02 | 0.02 | 0.06 | 0.05 | |||
Loss on Sale of Business | — | — | 0.02 | — | |||
Litigation Settlements | — | 0.02 | — | 0.04 | |||
Adjusted Diluted Earnings Per Share (Non-GAAP) | $ 0.35 | $ 0.37 | $ 1.05 | $ 1.16 | |||
SG&A as a Percent of Net Sales (GAAP) | 8.5 % | 9.0 % | 8.7 % | 8.7 % | |||
Transform and Modernize Initiative(2) | (0.4) | (0.4) | (0.5) | (0.4) | |||
Loss on Sale of Business | — | — | (0.1) | — | |||
Litigation Settlements | — | (0.6) | — | (0.3) | |||
Adjusted SG&A as a Percent of Net Sales (Non- | 8.1 % | 7.9 % | 8.1 % | 8.0 % | |||
Operating Margin (GAAP) | 7.9 % | 8.2 % | 8.0 % | 8.8 % | |||
Transform and Modernize Initiative(1)(2) | 0.5 | 0.5 | 0.5 | 0.4 | |||
Loss on Sale of Business | — | — | 0.1 | — | |||
Litigation Settlements | — | 0.6 | — | 0.3 | |||
Adjusted Operating Margin (Non-GAAP) | 8.4 % | 9.2 % | 8.7 % | 9.5 % | |||
(1) | Comprised primarily of equipment relocation expenses, severance, and asset write-offs related to supply chain and portfolio optimization. |
(2) | Comprised primarily of project-based external consulting fees. |
ORGANIC VOLUME AND ORGANIC NET SALES (NON-GAAP) | |||||||
Quarter Ended | |||||||
July 27, 2025 | July 28, 2024 | ||||||
In thousands | GAAP | GAAP | Divestiture | Non-GAAP | Non-GAAP % Change | ||
Volume (lbs.) | |||||||
Retail | 712,912 | 680,214 | — | 680,214 | 4.8 | ||
Foodservice | 248,540 | 259,947 | (16,507) | 243,440 | 2.1 | ||
International | 85,138 | 78,529 | — | 78,529 | 8.4 | ||
Total Volume (lbs.) | 1,046,590 | 1,018,690 | (16,507) | 1,002,183 | 4.4 | ||
Net Sales | |||||||
Retail | $ 1,858,434 | $ 1,767,251 | $ — | $ 1,767,251 | 5.2 | ||
Foodservice | 986,976 | 954,021 | (28,683) | 925,338 | 6.7 | ||
International | 187,466 | 177,171 | — | 177,171 | 5.8 | ||
Total Net Sales | $ 3,032,876 | $ 2,898,443 | $ (28,683) | $ 2,869,760 | 5.7 | ||
Nine Months Ended | |||||||
July 27, 2025 | July 28, 2024 | ||||||
In thousands | GAAP | GAAP | Divestiture | Non-GAAP | Non-GAAP % Change | ||
Volume (lbs.) | |||||||
Retail | 2,127,075 | 2,170,621 | — | 2,170,621 | (2.0) | ||
Foodservice | 734,988 | 777,785 | (49,023) | 728,763 | 0.9 | ||
International | 239,225 | 231,681 | — | 231,681 | 3.3 | ||
Total Volume (lbs.) | 3,101,288 | 3,180,087 | (49,023) | 3,131,065 | (1.0) | ||
Net Sales | |||||||
Retail | $ 5,532,401 | $ 5,467,078 | $ — | $ 5,467,078 | 1.2 | ||
Foodservice | 2,853,603 | 2,799,110 | (83,792) | 2,715,318 | 5.1 | ||
International | 534,495 | 516,517 | — | 516,517 | 3.5 | ||
Total Net Sales | $ 8,920,499 | $ 8,782,706 | $ (83,792) | $ 8,698,914 | 2.5 | ||
Forward-looking GAAP to Non-GAAP Measures
Our fiscal 2025 outlook for adjusted operating income and diluted earnings per share are non-GAAP measures that exclude, or have otherwise been adjusted for, items impacting comparability, including estimated charges associated with the T&M initiative and the loss on the sale of Mountain Prairie, LLC. The Company's strategic investments in the T&M initiative are expected to cease at the end of the investment period. The Company believes the one-time detriment from the sale, including transaction costs, is not reflective of the Company's ongoing operating cost structure. These items are not expected to recur in the foreseeable future and are not considered representative of the Company's underlying operating performance.
The tables below show the calculation to reconcile from the estimated fiscal 2025 GAAP measure to the estimated non-GAAP adjusted measure.
Fiscal 2025 Outlook | |||||||
In millions | Revised | Previous | |||||
Operating Income (GAAP) | $ 982 | - | $ 996 | $ 1,118 | - | $ 1,185 | |
Transform and Modernize Initiative | 61 | - | 63 | 46 | - | 52 | |
Loss on Sale of Business | 11 | - | 11 | 11 | - | 11 | |
Adjusted Operating Income (Non-GAAP) | $ 1,054 | - | $ 1,070 | $ 1,175 | - | $ 1,248 | |
Fiscal 2025 Outlook | |||
Revised | Previous | ||
Diluted Earnings per Share (GAAP) | $1.33 - $1.35 | $1.49 - $1.59 | |
Transform and Modernize Initiative | $0.08 | $0.07 | |
Loss on Sale of Business | $0.02 | $0.02 | |
Adjusted Diluted Earnings per Share (Non-GAAP) | $1.43 - $1.45 | $1.58 - $1.68 | |
INVESTOR CONTACT: | MEDIA CONTACT: |
Jess Blomberg | Media Relations |
SOURCE Hormel Foods Corporation





Share this article