Qualys Announces Third Quarter 2024 Financial Results
Revenue Growth of 8% Year-Over-Year
GAAP EPS: $1.24; Non-GAAP EPS: $1.56
Raises 2024 Revenue Guidance to $602.9-$605.9 million
Raises 2024 GAAP EPS Guidance to $4.31-$4.41
Raises 2024 Non-GAAP EPS Guidance to $5.81-$5.91
FOSTER CITY, Calif., Nov. 5, 2024 /PRNewswire/ -- Qualys, Inc. (NASDAQ: QLYS), a leading provider of disruptive cloud-based IT, security and compliance solutions, today announced financial results for the third quarter ended September 30, 2024. For the quarter, the Company reported revenues of $153.9 million, net income under United States Generally Accepted Accounting Principles ("U.S. GAAP") of $46.2 million, non-GAAP net income of $58.0 million, Adjusted EBITDA of $69.7 million, GAAP net income per diluted share of $1.24, and non-GAAP net income per diluted share of $1.56.
"Q3 was another strong quarter of rapid innovation for Qualys, reflecting our ongoing commitment to technology leadership, cybersecurity transformation, and successful outcomes for customers," said Sumedh Thakar, Qualys' president and CEO. "With the release of several new capabilities, including our Enterprise TruRisk Management solution, TruRisk Eliminate, and Qualys TotalAI we have further strengthened our strategic position as the partner of choice for customers looking to rearchitect and consolidate their security tools to solve modern security challenges while simplifying their operational defenses. We believe we can continue to grow long-term, maintain best-in-class profitability, and invest in key initiatives aimed at further extending the gap between Qualys and the competition."
Third Quarter 2024 Financial Highlights
Revenues: Revenues for the third quarter of 2024 increased by 8% to $153.9 million compared to $142.0 million for the same quarter in 2023.
Gross Profit: GAAP gross profit for the third quarter of 2024 increased by 8% to $125.0 million compared to $115.3 million for the same quarter in 2023. GAAP gross margin was 81% for both the third quarter of 2024 and the same quarter in 2023. Non-GAAP gross profit for the third quarter of 2024 increased by 8% to $127.8 million compared to $118.0 million for the same quarter in 2023. Non-GAAP gross margin was 83% for both the third quarter of 2024 and the same quarter in 2023.
Operating Income: GAAP operating income for the third quarter of 2024 increased by 3% to $45.0 million compared to $43.6 million for the same quarter in 2023. As a percentage of revenues, GAAP operating income was 29% for the third quarter of 2024 compared to 31% for the same quarter in 2023. Non-GAAP operating income for the third quarter of 2024 increased by 5% to $66.0 million compared to $62.9 million for the same quarter in 2023. As a percentage of revenues, non-GAAP operating income was 43% for the third quarter of 2024 compared to 44% for the same quarter in 2023.
Net Income: GAAP net income for the third quarter of 2024 decreased by 1% to $46.2 million, or $1.24 per diluted share, compared to $46.5 million, or $1.24 per diluted share, for the same quarter in 2023. As a percentage of revenues, GAAP net income was 30% for the third quarter of 2024 compared to 33% for the same quarter in 2023. Non-GAAP net income for the third quarter of 2024 was $58.0 million, or $1.56 per diluted share, compared to $56.7 million, or $1.51 per diluted share, for the same quarter in 2023. As a percentage of revenues, non-GAAP net income was 38% for the third quarter of 2024 compared to 40% for the same quarter in 2023.
Adjusted EBITDA: Adjusted EBITDA (a non-GAAP financial measure) for the third quarter of 2024 increased by 1% to $69.7 million compared to $68.8 million for the same quarter in 2023. As a percentage of revenues, Adjusted EBITDA was 45% for the third quarter of 2024 compared to 48% for the same quarter in 2023.
Operating Cash Flow: Operating cash flow for the third quarter of 2024 decreased by 34% to $61.0 million compared to $92.4 million for the same quarter in 2023. As a percentage of revenues, operating cash flow was 40% for the third quarter of 2024 compared to 65% for the same quarter in 2023.
Third Quarter 2024 Business Highlights
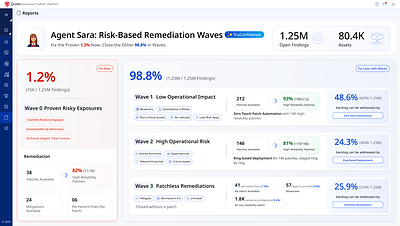
- Launched Qualys' TruRisk Eliminate, a remediation solution extending beyond patching by providing patchless patching, targeted isolation, and other mitigation strategies to help organizations reduce risk.
- Expanded our portfolio by introducing Qualys TotalAI, designed to address the growing challenges and risks of securing generative AI and large language model (LLM) applications to detect data leaks, injection issues, and model theft.
- The 2024 GigaOm Radar Report for Continuous Vulnerability Management ranked Qualys' VMDR as a leading vulnerability management solution for the fourth straight year. It noted VMDR stands apart from the competition as a "comprehensive risk-based approach to vulnerability management."
- Gartner recognized TotalCloud among solutions named in its July 2024 Marketguide for Cloud Native Application Protection Platforms.
- Qualys' CyberSecurity Asset Management ranked as a strong performer among top vendors in the Forrester Wave for Attack Surface Management in its debut in the report.
- Introduced updates to our Web Application Security solution including context-aware TruRisk prioritization, advanced API security features, and a redesigned user interface offering guided workflows and feedback loops. These updates address the growing complexity of securing web applications and APIs in digital environments.
Financial Performance Outlook
Based on information as of today, November 5, 2024, Qualys is issuing the following financial guidance for the fourth quarter and full year fiscal 2024. The Company emphasizes that the guidance is subject to various important cautionary factors referenced in the sections entitled "Legal Notice Regarding Forward-Looking Statements" and "Non-GAAP Financial Measures" below.
Fourth Quarter 2024 Guidance: Management expects revenues for the fourth quarter of 2024 to be in the range of $154.5 million to $157.5 million, representing 7% to 9% growth over the same quarter in 2023. GAAP net income per diluted share is expected to be in the range of $0.84 to $0.94, which assumes an effective income tax rate of 21%. Non-GAAP net income per diluted share is expected to be in the range of $1.28 to $1.38, which assumes a non-GAAP effective income tax rate of 21%. Fourth quarter 2024 net income per diluted share estimates are based on approximately 36.9 million weighted average diluted shares outstanding for the quarter.
Full Year 2024 Guidance: Management now expects revenues for the full year of 2024 to be in the range of $602.9 million to $605.9 million, representing 9% growth over 2023. This compares to the previous guidance range of $597.5 million to $601.5 million. GAAP net income per diluted share is expected to be in the range of $4.31 to $4.41, up from the previous guidance range of $3.85 to $4.01. This assumes an effective income tax rate of 18%. Non-GAAP net income per diluted share is expected to be in the range of $5.81 to $5.91, up from the previous guidance range of $5.46 to $5.62. This assumes a non-GAAP effective income tax rate of 21%. Full year 2024 net income per diluted share estimates are based on approximately 37.4 million weighted average diluted shares outstanding.
Qualys has not reconciled non-GAAP net income per diluted share guidance to GAAP net income per diluted share guidance because Qualys does not provide guidance on the various reconciling cash and non-cash items between GAAP net income and non-GAAP net income (i.e., stock-based compensation, amortization of intangible assets from acquisitions and non-recurring items). The actual dollar amount of reconciling items in the fourth quarter and full year 2024 is likely to have a significant impact on the Company's GAAP net income per diluted share in the fourth quarter and full year 2024. A reconciliation of the non-GAAP net income per diluted share guidance to the GAAP net income per diluted share guidance is not available without unreasonable effort.
Investor Conference Call
Qualys will host a conference call and live webcast to discuss its third quarter financial results at 5:00 p.m. Eastern Time (2:00 p.m. Pacific Time) on Tuesday, November 5, 2024. To access the conference call by phone, please register here. A live webcast of the earnings conference call, investor presentation and prepared remarks can be accessed at https://investor.qualys.com/events-presentations. A replay of the conference call will be available through the same webcast link following the end of the call.
Investor Contact
Blair King
Vice President, Investor Relations and Corporate Development
(650) 538-2088
ir@qualys.com
About Qualys
Qualys, Inc. (NASDAQ: QLYS) is a leading provider of disruptive cloud-based Security, Compliance and IT solutions with more than 10,000 subscription customers worldwide, including a majority of the Forbes Global 100 and Fortune 100. Qualys helps organizations streamline and consolidate their security and compliance solutions onto a single platform for greater agility, better business outcomes, and substantial cost savings.
The Qualys Enterprise TruRisk Platform leverages a single agent to continuously deliver critical security intelligence while enabling enterprises to automate the full spectrum of vulnerability detection, compliance, and protection for IT systems, workloads and web applications across on premises, endpoints, servers, public and private clouds, containers, and mobile devices. Founded in 1999 as one of the first SaaS security companies, Qualys has strategic partnerships and seamlessly integrates its vulnerability management capabilities into security offerings from cloud service providers, including Amazon Web Services, the Google Cloud Platform and Microsoft Azure, along with a number of leading managed service providers and global consulting organizations. For more information, please visit www.qualys.com.
Qualys, Qualys VMDR® and the Qualys logo are proprietary trademarks of Qualys, Inc. All other products or names may be trademarks of their respective companies.
Legal Notice Regarding Forward-Looking Statements
This press release contains forward-looking statements within the meaning of Section 27A of the Securities Act of 1933 and Section 21E of the Securities Exchange Act of 1934. Forward-looking statements generally relate to future events or our future financial or operating performance. Forward-looking statements in this press release include, but are not limited to, quotations of management and statements related to: the benefits of our existing, new and upcoming products, features, integrations, acquisitions, collaborations and joint solutions, and their impact upon our long-term growth; our ability to advance our value proposition and competitive differentiation in the market; our ability to address demand trends; our ability to maintain and strengthen our category leadership; our ability to solve modern security challenges at scale; our strategies and ability to achieve and maintain durable profitable growth; our guidance for revenues, GAAP EPS and non-GAAP EPS for the fourth quarter and full year 2024; and our expectations for the number of weighted average diluted shares outstanding and the GAAP and non-GAAP effective income tax rate for the fourth quarter and full year 2024. Our expectations and beliefs regarding these matters may not materialize, and actual results in future periods are subject to risks and uncertainties that could cause actual results to differ materially from those projected. These risks include our ability to continue to develop platform capabilities and solutions; the ability of our platform and solutions to perform as intended; customer acceptance and purchase of our existing solutions and new solutions; real or perceived defects, errors or vulnerabilities in our products or services; our ability to retain existing customers and generate new customers; the budgeting cycles and seasonal buying patterns of our customers; general market, political, economic and business conditions in the United States as well as globally; our ability to manage costs as we increase our customer base and the number of our platform solutions; the market for cloud solutions for IT security and compliance not increasing at the rate we expect; competition from other products and services; fluctuations in currency exchange rates; unexpected fluctuations in our effective income tax rate on a GAAP and non-GAAP basis; our ability to effectively manage our rapid growth and our ability to anticipate future market needs and opportunities; and any unanticipated accounting charges. The forward-looking statements contained in this press release are also subject to other risks and uncertainties, including those more fully described in our filings with the Securities and Exchange Commission, including our Annual Report on Form 10-K and Quarterly Reports on Form 10-Q.
The forward-looking statements in this press release are based on information available to Qualys as of the date hereof, and Qualys disclaims any obligation to update any forward-looking statements, except as required by law.
Non-GAAP Financial Measures
In addition to reporting financial results in accordance with GAAP, Qualys provides investors with certain non-GAAP financial measures, including non-GAAP gross profit, non-GAAP gross margin, non-GAAP operating expenses, non-GAAP operating income, non-GAAP net income, non-GAAP net income per diluted share, Adjusted EBITDA (defined as earnings before interest expense, interest income and other income (expense), net, income taxes, depreciation, amortization, and stock-based compensation) and non-GAAP free cash flows (defined as cash provided by operating activities less purchases of property and equipment, net of proceeds from disposal).
In computing non-GAAP financial measures, Qualys excludes the effects of stock-based compensation expense, amortization of intangible assets from acquisitions, non-recurring items and for non-GAAP net income, certain tax effects. Qualys believes that these non-GAAP financial measures help illustrate underlying trends in its business that could otherwise be masked by the effect of the income or expenses that are excluded in non-GAAP gross profit, non-GAAP gross margin, non-GAAP operating expenses, non-GAAP operating income, non-GAAP net income, non-GAAP net income per diluted share, Adjusted EBITDA and non-GAAP free cash flows.
Furthermore, Qualys uses some of these non-GAAP financial measures to establish budgets and operational goals for managing its business and evaluating its performance. Qualys believes that non-GAAP gross profit, non-GAAP gross margin, non-GAAP operating expenses, non-GAAP operating income, non-GAAP net income, non-GAAP net income per diluted share, Adjusted EBITDA and non-GAAP free cash flows provide additional tools for investors to use in comparing its recurring core business operating results over multiple periods with other companies in its industry.
Although Qualys does not focus on or use quarterly billings in managing or monitoring the performance of its business, Qualys provides calculated current billings (defined as total revenues recognized in a period plus the sequential change in current deferred revenue in the corresponding period) for the convenience of investors and analysts in building their own financial models.
In order to provide a more complete picture of recurring core operating business results, the Company's non-GAAP net income and non-GAAP net income per diluted share include adjustments for non-recurring income tax items and certain tax effects of non-GAAP adjustments to achieve the effective income tax rate on a non-GAAP basis. The Company's non-GAAP effective tax rate may differ from the GAAP effective income tax rate as a result of these income tax adjustments. The Company believes its estimated non-GAAP effective income tax rate of 21% in 2024 is a reasonable estimate under its current global operating structure and core business operations. The Company may adjust this rate during the year to take into account events or trends that it believes materially impact the estimated annual rate. The non-GAAP effective income tax rate could be subject to change for a number of reasons, including but not limited to, significant changes resulting from tax legislation, material changes in geographic mix of revenues and expenses and other significant events.
The presentation of this non-GAAP financial information is not intended to be considered in isolation or as a substitute for results prepared in accordance with GAAP. A reconciliation of the non-GAAP financial measures discussed in this press release to the most directly comparable GAAP financial measures is included with the financial statements contained in this press release. Management uses both GAAP and non-GAAP information in evaluating and operating its business internally and as such has determined that it is important to provide this information to investors.
Qualys, Inc. CONDENSED CONSOLIDATED STATEMENTS OF OPERATIONS (unaudited) (in thousands, except per share data) | |||||||
Three Months Ended | Nine Months Ended | ||||||
2024 | 2023 | 2024 | 2023 | ||||
Revenues | $ 153,867 | $ 141,996 | $ 448,380 | $ 409,888 | |||
Cost of revenues (1) | 28,832 | 26,739 | 82,445 | 80,355 | |||
Gross profit | 125,035 | 115,257 | 365,935 | 329,533 | |||
Operating expenses: | |||||||
Research and development (1) | 28,901 | 27,782 | 83,550 | 83,001 | |||
Sales and marketing (1) | 32,686 | 27,881 | 94,240 | 79,750 | |||
General and administrative (1) | 18,494 | 15,999 | 50,362 | 45,182 | |||
Total operating expenses | 80,081 | 71,662 | 228,152 | 207,933 | |||
Income from operations | 44,954 | 43,595 | 137,783 | 121,600 | |||
Other income (expense), net: | |||||||
Interest income | 6,764 | 5,136 | 19,590 | 11,342 | |||
Other income (expense), net | 605 | (708) | (1,381) | (1,883) | |||
Total other income, net | 7,369 | 4,428 | 18,209 | 9,459 | |||
Income before income taxes | 52,323 | 48,023 | 155,992 | 131,059 | |||
Income tax provision | 6,111 | 1,508 | 26,277 | 20,057 | |||
Net income | $ 46,212 | $ 46,515 | $ 129,715 | $ 111,002 | |||
Net income per share: | |||||||
Basic | $ 1.26 | $ 1.27 | $ 3.52 | $ 3.01 | |||
Diluted | $ 1.24 | $ 1.24 | $ 3.46 | $ 2.96 | |||
Weighted average shares used in computing net income per share: | |||||||
Basic | 36,762 | 36,766 | 36,877 | 36,891 | |||
Diluted | 37,136 | 37,448 | 37,441 | 37,516 | |||
(1) Includes stock-based compensation as follows: | |||||||
Cost of revenues | $ 2,081 | $ 1,946 | $ 5,967 | $ 5,255 | |||
Research and development | 5,448 | 5,671 | 15,911 | 15,734 | |||
Sales and marketing | 3,649 | 3,229 | 11,020 | 8,580 | |||
General and administrative | 9,159 | 7,676 | 23,556 | 20,991 | |||
Total stock-based compensation, net of amounts capitalized | $ 20,337 | $ 18,522 | $ 56,454 | $ 50,560 | |||
Qualys, Inc. CONDENSED CONSOLIDATED BALANCE SHEETS (unaudited) (in thousands) | |||
September 30, | December 31, | ||
Assets | |||
Current assets: | |||
Cash and cash equivalents | $ 235,430 | $ 203,665 | |
Restricted cash | — | 1,500 | |
Short-term marketable securities | 150,913 | 221,893 | |
Accounts receivable, net | 114,967 | 146,226 | |
Prepaid expenses and other current assets | 35,307 | 26,714 | |
Total current assets | 536,617 | 599,998 | |
Long-term marketable securities | 186,680 | 56,644 | |
Property and equipment, net | 27,343 | 32,599 | |
Operating leases - right of use asset | 41,294 | 22,391 | |
Deferred tax assets, net | 77,730 | 62,761 | |
Intangible assets, net | 7,451 | 9,715 | |
Goodwill | 7,447 | 7,447 | |
Noncurrent restricted cash | 1,200 | 1,200 | |
Other noncurrent assets | 22,561 | 19,863 | |
Total assets | $ 908,323 | $ 812,618 | |
Liabilities and Stockholders' Equity | |||
Current liabilities: | |||
Accounts payable | $ 1,422 | $ 988 | |
Accrued liabilities | 39,960 | 43,096 | |
Deferred revenues, current | 337,821 | 333,267 | |
Operating lease liabilities, current | 9,333 | 11,857 | |
Total current liabilities | 388,536 | 389,208 | |
Deferred revenues, noncurrent | 23,116 | 31,671 | |
Operating lease liabilities, noncurrent | 38,266 | 16,885 | |
Other noncurrent liabilities | 8,810 | 6,680 | |
Total liabilities | 458,728 | 444,444 | |
Stockholders' equity: | |||
Common stock | 37 | 37 | |
Additional paid-in capital | 642,435 | 597,921 | |
Accumulated other comprehensive loss | (293) | (1,704) | |
Accumulated deficit | (192,584) | (228,080) | |
Total stockholders' equity | 449,595 | 368,174 | |
Total liabilities and stockholders' equity | $ 908,323 | $ 812,618 | |
Qualys, Inc. CONDENSED CONSOLIDATED STATEMENTS OF CASH FLOWS (unaudited) (in thousands) | |||
Nine Months Ended | |||
2024 | 2023 | ||
Cash flow from operating activities: | |||
Net income | $ 129,715 | $ 111,002 | |
Adjustments to reconcile net income to net cash provided by operating activities: | |||
Depreciation and amortization expense | 14,410 | 21,140 | |
Provision for credit losses | 411 | 230 | |
Loss on non-marketable securities | — | 533 | |
Stock-based compensation, net of amounts capitalized | 56,454 | 50,560 | |
Accretion of discount on marketable securities, net | (5,231) | (3,502) | |
Deferred income taxes | (15,374) | (11,561) | |
Changes in operating assets and liabilities: | |||
Accounts receivable | 30,848 | 18,137 | |
Prepaid expenses and other assets | (9,900) | (4,804) | |
Accounts payable | 391 | (1,428) | |
Accrued liabilities and other noncurrent liabilities | (1,351) | 8,211 | |
Deferred revenues | (4,001) | 22,248 | |
Net cash provided by operating activities | 196,372 | 210,766 | |
Cash flow from investing activities: | |||
Purchases of marketable securities | (305,952) | (252,438) | |
Sales and maturities of marketable securities | 252,940 | 212,202 | |
Purchases of property and equipment | (6,497) | (7,263) | |
Net cash used in investing activities | (59,509) | (47,499) | |
Cash flow from financing activities: | |||
Repurchase of common stock | (97,188) | (147,725) | |
Proceeds from exercise of stock options | 8,311 | 28,384 | |
Payments for taxes related to net share settlement of equity awards | (23,093) | (14,998) | |
Proceeds from issuance of common stock through employee stock purchase plan | 6,872 | 6,077 | |
Payment of acquisition-related holdback | (1,500) | — | |
Net cash used in financing activities | (106,598) | (128,262) | |
Net increase in cash, cash equivalents and restricted cash | 30,265 | 35,005 | |
Cash, cash equivalents and restricted cash at beginning of period | 206,365 | 176,419 | |
Cash, cash equivalents and restricted cash at end of period | $ 236,630 | $ 211,424 | |
Qualys, Inc. RECONCILIATION OF NON-GAAP DISCLOSURES ADJUSTED EBITDA (unaudited) (in thousands, except percentages) | |||||||
Three Months Ended | Nine Months Ended | ||||||
2024 | 2023 | 2024 | 2023 | ||||
Net income | $ 46,212 | $ 46,515 | $ 129,715 | $ 111,002 | |||
Net income as a percentage of revenues | 30 % | 33 % | 29 % | 27 % | |||
Depreciation and amortization of property and equipment | 3,670 | 5,922 | 12,146 | 18,824 | |||
Amortization of intangible assets | 721 | 772 | 2,264 | 2,316 | |||
Income tax provision | 6,111 | 1,508 | 26,277 | 20,057 | |||
Stock-based compensation | 20,337 | 18,522 | 56,454 | 50,560 | |||
Total other income, net | (7,369) | (4,428) | (18,209) | (9,459) | |||
Adjusted EBITDA | $ 69,682 | $ 68,811 | $ 208,647 | $ 193,300 | |||
Adjusted EBITDA as a percentage of revenues | 45 % | 48 % | 47 % | 47 % | |||
Qualys, Inc. RECONCILIATION OF NON-GAAP DISCLOSURES (unaudited) (in thousands, except per share data) | |||||||
Three Months Ended | Nine Months Ended | ||||||
2024 | 2023 | 2024 | 2023 | ||||
GAAP Cost of revenues | $ 28,832 | $ 26,739 | $ 82,445 | $ 80,355 | |||
Less: Stock-based compensation | (2,081) | (1,946) | (5,967) | (5,255) | |||
Less: Amortization of intangible assets | (705) | (747) | (2,198) | (2,241) | |||
Non-GAAP Cost of revenues | $ 26,046 | $ 24,046 | $ 74,280 | $ 72,859 | |||
GAAP Gross profit | $ 125,035 | $ 115,257 | $ 365,935 | $ 329,533 | |||
Plus: Stock-based compensation | 2,081 | 1,946 | 5,967 | 5,255 | |||
Plus: Amortization of intangible assets | 705 | 747 | 2,198 | 2,241 | |||
Non-GAAP Gross Profit | $ 127,821 | $ 117,950 | $ 374,100 | $ 337,029 | |||
GAAP Research and development | $ 28,901 | $ 27,782 | $ 83,550 | $ 83,001 | |||
Less: Stock-based compensation | (5,448) | (5,671) | (15,911) | (15,734) | |||
Less: Amortization of intangible assets | (16) | (25) | (66) | (75) | |||
Non-GAAP Research and development | $ 23,437 | $ 22,086 | $ 67,573 | $ 67,192 | |||
GAAP Sales and marketing | $ 32,686 | $ 27,881 | $ 94,240 | $ 79,750 | |||
Less: Stock-based compensation | (3,649) | (3,229) | (11,020) | (8,580) | |||
Non-GAAP Sales and marketing | $ 29,037 | $ 24,652 | $ 83,220 | $ 71,170 | |||
GAAP General and administrative | $ 18,494 | $ 15,999 | $ 50,362 | $ 45,182 | |||
Less: Stock-based compensation | (9,159) | (7,676) | (23,556) | (20,991) | |||
Non-GAAP General and administrative | $ 9,335 | $ 8,323 | $ 26,806 | $ 24,191 | |||
GAAP Operating expenses | $ 80,081 | $ 71,662 | $ 228,152 | $ 207,933 | |||
Less: Stock-based compensation | (18,256) | (16,576) | (50,487) | (45,305) | |||
Less: Amortization of intangible assets | (16) | (25) | (66) | (75) | |||
Non-GAAP Operating expenses | $ 61,809 | $ 55,061 | $ 177,599 | $ 162,553 | |||
GAAP Income from operations | $ 44,954 | $ 43,595 | $ 137,783 | $ 121,600 | |||
Plus: Stock-based compensation | 20,337 | 18,522 | 56,454 | 50,560 | |||
Plus: Amortization of intangible assets | 721 | 772 | 2,264 | 2,316 | |||
Non-GAAP Income from operations | $ 66,012 | $ 62,889 | $ 196,501 | $ 174,476 | |||
GAAP Net income | $ 46,212 | $ 46,515 | $ 129,715 | $ 111,002 | |||
Plus: Stock-based compensation | 20,337 | 18,522 | 56,454 | 50,560 | |||
Plus: Amortization of intangible assets | 721 | 772 | 2,264 | 2,316 | |||
Less: Tax adjustment | (9,299) | (9,129) | (18,812) | (18,569) | |||
Non-GAAP Net income | $ 57,971 | $ 56,680 | $ 169,621 | $ 145,309 | |||
GAAP Net income per share: | |||||||
Basic | $ 1.26 | $ 1.27 | $ 3.52 | $ 3.01 | |||
Diluted | $ 1.24 | $ 1.24 | $ 3.46 | $ 2.96 | |||
Non-GAAP Net income per share: | |||||||
Basic | $ 1.58 | $ 1.54 | $ 4.60 | $ 3.94 | |||
Diluted | $ 1.56 | $ 1.51 | $ 4.53 | $ 3.87 | |||
Weighted average shares used in GAAP and non-GAAP net income per share: | |||||||
Basic | 36,762 | 36,766 | 36,877 | 36,891 | |||
Diluted | 37,136 | 37,448 | 37,441 | 37,516 | |||
Qualys, Inc. RECONCILIATION OF NON-GAAP DISCLOSURES FREE CASH FLOWS (unaudited) (in thousands) | |||
Nine Months Ended | |||
2024 | 2023 | ||
GAAP Cash flows provided by operating activities | $ 196,372 | $ 210,766 | |
Less: | |||
Purchases of property and equipment, net of proceeds from disposal | (6,497) | (7,263) | |
Non-GAAP Free cash flows | $ 189,875 | $ 203,503 | |
Qualys, Inc. RECONCILIATION OF NON-GAAP DISCLOSURES CALCULATED CURRENT BILLINGS (unaudited) (in thousands, except percentages) | |||
Three Months Ended | |||
2024 | 2023 | ||
GAAP Revenue | $ 153,867 | $ 141,996 | |
GAAP Revenue growth compared to same quarter of prior year | 8 % | 13 % | |
Plus: Current deferred revenue at September 30 | 337,821 | 307,179 | |
Less: Current deferred revenue at June 30 | (324,334) | (302,446) | |
Non-GAAP Calculated current billings | $ 167,354 | $ 146,729 | |
Calculated current billings growth compared to same quarter of prior year | 14 % | 14 % | |
SOURCE Qualys, Inc.






Share this article