


Equinix Reports Second-Quarter Results, Raises 2026 Guidance and Long-Term Outlook
- Grew monthly recurring revenue 11% on both an as-reported basis and a normalized and constant currency basis year over year
- Annualized gross bookings grew 23% year over year, marking the second-highest volume on record, contributing to a record backlog
- Added a record 9,700 net interconnections in the quarter, continuing to extend the company's interconnection leadership
- Raising full-year 2026 guidance and long-term outlook on stronger demand, bookings, presales and continued execution across the business
REDWOOD CITY, Calif., July 29, 2026 /PRNewswire/ -- Equinix, Inc. (Nasdaq: EQIX), the world's digital infrastructure company®, today reported results for the quarter ended June 30, 2026.
"We delivered an exceptionally strong Q2. Monthly recurring revenue grew double digits for the third straight quarter, new interconnections on our platform hit a record level, and disciplined execution drove robust profit growth," said Adaire Fox-Martin, CEO and President, Equinix. "Our revised 2026 guidance and long-term financial outlook reflect momentum across the business. Customer demand is broad-based and growing, and Equinix is uniquely positioned to serve the networking, cloud and AI infrastructure needs of enterprises around the world."
Second-Quarter 2026 Results Summary
- Revenues
- $2.625 billion, a 16% increase over the same quarter of the previous year on both an as-reported basis and a normalized and constant currency basis driven by strong underlying performance and one-time xScale® fees
- Operating Income
- $665 million, a 35% increase over the same quarter of the previous year, primarily from strong underlying operating performance and the impact of one-time xScale fees
- Net Income Attributable to Common Stockholders and Net Income per Share Attributable to Common Stockholders
- $479 million, a 30% increase over the same quarter of the previous year, primarily from higher operating income
- $4.83 per share, a 29% increase over the same quarter of the previous year
- Adjusted EBITDA
- $1.396 billion, a record adjusted EBITDA margin of 53%, representing a 24% increase over the same quarter of the previous year on an as-reported basis, or a 22% increase on a normalized and constant currency basis
- AFFO and AFFO per Share
- $1.168 billion, a 20% increase over the same quarter of the previous year on an as-reported basis, or a 19% increase on a normalized and constant currency basis driven by strong operating performance and one-time xScale fees
- $11.78 per share, a 19% increase over the same quarter of the previous year on an as-reported basis, or an 18% increase on a normalized and constant currency basis
Equinix uses certain non-GAAP financial measures, which are described further below and reconciled to the most comparable GAAP financial measures after the presentation of our GAAP financial statements.
Equinix does not provide forward-looking guidance for certain financial data, such as depreciation, amortization, accretion, stock-based compensation and other components of net income or loss from operations, and as a result, is not able to provide a reconciliation of GAAP to non-GAAP financial measures for forward-looking data without unreasonable effort. The impact of such adjustments could be significant. Equinix intends to calculate the various non-GAAP financial measures in future periods consistent with how they were calculated for the periods presented within this press release.
All per-share results are presented on a fully diluted basis.
2026 Guidance Summary
($ in millions, except per share data) |
Prior FY 2026 |
Guidance |
Foreign |
Revised FY 2026 |
Q3 2026 |
Revenues |
$10,144 - 10,244 |
+$100 |
($49) |
$10,205 - 10,285 |
$2,525 - 2,575 |
Adjusted EBITDA Adjusted EBITDA Margin % |
$5,165 - 5,245 ~51% |
+$62 |
($27) |
$5,210 - 5,270 ~51% |
$1,275 - 1,315 ~51% |
Recurring Capital Expenditures % of Revenues |
$280 - 300 ~3% |
+$13 |
($3) |
$290 - 310 ~3% |
$70 - 90 3 - 4% |
Non-recurring Capital Expenditures (Excludes xScale and Real Estate Acquisitions) |
~$3,800 |
+$1,438 |
($38) |
$4,710 - 5,690 |
|
AFFO |
$4,198 - 4,278 |
+$50 |
($18) |
$4,240 - 4,300 |
|
AFFO per Share (Diluted) |
$42.31 - 43.11 |
+$0.46 |
($0.18) |
$42.69 - 43.29 |
|
Expected Cash Dividends |
~$2,037 |
+$2 |
$0 |
~$2,039 |
For the third quarter of 2026, the company expects revenues to range between $2.525 and $2.575 billion, an increase of 9 - 11% over the previous year on an as-reported basis, or 10 - 12% on a normalized and constant currency basis. Adjusted EBITDA is expected to range between $1.275 and $1.315 billion, reflecting an adjusted EBITDA margin of approximately 51%.
For the full year of 2026, total revenues are expected to range between $10.205 and $10.285 billion, an increase of approximately 11 - 12% over the previous year on both an as-reported and a normalized and constant currency basis. Adjusted EBITDA is expected to range between $5.210 and $5.270 billion, reflecting an adjusted EBITDA margin of approximately 51%, an approximate +2% expansion over the previous year. AFFO is expected to range between $4.240 and $4.300 billion, an increase of 13 - 14% over the previous year on an as-reported basis, or 12 - 13% on a normalized and constant currency basis. AFFO per share is expected to range between $42.69 and $43.29, an increase of 11 - 13% over the previous year on an as-reported basis, or 10 - 12% on a normalized and constant currency basis. Total capital expenditures are expected to range between $5.000 and $6.000 billion.
Long-Term Outlook Summary (2027-2029)
The updated outlook reflects stronger-than-expected demand, accelerating bookings and presales activity, increased visibility from committed capacity, firm pricing and continued confidence in achieving attractive returns on invested capital.
($ in millions) |
Prior Outlook (1) |
Updated Outlook (2027 - 2029) |
Total Revenue Growth (Annual Range) (2) |
7 - 10% |
10 - 13% |
Adjusted EBITDA Margin (In 2029) |
52%+ |
53%+ |
Total Capital Expenditures (Annual Range) (3) |
$3,000 - 4,000 |
$5,000 - 7,000 |
AFFO per Share Growth (Annual Range) |
5 - 9% |
9 - 12% |
Dividend per Share Growth (Annual Range) |
8%+ |
Approximates AFFO |
(1) |
Prior outlook as provided on Wednesday, June 25, 2025. |
(2) |
Represents range of estimated annual growth rates through 2029. Assumes average currency rates used in our financial results remained the same over comparative periods. Excludes any future M&A activity. |
(3) |
Capital expenditures exclude any future M&A activity, real estate acquisitions and our investments in the xScale joint ventures. |
Q2 2026 Business Highlights
- Delivered $424 million of annualized gross bookings.
- Added a record 9,700 net interconnections.
- Announced the global expansion of Equinix Fabric Geo Zones, the industry's first network-level data sovereignty solution.
- Expanded collaboration with Cisco and NVIDIA to help enterprises accelerate AI deployment through standardized AI factory architectures, secure infrastructure and real-world testing environments across Equinix's global data center footprint.
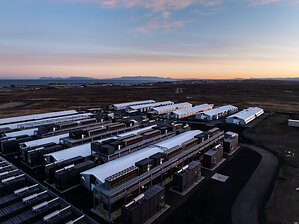
- Accelerated capacity expansion to meet growing customer demand, with nine new projects added since April and 52 projects underway across 33 markets worldwide.
- Published U.S. Community Principles and signed the Ratepayer Protection Pledge, reinforcing the company's longtime commitment to investing in communities in ways that address their needs and create lasting value.
- Further strengthened leadership team with the appointment of Chris Audie as Chief Product Officer and Bruce Owen as Executive Vice President, Global Markets.
- Ranked #1 for Innovation in The Wall Street Journal's inaugural Best Companies for the Future, underscoring the company's strong positioning for long-term success in an AI-driven economy.
Q2 2026 Results Conference Call and Replay Information
Equinix will discuss its quarterly results for the period ended June 30, 2026, along with its future outlook, in its quarterly conference call on Wednesday, July 29, 2026, at 5:30 p.m. ET (2:30 p.m. PT). A simultaneous live webcast of the call will be available on the company's Investor Relations website at www.equinix.com/investors. To hear the conference call live, please dial 1-517-308-9482 (domestic and international) and reference the passcode EQIX.
A replay of the call will be available one hour after the call through Wednesday, September 30, 2026, by dialing 1-866-427-6395 and referencing the passcode 2026. In addition, the webcast will be available at www.equinix.com/investors (no password required).
Investor Presentation and Supplemental Financial Information
Equinix has made available on its website a presentation designed to accompany the discussion of Equinix's results and future outlook, along with certain supplemental financial information and other data. Interested parties may access this information through the Equinix Investor Relations website at www.equinix.com/investors.
Additional Resources
About Equinix
Equinix, Inc. (Nasdaq: EQIX) shortens the path to boundless connectivity anywhere in the world. Its digital infrastructure, data center footprint and interconnected ecosystems empower innovations that enhance our work, life and planet. Equinix connects economies, countries, organizations and communities, delivering seamless digital experiences and cutting-edge AI—quickly, efficiently and everywhere.
Non-GAAP Financial Measures
Equinix provides all information required in accordance with generally accepted accounting principles ("GAAP"), but it believes that evaluating its ongoing results of operations may be difficult if limited to reviewing only GAAP financial measures. Accordingly, Equinix also uses non-GAAP financial measures to evaluate its operations.
Non-GAAP financial measures are not a substitute for financial information prepared in accordance with GAAP. Non-GAAP financial measures should not be considered in isolation, but should be considered together with the most directly comparable GAAP financial measures. As such, Equinix provides a reconciliation of the non-GAAP financial measures to the most directly comparable GAAP financial measures.
Investors should note that the non-GAAP financial measures used by Equinix may not be the same non-GAAP financial measures, and may not be calculated in the same manner, as those of other companies. Investors should therefore exercise caution when comparing non-GAAP financial measures used by Equinix to similarly titled non-GAAP financial measures of other companies.
Equinix's primary non-GAAP financial measures include Adjusted EBITDA and Adjusted Funds from Operations ("AFFO") as described below. Equinix presents these measures to provide investors with additional tools to evaluate its results in a manner that focuses on what management believes to be its core, ongoing business operations. These measures exclude items which Equinix believes are generally not relevant to assessing its long-term performance. Both measures eliminate the impacts of depreciation and amortization, which are derived from historical costs and which Equinix believes are not indicative of current or future expenditures, and other items for which the frequency and amount of charges can vary based on the timing and significance of individual transactions. Equinix believes that presenting these non-GAAP financial measures provides consistency and comparability with past reports and that if it did not provide such non-GAAP financial information, investors would not have all the necessary data to analyze the company effectively.
Adjusted EBITDA is used by management to evaluate the operating strength and performance of its core, ongoing business, without regard to its capital or tax structures. It also aids in assessing the performance of, making operating decisions for, and allocating resources to its operating segments. In addition to the uses described above, Equinix believes this measure provides investors with a better understanding of the operating performance of the business and its ability to perform in subsequent periods.
Equinix defines adjusted EBITDA as net income excluding:
- income tax expense
- interest income
- interest expense
- other income or expense
- gain or loss on debt extinguishment
- depreciation, amortization and accretion expense
- stock-based compensation expense
- restructuring and other exit charges, which primarily include employee severance, facility closure costs, lease or other contract termination costs and advisory fees related to the realignment of our management structure, operations or products and other exit activities
- impairment charges
- transaction costs
- gain or loss on asset sales
AFFO is derived from Funds from Operations ("FFO") calculated in accordance with the standards established by the National Association of Real Estate Investment Trusts. Both FFO and AFFO are non-GAAP measures commonly used in the REIT industry. Although these measures may not be directly comparable to similar measures used by other companies, Equinix believes that the presentation of these measures provides investors with an additional tool for comparing its performance with the performance of other companies in the REIT industry. Additionally, AFFO is a performance measure used in certain of the company's employee incentive programs, and Equinix believes it is a useful measure in assessing its dividend-paying capacity, as it isolates the cash impact of certain income and expense items and considers the impact of recurring capital expenditures.
Equinix defines FFO as net income attributable to common stockholders excluding:
- gain or loss from the disposition of real estate assets
- depreciation and amortization expense on real estate assets
- adjustments related to unconsolidated joint ventures and non-controlling interests
Equinix defines AFFO as FFO adjusted for:
- depreciation and amortization expense on non-real estate assets
- accretion expense
- stock-based compensation expense
- stock-based charitable contributions
- restructuring and other exit charges, as described above
- impairment charges
- transaction costs
- impacts of straight-lining installation revenue
- impacts of straight-lining rent expense
- impacts of straight-lining contract costs
- amortization of deferred financing costs and debt discounts and premiums
- gain or loss from the disposition of non-real estate assets
- gain or loss on debt extinguishment
- an income tax expense adjustment, which represents the non-cash tax impact due to changes in valuation allowances, uncertain tax positions and deferred taxes
- recurring capital expenditures, which represent expenditures to extend the useful life of data centers or other assets that are required to support current revenues
- net income or loss from discontinued operations, net of tax
- adjustments from FFO to AFFO related to unconsolidated joint ventures and non-controlling interests
Equinix provides normalized and constant currency growth rates for revenues, adjusted EBITDA, AFFO and AFFO per share. These growth rates assume foreign currency rates remain consistent across comparative periods. Revenue growth rates exclude the impact of net power pass-through, acquisitions, divestitures and the Equinix Metal® wind-down. Adjusted EBITDA growth rates exclude the impact of acquisitions, divestitures and integration costs. AFFO growth rates exclude the impact of acquisitions and related financing costs, divestitures, integration costs and balance sheet remeasurements. AFFO per share growth rates exclude the impact of integration costs and balance sheet remeasurements.
Equinix presents cash cost of revenues and cash operating expenses (also known as cash selling, general and administrative expenses or cash SG&A). These measures exclude depreciation, amortization, accretion and stock-based compensation, which are not good indicators of Equinix's current or future operating performance, as described above.
Equinix also presents free cash flow and adjusted free cash flow. Free cash flow is defined as net cash provided by (used in) operating activities plus net cash provided by (used in) investing activities excluding the net purchases of and distributions from equity investments. Adjusted free cash flow is defined as free cash flow excluding any real estate and business acquisitions, net of cash and restricted cash acquired. These measures are presented in order for lenders, investors and the industry analysts who review and report on Equinix to better evaluate Equinix's cash spending levels relative to its industry sector and competitors.
Forward-Looking Statements
This press release contains forward-looking statements that involve risks and uncertainties. Actual results may differ materially from expectations discussed in such forward-looking statements. Factors that might cause such differences include, but are not limited to, risks to our business and operating results related to the current inflationary environment; foreign currency exchange rate fluctuations; stock price fluctuations; increased costs to procure power and the general volatility in the global energy market; the challenges of building and operating IBX® and xScale® data centers, including those related to sourcing suitable power and land, and any supply chain constraints or increased costs of supplies; the challenges of developing, deploying and delivering Equinix products and solutions; unanticipated costs or difficulties relating to the integration of companies we have acquired or will acquire into Equinix; a failure to receive significant revenues from customers in recently built out or acquired data centers; failure to complete any financing arrangements contemplated from time to time; competition from existing and new competitors; the ability to generate sufficient cash flow or otherwise obtain funds to repay new or outstanding indebtedness; the loss or decline in business from our key customers; risks related to our taxation as a REIT; risks related to regulatory inquiries or litigation; and other risks described from time to time in Equinix filings with the Securities and Exchange Commission. In particular, see recent and upcoming Equinix quarterly and annual reports filed with the Securities and Exchange Commission, copies of which are available upon request from Equinix. Equinix does not assume any obligation to update the forward-looking information contained in this press release.
EQUINIX, INC. Condensed Consolidated Statements of Operations (in millions, except share and per share data) (unaudited)
|
|||||||||
Three Months Ended |
Six Months Ended |
||||||||
June 30, 2026 |
March 31, 2026 |
June 30, 2025 |
June 30, 2026 |
June 30, 2025 |
|||||
Recurring revenues |
$ 2,377 |
$ 2,331 |
$ 2,143 |
$ 4,708 |
$ 4,230 |
||||
Non-recurring revenues |
248 |
113 |
113 |
361 |
251 |
||||
Revenues |
2,625 |
2,444 |
2,256 |
5,069 |
4,481 |
||||
Cost of revenues |
1,230 |
1,186 |
1,084 |
2,416 |
2,168 |
||||
Gross profit |
1,395 |
1,258 |
1,172 |
2,653 |
2,313 |
||||
Operating expenses: |
|||||||||
Sales and marketing |
239 |
241 |
221 |
480 |
450 |
||||
General and administrative |
462 |
444 |
451 |
906 |
889 |
||||
Restructuring and other exit charges |
6 |
6 |
2 |
12 |
12 |
||||
Transaction costs |
3 |
8 |
3 |
11 |
9 |
||||
Impairment charges |
17 |
2 |
1 |
19 |
1 |
||||
(Gain) loss on asset sales |
3 |
(20) |
— |
(17) |
— |
||||
Total operating expenses |
730 |
681 |
678 |
1,411 |
1,361 |
||||
Income from operations |
665 |
577 |
494 |
1,242 |
952 |
||||
Interest and other income (expense): |
|||||||||
Interest income |
36 |
41 |
52 |
77 |
99 |
||||
Interest expense |
(151) |
(148) |
(135) |
(299) |
(257) |
||||
Other income (expense) |
(28) |
1 |
(7) |
(27) |
2 |
||||
Gain (loss) on debt extinguishment |
1 |
— |
1 |
1 |
1 |
||||
Total interest and other, net |
(142) |
(106) |
(89) |
(248) |
(155) |
||||
Income before income taxes |
523 |
471 |
405 |
994 |
797 |
||||
Income tax expense |
(46) |
(56) |
(38) |
(102) |
(87) |
||||
Net income |
477 |
415 |
367 |
892 |
710 |
||||
Net (income) loss attributable to non-controlling interests |
2 |
— |
1 |
2 |
1 |
||||
Net income attributable to common stockholders |
$ 479 |
$ 415 |
$ 368 |
$ 894 |
$ 711 |
||||
Earnings (loss) per share ("EPS") attributable to common stockholders: |
|||||||||
Basic EPS |
$ 4.86 |
$ 4.22 |
$ 3.76 |
$ 9.07 |
$ 7.28 |
||||
Diluted EPS |
$ 4.83 |
$ 4.20 |
$ 3.75 |
$ 9.04 |
$ 7.26 |
||||
Weighted-average shares for basic EPS (in thousands) |
98,641 |
98,392 |
97,835 |
98,516 |
97,674 |
||||
Weighted-average shares for diluted EPS (in thousands) |
99,136 |
98,727 |
98,050 |
98,931 |
97,968 |
||||
EQUINIX, INC. Condensed Consolidated Balance Sheets (in millions, except headcount) (unaudited)
|
|||
June 30, 2026 |
December 31, 2025 |
||
Assets |
|||
Cash and cash equivalents |
$ 979 |
$ 1,727 |
|
Short-term investments |
1,245 |
1,500 |
|
Accounts receivable, net |
1,256 |
1,001 |
|
Other current assets |
842 |
897 |
|
Total current assets |
4,322 |
5,125 |
|
Property, plant and equipment, net |
25,222 |
23,584 |
|
Operating lease right-of-use assets |
1,296 |
1,392 |
|
Goodwill |
5,912 |
5,984 |
|
Intangible assets, net |
1,204 |
1,316 |
|
Other assets |
3,120 |
2,740 |
|
Total assets |
$ 41,076 |
$ 40,141 |
|
Liabilities, Redeemable Non-Controlling Interest and Stockholders' Equity |
|||
Accounts payable and accrued expenses |
$ 1,263 |
$ 1,350 |
|
Accrued property, plant and equipment |
723 |
564 |
|
Current portion of operating lease liabilities |
156 |
155 |
|
Current portion of finance lease liabilities |
176 |
168 |
|
Current portion of mortgage and loans payable |
9 |
17 |
|
Current portion of senior notes |
1,170 |
1,299 |
|
Other current liabilities |
323 |
340 |
|
Total current liabilities |
3,820 |
3,893 |
|
Operating lease liabilities, less current portion |
1,211 |
1,304 |
|
Finance lease liabilities, less current portion |
2,104 |
2,187 |
|
Mortgage and loans payable, less current portion |
11 |
686 |
|
Senior notes, less current portion |
18,519 |
16,910 |
|
Other liabilities |
1,013 |
983 |
|
Total liabilities |
26,678 |
25,963 |
|
Redeemable non-controlling interest |
25 |
25 |
|
Common stockholders' equity: |
|||
Common stock |
— |
— |
|
Additional paid-in capital |
22,015 |
21,642 |
|
Treasury stock |
(23) |
(24) |
|
Accumulated dividends |
(13,231) |
(12,202) |
|
Accumulated other comprehensive loss |
(1,374) |
(1,359) |
|
Retained earnings |
6,995 |
6,099 |
|
Total common stockholders' equity |
14,382 |
14,156 |
|
Non-controlling interests |
(9) |
(3) |
|
Total stockholders' equity |
14,373 |
14,153 |
|
Total liabilities, redeemable non-controlling interest and stockholders' equity |
$ 41,076 |
$ 40,141 |
|
Ending headcount by geographic region is as follows: |
|||
Americas headcount |
6,009 |
5,917 |
|
EMEA headcount |
4,719 |
4,706 |
|
Asia-Pacific headcount |
3,203 |
3,093 |
|
Total headcount |
13,931 |
13,716 |
|
EQUINIX, INC. Summary of Debt Principal Outstanding (in millions) (unaudited)
|
|||
June 30, 2026 |
December 31, 2025 |
||
Finance lease liabilities |
$ 2,280 |
$ 2,355 |
|
Term loans |
1 |
673 |
|
Mortgage payable and other loans payable |
19 |
30 |
|
Total mortgage and loans payable principal |
20 |
703 |
|
Senior notes |
19,689 |
18,209 |
|
Plus: debt issuance costs and debt discounts |
164 |
150 |
|
Total senior notes principal |
19,853 |
18,359 |
|
Total debt principal outstanding |
$ 22,153 |
$ 21,417 |
|
EQUINIX, INC. Condensed Consolidated Statements of Cash Flows (in millions) (unaudited)
|
|||||
Six Months Ended |
|||||
June 30, 2026 |
June 30, 2025 |
||||
Cash flows from operating activities: |
|||||
Net income |
$ 892 |
$ 710 |
|||
Adjustments to reconcile net income to net cash provided by operating activities: |
|||||
Depreciation, amortization and accretion |
1,101 |
982 |
|||
Stock-based compensation |
273 |
240 |
|||
Impairment charges |
19 |
1 |
|||
(Gain) loss on asset sales |
(17) |
— |
|||
Other operating activities |
31 |
23 |
|||
Changes in operating assets and liabilities: |
|||||
Accounts receivable |
(258) |
(169) |
|||
Income taxes, net |
(24) |
(45) |
|||
Operating lease right-of-use assets |
79 |
79 |
|||
Operating lease liabilities |
(77) |
(71) |
|||
Accounts payable and accrued expenses |
(80) |
(149) |
|||
Other assets and liabilities |
(155) |
152 |
|||
Net cash provided by operating activities |
1,784 |
1,753 |
|||
Cash flows from investing activities: |
|||||
Purchases of equity investments |
(264) |
(48) |
|||
Distributions from equity investments |
33 |
4 |
|||
Purchases of short-term investments |
(789) |
(795) |
|||
Maturities and sales of short-term investments |
1,054 |
450 |
|||
Business acquisitions, net of cash acquired |
— |
(182) |
|||
Real estate acquisitions |
(224) |
(99) |
|||
Purchases of other property, plant and equipment |
(2,834) |
(1,739) |
|||
Proceeds from sale of assets, net of cash transferred |
348 |
— |
|||
Settlement of foreign currency hedges |
101 |
50 |
|||
Investment in loan receivable |
— |
(45) |
|||
Net cash used in investing activities |
(2,575) |
(2,404) |
|||
Cash flows from financing activities: |
|||||
Proceeds from employee equity programs |
49 |
50 |
|||
Payment of dividends |
(1,029) |
(928) |
|||
Proceeds from public offering of common stock, net of issuance costs |
— |
99 |
|||
Proceeds from senior notes, net of debt discounts |
2,419 |
2,066 |
|||
Repayment of finance lease liabilities |
(89) |
(72) |
|||
Repayment of senior notes |
(700) |
— |
|||
Repayment of other debt |
(682) |
(1) |
|||
Other financing activities |
26 |
(8) |
|||
Net cash provided by (used in) financing activities |
(6) |
1,206 |
|||
Effect of foreign currency exchange rates on cash, cash equivalents and restricted cash |
(11) |
53 |
|||
Net increase (decrease) in cash, cash equivalents and restricted cash |
(808) |
608 |
|||
Cash, cash equivalents and restricted cash at beginning of period |
1,824 |
3,082 |
|||
Cash, cash equivalents and restricted cash at end of period |
$ 1,016 |
$ 3,690 |
|||
Free cash flow (1) |
$ (560) |
$ (607) |
|||
Adjusted free cash flow (2) |
$ (336) |
$ (326) |
|||
(1) |
We define free cash flow as net cash provided by operating activities plus net cash used in investing activities (excluding the net purchases of and distributions from equity investments) as presented below: |
||||
Net cash provided by operating activities as presented above |
$ 1,784 |
$ 1,753 |
|||
Net cash used in investing activities as presented above |
(2,575) |
(2,404) |
|||
Less purchases of equity investments, net of distributions |
231 |
44 |
|||
Free cash flow |
$ (560) |
$ (607) |
|||
(2) |
We define adjusted free cash flow as free cash flow as defined above, excluding any real estate and business acquisitions, net of cash and restricted cash acquired as presented below: |
||||
Free cash flow (as defined above) |
$ (560) |
$ (607) |
|||
Less business acquisitions, net of cash and restricted cash acquired |
— |
182 |
|||
Less real estate acquisitions |
224 |
99 |
|||
Adjusted free cash flow |
$ (336) |
$ (326) |
|||
EQUINIX, INC. Non-GAAP Measures and Other Supplemental Data ($ in millions, except per share data) (unaudited)
|
||||||||||
Three Months Ended |
Six Months Ended |
|||||||||
June 30, 2026 |
March 31, 2026 |
June 30, 2025 |
June 30, 2026 |
June 30, 2025 |
||||||
Recurring revenues |
$ 2,377 |
$ 2,331 |
$ 2,143 |
$ 4,708 |
$ 4,230 |
|||||
Non-recurring revenues |
248 |
113 |
113 |
361 |
251 |
|||||
Revenues (1) |
2,625 |
2,444 |
2,256 |
5,069 |
4,481 |
|||||
Cash cost of revenues (2) |
790 |
765 |
707 |
1,555 |
1,434 |
|||||
Cash gross profit (3) |
1,835 |
1,679 |
1,549 |
3,514 |
3,047 |
|||||
Cash operating expenses (4): |
||||||||||
Cash sales and marketing expenses |
162 |
162 |
146 |
324 |
306 |
|||||
Cash general and administrative expenses |
277 |
272 |
274 |
549 |
545 |
|||||
Total cash operating expenses (4) |
439 |
434 |
420 |
873 |
851 |
|||||
Adjusted EBITDA (5) |
$ 1,396 |
$ 1,245 |
$ 1,129 |
$ 2,641 |
$ 2,196 |
|||||
Cash gross margins (6) |
70 % |
69 % |
69 % |
69 % |
68 % |
|||||
Adjusted EBITDA margins (7) |
53 % |
51 % |
50 % |
52 % |
49 % |
|||||
FFO (8) |
$ 854 |
$ 758 |
$ 689 |
$ 1,612 |
$ 1,336 |
|||||
AFFO (9)(10) |
$ 1,168 |
$ 1,065 |
$ 972 |
$ 2,233 |
$ 1,919 |
|||||
Basic FFO per share (11) |
$ 8.66 |
$ 7.70 |
$ 7.04 |
$ 16.36 |
$ 13.68 |
|||||
Diluted FFO per share (11) |
$ 8.61 |
$ 7.68 |
$ 7.03 |
$ 16.29 |
$ 13.64 |
|||||
Basic AFFO per share (11) |
$ 11.84 |
$ 10.82 |
$ 9.94 |
$ 22.67 |
$ 19.65 |
|||||
Diluted AFFO per share (11) |
$ 11.78 |
$ 10.79 |
$ 9.91 |
$ 22.57 |
$ 19.59 |
|||||
(1) |
The geographic split of our revenues on a services basis is presented below: |
|||||||||
Americas Revenues: |
||||||||||
Colocation |
$ 747 |
$ 731 |
$ 654 |
$ 1,478 |
$ 1,290 |
|||||
Interconnection |
256 |
251 |
231 |
507 |
460 |
|||||
Managed infrastructure |
56 |
57 |
62 |
113 |
125 |
|||||
Other |
8 |
7 |
4 |
15 |
7 |
|||||
Recurring revenues |
1,067 |
1,046 |
951 |
2,113 |
1,882 |
|||||
Non-recurring revenues |
184 |
45 |
53 |
229 |
123 |
|||||
Revenues |
$ 1,251 |
$ 1,091 |
$ 1,004 |
$ 2,342 |
$ 2,005 |
|||||
EMEA Revenues: |
||||||||||
Colocation |
$ 633 |
$ 613 |
$ 572 |
$ 1,246 |
$ 1,139 |
|||||
Interconnection |
105 |
106 |
96 |
211 |
183 |
|||||
Managed infrastructure |
40 |
41 |
38 |
81 |
73 |
|||||
Other |
28 |
29 |
26 |
57 |
53 |
|||||
Recurring revenues |
806 |
789 |
732 |
1,595 |
1,448 |
|||||
Non-recurring revenues |
39 |
38 |
35 |
77 |
62 |
|||||
Revenues |
$ 845 |
$ 827 |
$ 767 |
$ 1,672 |
$ 1,510 |
|||||
Asia-Pacific Revenues: |
||||||||||
Colocation |
$ 392 |
$ 386 |
$ 359 |
$ 778 |
$ 701 |
|||||
Interconnection |
92 |
89 |
80 |
181 |
157 |
|||||
Managed infrastructure |
16 |
17 |
17 |
33 |
34 |
|||||
Other |
4 |
4 |
4 |
8 |
8 |
|||||
Recurring revenues |
504 |
496 |
460 |
1,000 |
900 |
|||||
Non-recurring revenues |
25 |
30 |
25 |
55 |
66 |
|||||
Revenues |
$ 529 |
$ 526 |
$ 485 |
$ 1,055 |
$ 966 |
|||||
Worldwide Revenues: |
||||||||||
Colocation |
$ 1,772 |
$ 1,730 |
$ 1,585 |
$ 3,502 |
$ 3,130 |
|||||
Interconnection |
453 |
446 |
407 |
899 |
800 |
|||||
Managed infrastructure |
112 |
115 |
117 |
227 |
232 |
|||||
Other |
40 |
40 |
34 |
80 |
68 |
|||||
Recurring revenues |
2,377 |
2,331 |
2,143 |
4,708 |
4,230 |
|||||
Non-recurring revenues |
248 |
113 |
113 |
361 |
251 |
|||||
Revenues |
$ 2,625 |
$ 2,444 |
$ 2,256 |
$ 5,069 |
$ 4,481 |
|||||
(2) |
We define cash cost of revenues as cost of revenues less depreciation, amortization, accretion and stock-based compensation as presented below: |
|||||||||
Cost of revenues |
$ 1,230 |
$ 1,186 |
$ 1,084 |
$ 2,416 |
$ 2,168 |
|||||
Depreciation, amortization and accretion expense |
(421) |
(405) |
(361) |
(826) |
(704) |
|||||
Stock-based compensation expense |
(19) |
(16) |
(16) |
(35) |
(30) |
|||||
Cash cost of revenues |
$ 790 |
$ 765 |
$ 707 |
$ 1,555 |
$ 1,434 |
|||||
(3) |
We define cash gross profit as revenues less cash cost of revenues (as defined above). |
|||||||||
(4) |
We define cash sales and marketing expense as sales and marketing expense less depreciation, amortization and stock-based compensation as presented below. We define cash general and administrative expense as general and administrative expense less depreciation, amortization and stock-based compensation as presented below. We define cash operating expense as selling, general, and administrative expense less depreciation, amortization, and stock-based compensation. We also refer to cash operating expense as cash selling, general and administrative expense or "cash SG&A". |
|||||||||
Sales and marketing expense |
$ 239 |
$ 241 |
$ 221 |
$ 480 |
$ 450 |
|||||
Depreciation and amortization expense |
(51) |
(52) |
(50) |
(103) |
(97) |
|||||
Stock-based compensation expense |
(26) |
(27) |
(25) |
(53) |
(47) |
|||||
Cash sales and marketing expense |
162 |
162 |
146 |
324 |
306 |
|||||
General and administrative expense |
462 |
444 |
451 |
906 |
889 |
|||||
Depreciation and amortization expense |
(85) |
(87) |
(91) |
(172) |
(181) |
|||||
Stock-based compensation expense |
(100) |
(85) |
(86) |
(185) |
(163) |
|||||
Cash general and administrative expenses |
277 |
272 |
274 |
549 |
545 |
|||||
Cash operating expense |
$ 439 |
$ 434 |
$ 420 |
$ 873 |
$ 851 |
|||||
(5) |
We define adjusted EBITDA as net income excluding income tax expense or benefit, interest income, interest expense, other income or expense, gain or loss on debt extinguishment, depreciation, amortization, accretion, stock-based compensation expense, restructuring and other exit charges, impairment charges, transaction costs, and gain or loss on asset sales as presented below: |
|||||||||
Net income |
$ 477 |
$ 415 |
$ 367 |
$ 892 |
$ 710 |
|||||
Income tax expense (benefit) |
46 |
56 |
38 |
102 |
87 |
|||||
Interest income |
(36) |
(41) |
(52) |
(77) |
(99) |
|||||
Interest expense |
151 |
148 |
135 |
299 |
257 |
|||||
Other (income) expense |
28 |
(1) |
7 |
27 |
(2) |
|||||
(Gain) loss on debt extinguishment |
(1) |
— |
(1) |
(1) |
(1) |
|||||
Depreciation, amortization and accretion expense |
557 |
544 |
502 |
1,101 |
982 |
|||||
Stock-based compensation expense |
145 |
128 |
127 |
273 |
240 |
|||||
Restructuring and other exit charges |
6 |
6 |
2 |
12 |
12 |
|||||
Impairment charges |
17 |
2 |
1 |
19 |
1 |
|||||
Transaction costs |
3 |
8 |
3 |
11 |
9 |
|||||
(Gain) loss on asset sales |
3 |
(20) |
— |
(17) |
— |
|||||
Adjusted EBITDA |
$ 1,396 |
$ 1,245 |
$ 1,129 |
$ 2,641 |
$ 2,196 |
|||||
Americas |
641 |
516 |
466 |
1,157 |
909 |
|||||
EMEA |
456 |
424 |
399 |
880 |
764 |
|||||
Asia-Pacific |
299 |
305 |
264 |
604 |
523 |
|||||
Adjusted EBITDA |
$ 1,396 |
$ 1,245 |
$ 1,129 |
$ 2,641 |
$ 2,196 |
|||||
(6) |
We define cash gross margins as cash gross profit divided by revenues. |
|||||||||
(7) |
We define adjusted EBITDA margins as adjusted EBITDA divided by revenues. |
|||||||||
(8) |
FFO is defined as net income or loss attributable to common stockholders, excluding gain or loss from the disposition of real estate assets, depreciation and amortization expense on real estate assets and adjustments for unconsolidated joint ventures' and non-controlling interests' share of these items. |
|||||||||
Net income |
$ 477 |
$ 415 |
$ 367 |
$ 892 |
$ 710 |
|||||
Net (income) loss attributable to non-controlling interests |
2 |
— |
1 |
2 |
1 |
|||||
Net income (loss) attributable to common stockholders |
479 |
415 |
368 |
894 |
711 |
|||||
Adjustments: |
||||||||||
Real estate depreciation |
361 |
351 |
312 |
712 |
609 |
|||||
(Gain) loss on disposition of real estate assets |
3 |
(20) |
1 |
(17) |
1 |
|||||
Adjustments for FFO from unconsolidated joint ventures |
11 |
12 |
8 |
23 |
15 |
|||||
FFO attributable to common stockholders |
$ 854 |
$ 758 |
$ 689 |
$ 1,612 |
$ 1,336 |
|||||
(9) |
AFFO is defined as FFO adjusted for depreciation and amortization expense on non-real estate assets, accretion, stock-based compensation, stock-based charitable contributions, restructuring and other exit charges, impairment charges, transaction costs, an installation revenue adjustment, a straight-line rent expense adjustment, a contract cost adjustment, amortization of deferred financing costs and debt discounts and premiums, gain or loss from the disposition of non-real estate assets, gain or loss on debt extinguishment, an income tax expense adjustment, recurring capital expenditures, net income or loss from discontinued operations, net of tax, and adjustments from FFO to AFFO for unconsolidated joint ventures' and non-controlling interests' share of these items. |
|||||||||
FFO attributable to common stockholders |
$ 854 |
$ 758 |
$ 689 |
$ 1,612 |
$ 1,336 |
|||||
Adjustments: |
||||||||||
Installation revenue adjustment |
8 |
8 |
8 |
16 |
10 |
|||||
Straight-line rent expense adjustment |
(4) |
4 |
5 |
— |
8 |
|||||
Contract cost adjustment |
(11) |
(15) |
(10) |
(26) |
(17) |
|||||
Amortization of deferred financing costs and debt discounts |
7 |
7 |
6 |
14 |
11 |
|||||
Stock-based compensation expense |
145 |
128 |
127 |
273 |
240 |
|||||
Stock-based charitable contributions |
3 |
— |
3 |
3 |
3 |
|||||
Non-real estate depreciation expense |
139 |
138 |
137 |
277 |
271 |
|||||
(Gain) loss on disposition of non-real estate assets |
— |
— |
— |
— |
2 |
|||||
Amortization expense |
51 |
52 |
50 |
103 |
98 |
|||||
Accretion expense adjustment |
6 |
3 |
3 |
9 |
4 |
|||||
Recurring capital expenditures |
(49) |
(32) |
(55) |
(81) |
(81) |
|||||
(Gain) loss on debt extinguishment |
(1) |
— |
(1) |
(1) |
(1) |
|||||
Restructuring and other exit charges |
6 |
6 |
2 |
12 |
12 |
|||||
Transaction costs |
3 |
8 |
3 |
11 |
9 |
|||||
Impairment charges |
17 |
2 |
1 |
19 |
1 |
|||||
Income tax expense adjustment |
(8) |
— |
4 |
(8) |
10 |
|||||
Adjustments for AFFO from unconsolidated joint ventures |
2 |
(2) |
— |
— |
3 |
|||||
AFFO attributable to common stockholders |
$ 1,168 |
$ 1,065 |
$ 972 |
$ 2,233 |
$ 1,919 |
|||||
(10) |
Following is how we reconcile from adjusted EBITDA to AFFO: |
|||||||||
Adjusted EBITDA |
$ 1,396 |
$ 1,245 |
$ 1,129 |
$ 2,641 |
$ 2,196 |
|||||
Adjustments: |
||||||||||
Interest expense, net of interest income |
(115) |
(107) |
(83) |
(222) |
(158) |
|||||
Amortization of deferred financing costs and debt discounts |
7 |
7 |
6 |
14 |
11 |
|||||
Income tax expense |
(46) |
(56) |
(38) |
(102) |
(87) |
|||||
Income tax expense adjustment |
(8) |
— |
4 |
(8) |
10 |
|||||
Straight-line rent expense adjustment |
(4) |
4 |
5 |
— |
8 |
|||||
Stock-based charitable contributions |
3 |
— |
3 |
3 |
3 |
|||||
Contract cost adjustment |
(11) |
(15) |
(10) |
(26) |
(17) |
|||||
Installation revenue adjustment |
8 |
8 |
8 |
16 |
10 |
|||||
Recurring capital expenditures |
(49) |
(32) |
(55) |
(81) |
(81) |
|||||
Other income (expense) |
(28) |
1 |
(7) |
(27) |
2 |
|||||
Adjustments for (gain) loss on asset dispositions |
— |
— |
1 |
— |
3 |
|||||
Adjustments for unconsolidated JVs and non-controlling interests |
15 |
10 |
9 |
25 |
19 |
|||||
AFFO attributable to common stockholders |
$ 1,168 |
$ 1,065 |
$ 972 |
$ 2,233 |
$ 1,919 |
|||||
(11) |
The shares used in the computation of basic and diluted FFO and AFFO per share attributable to common stockholders is presented below: |
|||||||||
Shares used in computing basic net income per share, FFO per share and AFFO per share (in thousands) |
98,641 |
98,392 |
97,835 |
98,516 |
97,674 |
|||||
Effect of dilutive securities: |
||||||||||
Employee equity awards (in thousands) |
495 |
335 |
215 |
415 |
294 |
|||||
Shares used in computing diluted net income per share, FFO per share and AFFO per share (in thousands) |
99,136 |
98,727 |
98,050 |
98,931 |
97,968 |
|||||
Basic FFO per share |
$ 8.66 |
$ 7.70 |
$ 7.04 |
$ 16.36 |
$ 13.68 |
|||||
Diluted FFO per share |
$ 8.61 |
$ 7.68 |
$ 7.03 |
$ 16.29 |
$ 13.64 |
|||||
Basic AFFO per share |
$ 11.84 |
$ 10.82 |
$ 9.94 |
$ 22.67 |
$ 19.65 |
|||||
Diluted AFFO per share |
$ 11.78 |
$ 10.79 |
$ 9.91 |
$ 22.57 |
$ 19.59 |
|||||
SOURCE Equinix, Inc.




Share this article