Full impact of coronavirus pandemic hits California housing market in May, C.A.R. reports
- Existing, single-family home sales totaled 238,740 in May on a seasonally adjusted annualized rate, down 13.9 percent from April and down 41.4 percent from May 2019.
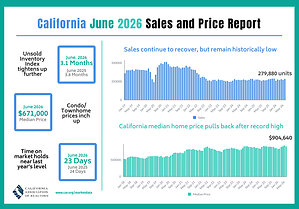
- May's statewide median home price was $588,070, down 3.0 percent from April and down 3.7 percent from May 2019.
- Year-to-date statewide home sales were down 12.9 percent in May.

LOS ANGELES, June 16, 2020 /PRNewswire/ -- California home sales fell to the lowest level since the Great Recession as the housing market suffered the full impact of the coronavirus pandemic in May and remained below 300,000 for the second straight month, the CALIFORNIA ASSOCIATION OF REALTORS® (C.A.R.) said today.
Closed escrow sales of existing, single-family detached homes in California totaled a seasonally adjusted annualized rate of 238,740 units in May, according to information collected by C.A.R. from more than 90 local REALTOR® associations and MLSs statewide. The statewide annualized sales figure represents what would be the total number of homes sold during 2020 if sales maintained the May pace throughout the year. It is adjusted to account for seasonal factors that typically influence home sales.
May's sales total was down 13.9 percent from 277,440 in April and down 41.4 percent from a year ago, when 407,330 homes were sold on an annualized basis. It was the second straight month that home sales dropped below 300,000 units. Additionally, the year-to-year drop was the largest since November 2007, contributing to a year-to-date sales drop of 12.9 percent.
"The sharp sales drop in May was the steepest we've seen in some time, but there are encouraging signs that show the market is recovering and should continue to improve over the next few months," said 2020 C.A.R. President Jeanne Radsick, a second-generation REALTOR® from Bakersfield, Calif. "With pending home sales up a stunning 67 percent in May, buyer demand is on the upswing amid record-low rates that are making monthly mortgage payments $300 less than a year ago."
As housing demand fell in May, home prices softened further, sending the statewide median home price below last year's price for the first time since February 2012 and breaking the state's 98-month year-over-year price gain streak. The May statewide median price of $588,070 for existing single-family homes in the state was down 3.0 percent from April and down 3.7 percent from May 2019, when the median price was a revised $610,940.
"As we predicted, May home sales took the full impact of the coronavirus pandemic as much of the state remained in lockdown during the past few months and caused three straight months of double-digit sales declines, which we haven't experienced since the Association began reporting monthly home sales in 1979," said C.A.R. Senior Vice President and Chief Economist Leslie Appleton-Young. "While we expect sales activity to remain below pre-COVID-19 levels, closed sales should improve markedly as the phased reopening of the economy continues and consumers feel more confident returning to the market."
Reflecting the dramatic change in market conditions, a monthly Google poll conducted by C.A.R. in early June found 40 percent of consumers said it is a good time to sell, up from 29 percent a month ago, but down from 51 percent a year ago. The market uncertainty has not curbed the optimism for homebuying as much; 32 percent of the consumers who responded to the poll believed that now is a good time to buy a home, sharply higher than last year, when 26 percent said it was a good time to buy a home.
Other key points from C.A.R.'s May 2020 resale housing report include:
- At the regional level, all major regions dipped in sales by more than 35 percent from last year, with the Bay Area and Central Coast dropping the most at -51.1 percent each, followed by Southern California (-45.6 percent), and the Central Valley (-36.6 percent).
- Fifty of the 51 counties tracked by C.A.R. experienced a year-over-year loss in sales, with Monterey declining the most from last year at -63.0 percent, followed by Mendocino (-59.7 percent), and San Benito (-59.2 percent). Counties that experienced a sales decline from last year averaged a loss of 42.2 percent from the year prior. Del Norte was the only county with an increase from last year.
- Median prices continued to dip in May from last year in the Central Coast and the Bay Area but inched up slightly in the Central Valley region. The median home price was virtually unchanged in Southern California.
- Thirty-one of the 51 counties tracked by C.A.R. reported a year-over-year gain in price in May, with Glenn County growing the most at 31.9 percent. Of the 19 counties that experienced a price drop from last May, Plumas had the biggest decline of 23.3 percent.
- C.A.R.'s Unsold inventory Index jumped to 4.3 months in May from 3.4 months in April and was up from 3.2 months in May 2019. The index indicates the number of months it would take to sell the supply of homes on the market at the current rate of sales.
- Total active listings continued to decline on an annual basis for the 11th consecutive month; the 34 percent year-over-year decrease in listings was the biggest drop since March 2013.
- All major regions recorded a decrease in housing supply of more than 25 percent, with both the Southern California and the Central Valley regions falling by more than 33 percent. All counties in Southern California, except Ventura, declined 36 percent or more from last year, with San Diego dropping the most at 42.7 percent. The Bay Area also experienced a significant housing supply decline, but at a relatively smaller degree compared to the Southland. Eight of the nine Bay Area counties recorded a decline in active listings on a year-over-year basis in May, and six had a decrease of more than 25 percent. San Francisco was the only county in the region with an increase in active listings from last year.
- The median number of days it took to sell a California single-family home dipped to 17 days in May from 18 days in May 2019.
- C.A.R.'s statewide sales-price-to-list-price ratio* was 99.7 percent in May 2020, up slightly from 99.3 in May 2019.
- The statewide average price per square foot** for an existing single-family home was $281 in May 2020 and $292 in May 2019.
- The 30-year, fixed-mortgage interest rate averaged 3.23 percent in May, down from 4.07 percent in May 2019, according to Freddie Mac. The five-year, adjustable mortgage interest rate was an average of 3.16 percent, compared to 3.65 percent in May 2019.
Note: The County MLS median price and sales data in the tables are generated from a survey of more than 90 associations of REALTORS® throughout the state and represent statistics of existing single-family detached homes only. County sales data are not adjusted to account for seasonal factors that can influence home sales. Movements in sales prices should not be interpreted as changes in the cost of a standard home. The median price is where half sold for more and half sold for less; medians are more typical than average prices, which are skewed by a relatively small share of transactions at either the lower end or the upper end. Median prices can be influenced by changes in cost, as well as changes in the characteristics and the size of homes sold. The change in median prices should not be construed as actual price changes in specific homes.
*Sales-to-list-price ratio is an indicator that reflects the negotiation power of home buyers and home sellers under current market conditions. The ratio is calculated by dividing the final sales price of a property by its last list price and is expressed as a percentage. A sales-to-list ratio with 100 percent or above suggests that the property sold for more than the list price, and a ratio below 100 percent indicates that the price sold below the asking price.
**Price per square foot is a measure commonly used by real estate agents and brokers to determine how much a square foot of space a buyer will pay for a property. It is calculated as the sale price of the home divided by the number of finished square feet. C.A.R. currently tracks price-per-square foot statistics for 50 counties.
Leading the way…® in California real estate for more than 110 years, the CALIFORNIA ASSOCIATION OF REALTORS® (www.car.org) is one of the largest state trade organizations in the United States with more than 200,000 members dedicated to the advancement of professionalism in real estate. C.A.R. is headquartered in Los Angeles.
May 2020 County Sales and Price Activity |
|||||||||
May 2020 |
Median Sold Price of Existing Single-Family Homes |
Sales |
|||||||
State/Region/County |
May 2020 |
April 2020 |
May 2019 |
Price |
Price |
Sales |
Sales |
||
Calif. Single-family homes |
$588,070 |
$606,410 |
$610,940 |
r |
-3.0% |
-3.7% |
-13.9% |
-41.4% |
|
Calif. Condo/Townhomes |
$464,900 |
$488,000 |
$470,000 |
-4.7% |
-1.1% |
-17.3% |
-56.5% |
||
Los Angeles Metro Area |
$535,000 |
$550,000 |
$535,000 |
-2.7% |
0.0% |
-11.9% |
-46.4% |
||
Central Coast |
$678,500 |
$657,500 |
$690,000 |
3.2% |
-1.7% |
-18.3% |
-51.1% |
||
Central Valley |
$350,000 |
$346,500 |
$340,000 |
1.0% |
2.9% |
-3.3% |
-36.6% |
||
Inland Empire |
$395,740 |
$390,000 |
$384,000 |
1.5% |
3.1% |
-7.5% |
-41.2% |
||
San Francisco Bay Area |
$965,000 |
$980,000 |
$990,000 |
-1.5% |
-2.5% |
-6.7% |
-51.1% |
||
San Francisco Bay Area |
|||||||||
Alameda |
$955,000 |
$1,030,000 |
$959,000 |
-7.3% |
-0.4% |
-19.5% |
-56.5% |
||
Contra Costa |
$690,000 |
$710,000 |
$700,360 |
-2.8% |
-1.5% |
-6.4% |
-52.6% |
||
Marin |
$1,500,000 |
$1,365,000 |
$1,400,000 |
9.9% |
7.1% |
46.4% |
-49.6% |
||
Napa |
$672,500 |
$750,000 |
$725,000 |
-10.3% |
-7.2% |
-18.5% |
-53.9% |
||
San Francisco |
$1,627,500 |
$1,699,500 |
$1,697,500 |
-4.2% |
-4.1% |
2.0% |
-55.6% |
||
San Mateo |
$1,650,000 |
$1,640,000 |
$1,766,500 |
0.6% |
-6.6% |
19.5% |
-44.5% |
||
Santa Clara |
$1,365,000 |
$1,388,890 |
$1,335,000 |
-1.7% |
2.2% |
-12.3% |
-51.1% |
||
Solano |
$482,000 |
$482,500 |
$446,000 |
-0.1% |
8.1% |
1.8% |
-35.1% |
||
Sonoma |
$675,000 |
$657,880 |
$666,000 |
2.6% |
1.4% |
-14.6% |
-54.0% |
||
Southern California |
|||||||||
Los Angeles |
$546,930 |
$565,170 |
$539,480 |
-3.2% |
1.4% |
-10.9% |
-47.5% |
||
Orange |
$834,550 |
$861,000 |
$845,000 |
-3.1% |
-1.2% |
-19.1% |
-53.3% |
||
Riverside |
$434,480 |
$435,000 |
$420,000 |
-0.1% |
3.4% |
-4.3% |
-43.0% |
||
San Bernardino |
$320,000 |
$325,000 |
$315,000 |
-1.5% |
1.6% |
-12.7% |
-37.6% |
||
San Diego |
$655,000 |
$671,000 |
$650,000 |
-2.4% |
0.8% |
-14.6% |
-42.3% |
||
Ventura |
$681,250 |
$675,000 |
$659,500 |
0.9% |
3.3% |
-28.5% |
-52.0% |
||
Central Coast |
|||||||||
Monterey |
$650,000 |
$660,000 |
$639,000 |
-1.5% |
1.7% |
-30.2% |
-63.0% |
||
San Luis Obispo |
$632,500 |
$600,000 |
$640,000 |
5.4% |
-1.2% |
-22.4% |
-53.8% |
||
Santa Barbara |
$637,500 |
$600,000 |
$696,000 |
6.3% |
-8.4% |
-13.0% |
-44.0% |
||
Santa Cruz |
$850,000 |
$949,500 |
$935,000 |
-10.5% |
-9.1% |
-2.1% |
-37.8% |
||
Central Valley |
|||||||||
Fresno |
$295,000 |
$290,000 |
$284,900 |
1.7% |
3.5% |
-5.1% |
-31.5% |
||
Glenn |
$323,250 |
$282,000 |
$245,000 |
14.6% |
31.9% |
-20.0% |
-33.3% |
||
Kern |
$270,000 |
$272,000 |
$252,000 |
-0.7% |
7.1% |
-4.7% |
-33.5% |
||
Kings |
$249,950 |
$260,900 |
$260,000 |
-4.2% |
-3.9% |
1.1% |
-22.1% |
||
Madera |
$297,500 |
$306,500 |
$270,000 |
-2.9% |
10.2% |
1.5% |
-31.3% |
||
Merced |
$285,000 |
$273,900 |
$285,000 |
4.1% |
0.0% |
-8.5% |
-33.3% |
||
Placer |
$515,000 |
$510,000 |
$514,900 |
1.0% |
0.0% |
15.2% |
-38.6% |
||
Sacramento |
$395,000 |
$400,000 |
$385,000 |
-1.3% |
2.6% |
1.0% |
-37.8% |
||
San Benito |
$660,500 |
$614,950 |
$600,000 |
7.4% |
10.1% |
-28.6% |
-59.2% |
||
San Joaquin |
$415,000 |
$395,000 |
$380,000 |
5.1% |
9.2% |
-16.5% |
-43.7% |
||
Stanislaus |
$350,000 |
$350,000 |
$335,000 |
0.0% |
4.5% |
-13.8% |
-45.1% |
||
Tulare |
$255,250 |
$252,750 |
$248,000 |
1.0% |
2.9% |
0.0% |
-23.9% |
||
Other Calif. Counties |
|||||||||
Amador |
$321,000 |
$350,000 |
$342,750 |
r |
-8.3% |
-6.3% |
8.1% |
-41.2% |
|
Butte |
$362,000 |
$377,500 |
$359,000 |
-4.1% |
0.8% |
-31.2% |
-46.9% |
||
Calaveras |
$330,000 |
$332,250 |
$375,000 |
-0.7% |
-12.0% |
-1.5% |
-37.4% |
||
Del Norte |
$338,450 |
$240,000 |
$256,850 |
41.0% |
31.8% |
-4.3% |
57.1% |
||
El Dorado |
$535,000 |
$500,000 |
$521,380 |
7.0% |
2.6% |
-2.9% |
-29.5% |
||
Humboldt |
$340,750 |
$317,000 |
$315,000 |
7.5% |
8.2% |
-4.1% |
-44.9% |
||
Lake |
$300,000 |
$272,000 |
$267,000 |
10.3% |
12.4% |
-18.0% |
-38.3% |
||
Lassen |
$195,000 |
$167,000 |
$205,000 |
16.8% |
-4.9% |
13.3% |
-41.4% |
||
Mariposa |
$280,000 |
$330,000 |
$295,000 |
-15.2% |
-5.1% |
-15.4% |
-47.6% |
||
Mendocino |
$426,000 |
$395,000 |
$388,500 |
7.8% |
9.7% |
-32.4% |
-59.7% |
||
Mono |
$520,150 |
$801,250 |
$564,500 |
-35.1% |
-7.9% |
-50.0% |
-50.0% |
||
Nevada |
$410,000 |
$460,000 |
$420,000 |
-10.9% |
-2.4% |
32.9% |
-23.4% |
||
Plumas |
$269,000 |
$252,500 |
$350,500 |
6.5% |
-23.3% |
-31.8% |
-40.0% |
||
Shasta |
$297,000 |
$288,500 |
$285,000 |
2.9% |
4.2% |
-2.5% |
-33.7% |
||
Siskiyou |
$230,000 |
$260,250 |
$235,000 |
-11.6% |
-2.1% |
39.3% |
-15.2% |
||
Sutter |
$342,550 |
$300,000 |
$319,900 |
14.2% |
7.1% |
-36.5% |
-45.2% |
||
Tehama |
$290,000 |
$217,500 |
$243,000 |
33.3% |
19.3% |
-13.9% |
-36.7% |
||
Tuolumne |
$319,000 |
$299,000 |
$310,000 |
6.7% |
2.9% |
-13.6% |
-30.1% |
||
Yolo |
$443,000 |
$460,820 |
$469,500 |
-3.9% |
-5.6% |
-12.6% |
-43.2% |
||
Yuba |
$320,000 |
$328,900 |
$311,000 |
-2.7% |
2.9% |
-28.2% |
-44.0% |
||
r = revised |
|||||||||
May 2020 County Unsold Inventory and Days on Market |
||||||||||
May 2020 |
Unsold Inventory Index |
Median Time on Market |
||||||||
State/Region/County |
May |
April |
May |
May |
April |
May |
||||
Calif. Single-family homes |
4.3 |
3.4 |
3.2 |
17.0 |
13.0 |
18.0 |
||||
Calif. Condo/Townhomes |
5.3 |
3.5 |
2.8 |
18.0 |
13.0 |
19.0 |
||||
Los Angeles Metro Area |
4.7 |
3.6 |
3.6 |
20.0 |
16.0 |
25.0 |
||||
Central Coast |
6.4 |
4.5 |
3.9 |
17.0 |
12.0 |
18.0 |
||||
Central Valley |
3.3 |
3.0 |
2.7 |
13.0 |
10.0 |
13.0 |
||||
Inland Empire |
4.4 |
3.9 |
3.7 |
25.0 |
24.0 |
31.0 |
||||
San Francisco Bay Area |
3.8 |
2.9 |
2.3 |
17.0 |
11.0 |
14.0 |
||||
San Francisco Bay Area |
||||||||||
Alameda |
3.1 |
1.9 |
1.9 |
11.0 |
9.0 |
12.0 |
||||
Contra Costa |
3.3 |
2.6 |
2.1 |
13.0 |
9.0 |
12.0 |
||||
Marin |
4.6 |
5.4 |
2.9 |
29.0 |
30.5 |
25.0 |
||||
Napa |
9.0 |
6.6 |
5.2 |
47.0 |
30.0 |
35.0 |
||||
San Francisco |
3.7 |
2.7 |
1.5 |
20.5 |
14.0 |
14.0 |
||||
San Mateo |
3.4 |
3.3 |
2.0 |
12.0 |
9.0 |
11.0 |
||||
Santa Clara |
3.6 |
2.5 |
2.2 |
10.0 |
8.0 |
12.0 |
||||
Solano |
3.0 |
2.9 |
2.7 |
31.0 |
25.0 |
31.0 |
||||
Sonoma |
7.4 |
5.1 |
3.6 |
45.0 |
40.0 |
34.0 |
||||
Southern California |
||||||||||
Los Angeles |
4.3 |
3.3 |
3.3 |
16.0 |
12.0 |
21.0 |
||||
Orange |
5.5 |
3.7 |
3.7 |
15.0 |
10.0 |
19.0 |
||||
Riverside |
4.3 |
3.9 |
3.4 |
23.0 |
24.0 |
32.0 |
||||
San Bernardino |
4.7 |
3.9 |
4.1 |
29.0 |
24.0 |
28.0 |
||||
San Diego |
3.5 |
2.7 |
3.0 |
11.0 |
8.0 |
14.0 |
||||
Ventura |
7.6 |
4.6 |
4.9 |
45.0 |
38.0 |
44.5 |
||||
Central Coast |
||||||||||
Monterey |
8.7 |
5.3 |
3.8 |
16.5 |
10.0 |
17.0 |
||||
San Luis Obispo |
6.4 |
4.6 |
3.7 |
22.0 |
14.5 |
19.0 |
||||
Santa Barbara |
5.6 |
4.0 |
4.3 |
12.0 |
16.0 |
21.0 |
||||
Santa Cruz |
5.4 |
4.2 |
3.8 |
18.5 |
9.0 |
14.0 |
||||
Central Valley |
||||||||||
Fresno |
3.3 |
3.1 |
3.2 |
13.0 |
11.0 |
14.0 |
||||
Glenn |
5.4 |
4.3 |
4.6 |
35.0 |
69.0 |
22.0 |
||||
Kern |
3.5 |
3.1 |
2.8 |
15.0 |
12.0 |
13.0 |
||||
Kings |
2.3 |
2.2 |
3.1 |
20.5 |
12.0 |
20.0 |
||||
Madera |
4.8 |
4.8 |
3.8 |
29.0 |
28.5 |
30.0 |
||||
Merced |
3.1 |
2.7 |
3.3 |
14.0 |
13.5 |
29.5 |
||||
Placer |
3.5 |
3.7 |
2.6 |
14.0 |
9.0 |
10.0 |
||||
Sacramento |
2.9 |
2.7 |
2.2 |
9.0 |
7.0 |
10.0 |
||||
San Benito |
9.1 |
5.6 |
4.2 |
32.5 |
34.0 |
15.0 |
||||
San Joaquin |
3.6 |
2.8 |
2.8 |
16.0 |
11.0 |
14.0 |
||||
Stanislaus |
3.2 |
2.6 |
2.3 |
14.0 |
10.0 |
14.0 |
||||
Tulare |
2.9 |
3.2 |
3.0 |
17.0 |
16.0 |
27.0 |
||||
Other CA Counties |
||||||||||
Amador |
7.4 |
7.5 |
5.1 |
r |
38.5 |
20.0 |
14.0 |
r |
||
Butte |
4.3 |
2.6 |
2.7 |
21.0 |
13.5 |
9.0 |
||||
Calaveras |
6.4 |
5.7 |
5.6 |
78.0 |
62.0 |
32.0 |
||||
Del Norte |
6.0 |
6.0 |
9.4 |
113.0 |
92.0 |
146.5 |
||||
El Dorado |
5.4 |
4.5 |
5.2 |
32.0 |
24.0 |
24.0 |
||||
Humboldt |
6.3 |
5.4 |
4.7 |
19.0 |
27.0 |
12.0 |
||||
Lake |
7.6 |
5.9 |
6.5 |
78.5 |
70.0 |
51.0 |
||||
Lassen |
7.7 |
8.1 |
4.8 |
119.0 |
87.0 |
97.0 |
||||
Mariposa |
9.3 |
7.4 |
5.9 |
45.0 |
17.0 |
29.0 |
||||
Mendocino |
12.6 |
7.3 |
7.3 |
53.0 |
82.0 |
49.5 |
||||
Mono |
27.0 |
10.2 |
15.8 |
80.0 |
230.0 |
182.5 |
||||
Nevada |
5.4 |
6.1 |
4.9 |
29.0 |
19.0 |
25.0 |
||||
Plumas |
22.9 |
12.3 |
15.1 |
181.0 |
88.0 |
123.0 |
||||
Shasta |
4.8 |
4.3 |
3.9 |
18.0 |
16.5 |
14.0 |
||||
Siskiyou |
6.4 |
8.1 |
7.5 |
24.0 |
96.0 |
17.0 |
||||
Sutter |
3.5 |
2.2 |
2.8 |
17.0 |
15.0 |
11.0 |
||||
Tehama |
6.3 |
5.4 |
4.7 |
55.0 |
42.5 |
57.0 |
||||
Tuolumne |
7.6 |
5.9 |
6.9 |
35.0 |
74.5 |
28.0 |
||||
Yolo |
4.7 |
3.6 |
2.9 |
16.0 |
8.0 |
12.0 |
||||
Yuba |
3.8 |
2.7 |
2.5 |
18.0 |
12.0 |
13.0 |
||||
r = revised |
||||||||||
SOURCE CALIFORNIA ASSOCIATION OF REALTORS® (C.A.R.)


Share this article