


Home sales pull back in July as California's median price slips below $900,000
- Existing, single-family home sales totaled 263,170 in July on a seasonally adjusted annualized rate, down 6.0 percent from June and up 1.1 percent from July 2025.
- The statewide median home price declined to $887,680, down 1.9 percent from $904,640 in June and up 0.3 percent from $885,180 in July 2025.
- Year-to-date sales increased 1.8 percent.
SACRAMENTO, Calif., Aug. 17, 2026 /PRNewswire/ -- California home sales retreated in July after a solid rebound in June but remained above their year-ago level for the fourth consecutive month as the market continues to search for sustained momentum and lower interest rates, the CALIFORNIA ASSOCIATION OF REALTORS® (C.A.R.) said today.
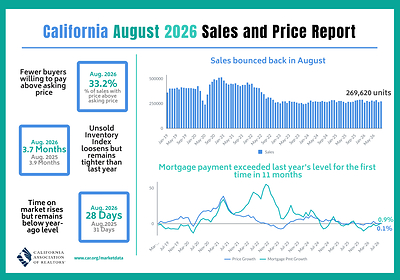
Infographic: https://www.car.org/Global/Infographics/2026-07-Sales-and-Price
Closed escrow sales of existing, single-family detached homes remained above their year-ago level for the fourth straight month in July, even as sales retreated to their lowest level in six months. California home sales reached a seasonally adjusted annualized rate of 263,170 in July, according to information collected by C.A.R. from more than 90 local REALTOR® associations and MLSs statewide. The statewide annualized sales figure represents what would be the total number of homes sold during 2026 if sales maintained the July pace throughout the year. It is adjusted to account for seasonal factors that typically influence home sales.
July sales declined 6.0 percent from the revised 279,880 homes sold in June and edged up 1.1 percent from a downwardly revised 260,250-unit pace recorded in July 2025. Statewide sales remained below the 300,000 benchmark for the 46th consecutive month, underscoring the market's continued struggle to build sustainable momentum. Year-to-date sales were 1.8 percent above last year's pace through the first seven months of 2026, a small dip from the 1.9 percent growth pace recorded in June. Sales remained above year-ago levels in five of the seven price segments tracked by C.A.R. — led by homes priced at $2 million and above, which rose 8.9 percent from a year earlier — and homes priced below $300,000 which posted a 5.2 percent annual gain.
"California's housing market pulled back last month as mortgage rates remained elevated and briefly reached a 12-month high in recent weeks," said C.A.R. President Tamara Suminski, a Southern California broker and REALTOR®. "Despite a slower start to the second half of 2026, improved supply conditions in July, combined with the recent decline in mortgage rates, could provide some relief to buyers and give them more options to choose from as the market transitions into the off-peak season."
Pending home sales also slowed in July, declining 6.8 percent from the previous month but remaining 1.0 percent above the same month last year, the second consecutive year-over-year gain following a brief dip in May. Mortgage rates continued to trend higher throughout July, averaging 6.54 percent for the month and briefly reaching a 12-month high later in the month before pulling back. Rates have since retreated to a three-week low but remain elevated near the upper 6-percent range, and high borrowing costs will likely remain a headwind for housing demand as the market moves beyond the peak homebuying season.
California's statewide median home price softened again in July, falling below the $900,000 benchmark for the first time in four months. The statewide median price declined 1.9 percent from $904,640 in June to $887,680 in July, a steeper drop than the average decrease of 0.7 percent observed between June and July in the past 10 years. On a year-over-year basis, the median price edged up 0.3 percent, marking the third consecutive annual increase, although price growth remained modest after slowing from the 3.1 percent gain recorded in May.
Continued moderation in the statewide median price reflected both a further shift in the mix of homes sold and persistent softness in underlying price growth. The share of million-dollar home sales declined from 36.9 percent in June to 35.5 percent in July, down three percentage points from the record 38.5 percent reached in May, as sales activity became less concentrated in higher-priced properties. At the same time, the statewide median price per square foot declined 0.5 percent from a year earlier, following mild annual gains of 1.8 percent in May and 0.2 percent in June. Together, the normalization in the sales mix and the renewed softness in price per square foot suggest that July's moderation reflected relatively weak price growth in recent months.
"July's housing market performance reflected the ongoing challenges under the current economic and lending environment, but the market continues to show signs of resilience," said C.A.R. Senior Vice President and Chief Economist Jordan Levine. "Higher mortgage rates and financial market volatility in the past two months weighed on buyer demand, resulting in softer sales activity and subdued price growth in July. While broader economic concerns and affordability constraints will remain headwinds in the near-term, moderations in rates could help stabilize demand, and market conditions could improve in the months ahead if geopolitical tensions ease further."
Other key points from C.A.R.'s July 2026 resale housing report include:
- At the regional level, home sales remained above year-ago levels in four of California's five major regions in July, although the pace of growth moderated considerably from June. The Central Coast led all regions with a solid 11.1 percent increase from a year earlier, while the Central Valley posted a more modest gain of 2.9 percent. Sales in the Far North (0.8 percent) ticked up slightly year-over-year, while Southern California (0.1 percent) and the San Francisco Bay Area (-0.1 percent) were essentially unchanged from their year-ago levels.
- At the county level, 28 of the 53 counties tracked by C.A.R. recorded year-over-year sales gains in July, with 13 posting double-digit increases from a year earlier. Merced led all counties with a 39.5 percent surge in sales, followed by Lake (37.5 percent) and Del Norte (33.3 percent). In contrast, 22 counties posted annual sales declines — including eight that fell by more than 10 percent — while sales in Plumas, Mono and Napa were unchanged from a year ago. Trinity experienced the steepest decline (-62.5 percent), followed by Glenn (-35.3 percent) and Mariposa (-34.8 percent). As is often the case in smaller counties, many of the outsized gains and losses were likely driven by low transaction volumes, rather than broad changes in underlying market conditions.
- Three of California's five major regions posted year-over-year gains in their median home price in July, although price growth moderated across much of the state. Southern California led all regions with a 2.7 percent increase from a year earlier, while the Far North (0.5 percent) and the Central Valley (0.2 percent) recorded only mild price gains. The Central Coast posted the largest annual price decline at 4.1 percent, followed by the San Francisco Bay Area, where the median price slipped 1.2 percent from July 2025. All five regions recorded month-to-month price declines.
- Thirty-four of the 53 counties tracked by C.A.R. recorded year-over-year median price gains in July. San Francisco led all counties with a 25.2 percent increase, followed by Calaveras (18.8 percent) and Mendocino (16.7 percent). San Francisco's continued price strength has been supported by exceptionally tight housing inventory and strong demand, particularly at the higher end of the market, as the city's robust artificial intelligence sector continues to generate high-income employment and wealth among technology workers. Meanwhile, 19 counties recorded annual price declines, with Mariposa posting the steepest drop (-16.7 percent), followed by Lassen (-16.4 percent) and Tehama (-16.3 percent). As is often the case in smaller counties, some of the outsized gains and declines likely reflected limited transaction volumes and shifts in the mix of homes sold rather than broad changes in underlying home values.
- Housing inventory loosened from the prior month in July, but supply conditions remained tighter than a year ago. The Unsold Inventory Index (UII) increased from 3.1 months in June to 3.4 months in July but remained below the 3.7 months recorded in July 2025. The Index measures the number of months needed to sell the supply of homes on the market at the current sales rate. Total active listings increased 2.9 percent from June but slipped 9.3 percent from their year-ago level, the sixth consecutive month of annual declines. Housing supply remained tighter than a year ago in all five major regions, with the San Francisco Bay Area leading the way again as the tightest market in the state at 2.3 months, and the Far North as the highest at 5.1 months.
- Active listings declined on a year-over-year basis in 42 of the 53 counties tracked by C.A.R. in July, highlighting the widespread inventory constraints that persisted across much of the state. San Francisco recorded the steepest decline, with active listings falling 41.5 percent from a year earlier, followed by Marin (-28.9 percent) and Mono (-26.5 percent). Meanwhile, 11 counties recorded year-over-year increases in active listings, led by Calaveras (29.3 percent), Imperial (23.6 percent) and Kings (21.7 percent).
- The median number of days it took to sell a California single-family home was 26 in July 2026, down from 28 days in July 2025.
- C.A.R.'s statewide sales-price-to-list-price ratio* was 99.3 percent in July 2026 and 98.5 percent in July 2025.
- The statewide median price per square foot** for an existing single-family home was $434 this July, down from $436 in July 2025.
- The 30-year, fixed-mortgage interest rate averaged 6.54 percent in July, down from 6.72 percent in July 2025, according to C.A.R.'s calculations based on Freddie Mac's weekly mortgage survey data.
Note: The County MLS median price and sales data in the tables are generated from a survey of more than 90 associations of REALTORS® throughout the state and represent statistics of existing single-family detached homes only. County sales data is not adjusted to account for seasonal factors that can influence home sales. Movements in sales prices should not be interpreted as changes in the cost of a standard home. The median price is where half sold for more and half sold for less; medians are more typical than average prices, which are skewed by a relatively small share of transactions at either the lower end or the upper end. Median prices can be influenced by changes in cost, as well as changes in the characteristics and the size of homes sold. The change in median prices should not be construed as actual price changes in specific homes.
*Sales-to-list-price ratio is an indicator that reflects the negotiation power of home buyers and home sellers under current market conditions. The ratio is calculated by dividing the final sales price of a property by its original list price and is expressed as a percentage. A sales-to-list ratio with 100 percent or above suggests that the property sold for more than the list price, and a ratio below 100 percent indicates that the price sold below the asking price.
**Price per square foot is a measure commonly used by real estate agents and brokers to determine how much a square foot of space a buyer will pay for a property. It is calculated as the sale price of the home divided by the number of finished square feet. C.A.R. currently tracks price-per-square foot statistics for 53 counties.
Leading the way…® in California real estate for 120 years, the CALIFORNIA ASSOCIATION OF REALTORS® (www.car.org) is one of the largest state trade organizations in the United States with nearly 190,000 members dedicated to the advancement of professionalism in real estate. C.A.R. is headquartered in Sacramento.
July 2026 County Sales and Price Activity
(Regional and condo sales data not seasonally adjusted)
July 2026 |
Median Sales Price of Existing Single-Family Homes |
Sales |
|||||||
State/Region/County |
July |
June |
July |
Price MTM% Chg |
Price YTY% Chg |
Sales MTM% Chg |
Sales YTY% Chg |
||
Calif. Single-Family Homes |
$887,680 |
$904,640 |
$885,180 |
r |
-1.9 % |
0.3 % |
-6.0 % |
1.1 % |
|
Calif. Condo/Townhomes |
$645,000 |
$671,000 |
$648,000 |
r |
-3.9 % |
-0.5 % |
4.3 % |
9.0 % |
|
Los Angeles Metro Area |
$849,450 |
$850,000 |
$845,500 |
-0.1 % |
0.5 % |
-8.8 % |
-0.8 % |
||
Central Coast |
$1,070,000 |
$1,110,000 |
$1,115,680 |
-3.6 % |
-4.1 % |
6.0 % |
11.1 % |
||
Central Valley |
$501,000 |
$514,800 |
$500,000 |
-2.7 % |
0.2 % |
-4.0 % |
2.9 % |
||
Far North |
$399,000 |
$405,000 |
$397,000 |
-1.5 % |
0.5 % |
-13.0 % |
0.8 % |
||
Inland Empire |
$600,000 |
$601,000 |
$589,020 |
-0.2 % |
1.9 % |
-11.3 % |
-1.5 % |
||
San Francisco Bay Area |
$1,285,000 |
$1,400,000 |
$1,300,000 |
-8.2 % |
-1.2 % |
-11.1 % |
-0.1 % |
||
Southern California |
$899,000 |
$900,000 |
$875,030 |
-0.1 % |
2.7 % |
-8.5 % |
0.1 % |
||
San Francisco Bay Area |
|||||||||
Alameda |
$1,275,000 |
$1,325,000 |
$1,250,000 |
-3.8 % |
2.0 % |
-9.2 % |
-4.6 % |
||
Contra Costa |
$875,000 |
$920,000 |
$862,500 |
-4.9 % |
1.4 % |
-8.8 % |
2.3 % |
||
Marin |
$1,770,000 |
$1,775,000 |
$1,625,000 |
-0.3 % |
8.9 % |
-15.7 % |
21.2 % |
||
Napa |
$885,000 |
$910,000 |
$925,000 |
-2.7 % |
-4.3 % |
-13.2 % |
0.0 % |
||
San Francisco |
$2,050,000 |
$2,128,000 |
$1,637,380 |
-3.7 % |
25.2 % |
-33.3 % |
-10.3 % |
||
San Mateo |
$2,210,000 |
$2,310,000 |
$2,100,000 |
-4.3 % |
5.2 % |
-13.6 % |
3.8 % |
||
Santa Clara |
$1,955,000 |
$1,950,000 |
$1,900,000 |
0.3 % |
2.9 % |
-13.4 % |
-2.5 % |
||
Solano |
$610,000 |
$590,000 |
$593,680 |
3.4 % |
2.7 % |
-0.6 % |
10.1 % |
||
Sonoma |
$840,000 |
$875,000 |
$845,450 |
-4.0 % |
-0.6 % |
-2.2 % |
-6.3 % |
||
Southern California |
|||||||||
Imperial |
$412,250 |
$435,000 |
$415,000 |
-5.2 % |
-0.7 % |
-28.8 % |
-22.4 % |
||
Los Angeles |
$888,120 |
$910,370 |
$911,360 |
-2.4 % |
-2.6 % |
-8.7 % |
-0.9 % |
||
Orange |
$1,475,000 |
$1,490,000 |
$1,400,000 |
-1.0 % |
5.4 % |
-4.1 % |
0.6 % |
||
Riverside |
$649,000 |
$635,000 |
$630,000 |
2.2 % |
3.0 % |
-13.7 % |
-2.6 % |
||
San Bernardino |
$488,280 |
$508,080 |
$486,290 |
-3.9 % |
0.4 % |
-5.5 % |
4.5 % |
||
San Diego |
$1,099,500 |
$1,085,000 |
$1,040,000 |
1.3 % |
5.7 % |
-6.7 % |
4.5 % |
||
Ventura |
$950,000 |
$937,500 |
$949,500 |
1.3 % |
0.1 % |
-9.0 % |
-0.3 % |
||
Central Coast |
|||||||||
Monterey |
$965,000 |
$930,000 |
$1,022,500 |
3.8 % |
-5.6 % |
3.9 % |
8.9 % |
||
San Luis Obispo |
$950,000 |
$967,500 |
$940,000 |
-1.8 % |
1.1 % |
4.7 % |
9.4 % |
||
Santa Barbara |
$1,052,680 |
$1,228,500 |
$1,095,500 |
-14.3 % |
-3.9 % |
25.7 % |
29.3 % |
||
Santa Cruz |
$1,375,000 |
$1,350,000 |
$1,395,500 |
1.9 % |
-1.5 % |
-13.1 % |
-6.3 % |
||
Central Valley |
|||||||||
Fresno |
$450,000 |
$429,820 |
$440,000 |
4.7 % |
2.3 % |
-2.7 % |
3.3 % |
||
Glenn |
$330,000 |
$347,750 |
$375,000 |
-5.1 % |
-12.0 % |
-38.9 % |
-35.3 % |
||
Kern |
$410,000 |
$415,000 |
$390,000 |
-1.2 % |
5.1 % |
-3.9 % |
-0.3 % |
||
Kings |
$385,000 |
$401,500 |
$357,500 |
r |
-4.1 % |
7.7 % |
4.5 % |
1.5 % |
|
Madera |
$455,000 |
$428,120 |
$445,000 |
6.3 % |
2.2 % |
-7.6 % |
-17.8 % |
||
Merced |
$410,000 |
$431,400 |
$440,000 |
-5.0 % |
-6.8 % |
6.6 % |
39.5 % |
||
Placer |
$689,000 |
$680,000 |
$687,480 |
1.3 % |
0.2 % |
-0.8 % |
11.4 % |
||
Sacramento |
$540,000 |
$575,000 |
$559,500 |
-6.1 % |
-3.5 % |
-5.2 % |
-1.4 % |
||
San Benito |
$799,000 |
$815,000 |
$799,900 |
-2.0 % |
-0.1 % |
4.9 % |
22.9 % |
||
San Joaquin |
$560,000 |
$566,100 |
$530,000 |
-1.1 % |
5.7 % |
-3.7 % |
12.7 % |
||
Stanislaus |
$499,000 |
$502,820 |
$475,000 |
-0.8 % |
5.1 % |
-18.2 % |
-0.4 % |
||
Tulare |
$405,000 |
$400,000 |
$382,990 |
1.3 % |
5.7 % |
7.1 % |
-3.8 % |
||
Far North |
|||||||||
Butte |
$450,000 |
$459,000 |
$456,500 |
-2.0 % |
-1.4 % |
-12.7 % |
-7.1 % |
||
Lassen |
$266,750 |
$285,000 |
$319,000 |
r |
-6.4 % |
-16.4 % |
-38.5 % |
-23.8 % |
|
Plumas |
$505,000 |
$550,000 |
$434,500 |
-8.2 % |
16.2 % |
-9.1 % |
0.0 % |
||
Shasta |
$390,000 |
$385,000 |
$380,000 |
1.3 % |
2.6 % |
-13.0 % |
6.6 % |
||
Siskiyou |
$332,500 |
$365,000 |
$365,000 |
-8.9 % |
-8.9 % |
34.4 % |
19.4 % |
||
Tehama |
$324,000 |
$380,000 |
$387,000 |
r |
-14.7 % |
-16.3 % |
-11.3 % |
4.4 % |
|
Trinity |
$250,000 |
$352,480 |
$240,500 |
-29.1 % |
4.0 % |
-81.3 % |
-62.5 % |
||
Other Calif. Counties |
|||||||||
Amador |
$460,000 |
$465,000 |
$415,000 |
-1.1 % |
10.8 % |
-13.2 % |
4.5 % |
||
Calaveras |
$542,500 |
$500,000 |
$456,750 |
8.5 % |
18.8 % |
-9.1 % |
2.9 % |
||
Del Norte |
$428,500 |
$463,000 |
$369,000 |
-7.5 % |
16.1 % |
-23.1 % |
33.3 % |
||
El Dorado |
$735,000 |
$655,000 |
$717,500 |
12.2 % |
2.4 % |
-7.6 % |
16.8 % |
||
Humboldt |
$419,500 |
$438,000 |
$450,000 |
-4.2 % |
-6.8 % |
0.9 % |
-5.0 % |
||
Lake |
$310,250 |
$306,250 |
$364,500 |
1.3 % |
-14.9 % |
3.1 % |
37.5 % |
||
Mariposa |
$375,000 |
$510,000 |
$450,000 |
-26.5 % |
-16.7 % |
-28.6 % |
-34.8 % |
||
Mendocino |
$545,000 |
$535,000 |
$467,000 |
1.9 % |
16.7 % |
-26.2 % |
2.3 % |
||
Mono |
$1,137,500 |
$881,000 |
$1,064,000 |
29.1 % |
6.9 % |
233.3 % |
0.0 % |
||
Nevada |
$575,000 |
$620,000 |
$549,500 |
-7.3 % |
4.6 % |
-18.5 % |
-11.8 % |
||
Sutter |
$461,000 |
$450,000 |
$460,000 |
2.4 % |
0.2 % |
-11.1 % |
19.1 % |
||
Tuolumne |
$385,000 |
$409,000 |
$455,000 |
-5.9 % |
-15.4 % |
-12.4 % |
5.4 % |
||
Yolo |
$637,500 |
$642,500 |
$635,000 |
-0.8 % |
0.4 % |
0.0 % |
22.5 % |
||
Yuba |
$466,900 |
$464,000 |
$440,000 |
0.6 % |
6.1 % |
-16.9 % |
-2.8 % |
||
r = revised |
|||||||||
July 2026 County Unsold Inventory and Days on Market
(Regional and condo sales data not seasonally adjusted)
July 2026 |
Unsold Inventory Index |
Median Time on Market |
||||||||
State/Region/County |
July 2026 |
June 2026 |
July 2025 |
July 2026 |
June 2026 |
July 2025 |
||||
Calif. Single-Family Homes |
3.4 |
3.1 |
3.7 |
26.0 |
23.0 |
28.0 |
||||
Calif. Condos/Townhomes |
4.2 |
4.4 |
4.5 |
35.0 |
34.0 |
34.0 |
||||
Los Angeles Metro Area |
3.6 |
3.4 |
3.9 |
30.0 |
29.0 |
30.0 |
||||
Central Coast |
3.3 |
3.4 |
3.9 |
26.0 |
21.0 |
22.0 |
||||
Central Valley |
3.4 |
3.2 |
3.6 |
26.0 |
23.0 |
27.0 |
||||
Far North |
5.1 |
4.3 |
5.2 |
21.0 |
19.0 |
32.0 |
||||
Inland Empire |
4.1 |
3.6 |
4.5 |
37.0 |
33.0 |
38.0 |
||||
San Francisco Bay Area |
2.3 |
2.1 |
2.7 |
22.0 |
17.0 |
24.0 |
||||
Southern California |
3.4 |
3.2 |
3.8 |
28.0 |
26.0 |
29.0 |
||||
San Francisco Bay Area |
||||||||||
Alameda |
2.0 |
1.9 |
2.4 |
15.0 |
13.0 |
16.0 |
||||
Contra Costa |
2.6 |
2.3 |
3.1 |
15.0 |
13.0 |
18.0 |
||||
Marin |
1.7 |
1.6 |
2.8 |
48.0 |
54.0 |
62.0 |
||||
Napa |
6.8 |
6.1 |
7.0 |
66.0 |
71.0 |
56.0 |
||||
San Francisco |
1.0 |
0.7 |
1.5 |
22.5 |
30.0 |
36.0 |
||||
San Mateo |
1.5 |
1.3 |
1.8 |
13.0 |
12.0 |
13.0 |
||||
Santa Clara |
1.9 |
1.7 |
1.9 |
13.0 |
11.0 |
13.0 |
||||
Solano |
3.1 |
2.8 |
3.6 |
42.5 |
44.5 |
49.0 |
||||
Sonoma |
3.4 |
3.4 |
3.7 |
62.0 |
55.0 |
63.0 |
||||
Southern California |
||||||||||
Imperial |
3.4 |
2.5 |
2.3 |
16.0 |
19.0 |
25.0 |
||||
Los Angeles |
3.5 |
3.5 |
3.7 |
26.0 |
25.0 |
27.0 |
||||
Orange |
3.1 |
2.8 |
3.3 |
26.0 |
25.0 |
28.0 |
||||
Riverside |
3.8 |
3.3 |
4.2 |
39.0 |
35.0 |
40.0 |
||||
San Bernardino |
4.5 |
4.3 |
5.2 |
34.0 |
28.0 |
35.0 |
||||
San Diego |
2.9 |
2.7 |
3.5 |
19.0 |
18.0 |
24.0 |
||||
Ventura |
3.2 |
2.9 |
3.5 |
36.0 |
39.0 |
41.0 |
||||
Central Coast |
||||||||||
Monterey |
3.9 |
4.0 |
4.2 |
20.0 |
15.0 |
22.5 |
||||
San Luis Obispo |
3.3 |
3.4 |
3.7 |
31.5 |
28.0 |
32.0 |
||||
Santa Barbara |
2.7 |
3.3 |
3.6 |
25.0 |
27.0 |
20.0 |
||||
Santa Cruz |
3.4 |
3.0 |
4.0 |
19.0 |
15.0 |
16.0 |
||||
Central Valley |
||||||||||
Fresno |
3.5 |
3.3 |
3.5 |
25.0 |
24.0 |
17.0 |
||||
Glenn |
4.4 |
2.8 |
3.1 |
34.0 |
48.5 |
40.0 |
||||
Kern |
3.0 |
2.9 |
3.2 |
28.0 |
22.0 |
28.0 |
||||
Kings |
3.3 |
3.5 |
3.0 |
r |
21.0 |
20.0 |
35.5 |
r |
||
Madera |
6.5 |
5.8 |
6.1 |
27.0 |
33.0 |
38.5 |
||||
Merced |
2.9 |
3.1 |
3.8 |
32.0 |
34.5 |
27.0 |
||||
Placer |
3.0 |
3.1 |
3.5 |
29.0 |
24.5 |
30.0 |
||||
Sacramento |
3.1 |
2.8 |
3.0 |
24.5 |
22.0 |
27.0 |
||||
San Benito |
3.5 |
3.3 |
4.5 |
18.0 |
26.0 |
20.0 |
||||
San Joaquin |
3.9 |
3.6 |
4.5 |
27.0 |
23.5 |
31.0 |
||||
Stanislaus |
3.5 |
2.9 |
3.9 |
19.5 |
21.0 |
25.0 |
||||
Tulare |
4.0 |
4.2 |
3.3 |
28.0 |
20.5 |
33.0 |
||||
Far North |
||||||||||
Butte |
3.5 |
3.1 |
3.2 |
26.0 |
30.5 |
30.0 |
||||
Lassen |
9.7 |
5.7 |
7.9 |
r |
29.0 |
16.0 |
39.0 |
r |
||
Plumas |
8.4 |
7.7 |
8.8 |
23.0 |
28.0 |
44.5 |
||||
Shasta |
4.1 |
3.6 |
4.6 |
17.0 |
12.0 |
28.0 |
||||
Siskiyou |
7.4 |
9.5 |
8.8 |
35.0 |
40.0 |
30.5 |
||||
Tehama |
5.7 |
5.1 |
5.1 |
r |
23.0 |
50.0 |
47.0 |
r |
||
Trinity |
36.0 |
6.5 |
15.6 |
118.0 |
43.5 |
34.0 |
||||
Other Calif. Counties |
||||||||||
Amador |
7.0 |
6.1 |
7.6 |
61.0 |
56.0 |
58.0 |
||||
Calaveras |
8.1 |
7.1 |
6.3 |
57.5 |
27.0 |
46.5 |
||||
Del Norte |
4.9 |
4.0 |
7.6 |
77.5 |
29.0 |
61.0 |
||||
El Dorado |
4.1 |
3.8 |
5.5 |
32.0 |
29.0 |
36.0 |
||||
Humboldt |
5.7 |
5.5 |
5.6 |
23.0 |
24.0 |
29.5 |
||||
Lake |
7.3 |
8.0 |
11.2 |
46.5 |
55.5 |
60.0 |
||||
Mariposa |
9.0 |
6.2 |
6.5 |
33.0 |
38.0 |
24.0 |
||||
Mendocino |
10.1 |
7.3 |
10.8 |
89.0 |
70.0 |
95.0 |
||||
Mono |
3.0 |
11.7 |
4.3 |
9.0 |
15.0 |
12.0 |
||||
Nevada |
4.6 |
3.8 |
5.2 |
28.0 |
26.0 |
40.0 |
||||
Sutter |
4.3 |
3.5 |
4.6 |
21.0 |
25.0 |
30.0 |
||||
Tuolumne |
6.0 |
5.3 |
7.6 |
34.5 |
19.0 |
53.5 |
||||
Yolo |
2.5 |
2.4 |
3.8 |
22.0 |
22.0 |
33.5 |
||||
Yuba |
5.0 |
4.0 |
5.0 |
40.0 |
39.0 |
32.0 |
||||
r = revised
SOURCE CALIFORNIA ASSOCIATION OF REALTORS® (C.A.R.)




Share this article