Low rates, flexibility to work from home drives California home-buying interest to levels not seen since the last decade, C.A.R. reports
- Existing, single-family home sales totaled 508,820 in November on a seasonally adjusted annualized rate, up 5.0 percent from October and up 26.3 percent from November 2019.
- November's statewide median home price was $699,000 down 1.7 percent from October and up 18.5 percent from November 2019.
- Year-to-date statewide home sales were up 1.3 percent in November.

LOS ANGELES, Dec. 17, 2020 /PRNewswire/ -- Defying an otherwise struggling economy, California home sales remained red hot in November, breaking the 500,000 sales benchmark for the first time since January 2009 and reaching the highest level in 15 years, the CALIFORNIA ASSOCIATION OF REALTORS® (C.A.R.) said today.
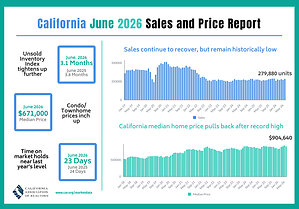
Infographic: https://www.car.org/marketing/clients/infographics/2020-11%20Sales%20and%20Price
Closed escrow sales of existing, single-family detached homes in California totaled a seasonally adjusted annualized rate of 508,820 units in November, according to information collected by C.A.R. from more than 90 local REALTOR® associations and MLSs statewide. The statewide annualized sales figure represents what would be the total number of homes sold during 2020 if sales maintained the November pace throughout the year. It is adjusted to account for seasonal factors that typically influence home sales.
November sales rose 5.0 percent from 484,510 in October and were up 26.3 percent from a year ago, when 402,880 homes were sold on an annualized basis. The year-over-year, double-digit sales gain was the fourth consecutive and the largest yearly gain since May 2009.
"Home-buying interest is at levels that we have not seen for years, setting the stage for a stronger-than-expected comeback that fully recovered all the sales that the market lost in the first half of the year due to the pandemic," said 2021 C.A.R. President Dave Walsh, vice president and manager of the Compass San Jose office. "Housing supply remains an issue, however, as we will likely to see a shortage of homes for sale in the near term, which will put upward pressure on prices and dampen affordability for those who haven't been able to take advantage of low rates."
After breaking the $700,000 benchmark for the past three months, California's median home price dipped 1.7 percent on a month-to-month basis to $$699,000 in November, down from October's $711,300. Home prices, however, continued to gain on a year-over-year basis with the statewide median price surging 18.5 percent from $589,770 recorded last November. The double-digit increase from last year was the fourth in a row and the highest 12-month gain since February 2014. The gain was also higher than the six-month average of 9.7 percent observed between May 2020 and October 2020.
"California's housing market continues to be the bright spot in the economy, but the direction and pace of the recovery will hinge on the coronavirus pandemic and the distribution of the vaccine in the coming months," said C.A.R. Senior Vice President and Chief Economist Leslie Appleton-Young. "The rise in COVID-19 cases and tighter constraints on economic activity recently imposed will likely have implications for the housing market as renters and homeowners face adverse impacts to their incomes, which is why Congress should pass additional relief for renters, homeowners, and workers as soon as possible."
Perhaps due to rising cases of the Coronavirus, fewer consumers said it is a good time to sell in December, according to C.A.R.'s monthly Consumer Housing Sentiment Index. Conducted in earlier this month, the poll found that 55 percent of consumers said it is a good time to sell, down from 59 percent a month ago, but up from 51 percent a year ago. Meanwhile, low interest rates continue to fuel the optimism for homebuying; just over one-fourth (27 percent) of the consumers who responded to the poll believed that now is a good time to buy a home, up from last year, when 24 percent said it was a good time to buy a home.
Other key points from C.A.R.'s November 2020 resale housing report include:
- At the regional level, sales continued to increase by double-digits in most major regions in November, at a year-over-year growth rate of more than 18 percent in all but the Far North. The San Francisco Bay Area had the highest gain of 34.4 percent over last year, followed by the Central Coast (33.4 percent), Southern California (19.1 percent) and the Central Valley (18.3 percent). The Far North region had a more moderate sales performance in November compared to other regions, but still improved 3.1 percent from a year ago. On a year-to-date basis, sales in the Central Coast region has already surpassed 2019's level by 4.3 percent, while Southern California (-0.7 percent), the San Francisco Bay Area (-1.2 percent), the Central Valley (-1.5 percent) and the Far North (-2.6 percent) continued to trail slightly behind last year's level.
- With homebuying interest remaining high, sales in resort communities continued to exhibit robust gain from the prior year. Mammoth Lakes had the biggest increase in November, with sales surging 400 percent from November 2019, followed by South Lake Tahoe (81.4 percent), Big Bear (73.9 percent), and Lake Arrowhead (58.1 percent). Through the first 11 months of the year, resort markets have been outperforming the state in general. On a year-to-date basis, sales increased 97 percent in Big Bear, 51.5 percent in South Lake Tahoe, 48.4 percent in Lake Arrowhead, and 31.7 percent in Mammoth Lakes.
- At the regional level, all major regions posted an increase in the median price from a year ago by more than 10 percent. The San Francisco Bay Area median price remained at its record high in November, rising 18.9 percent from last year. Five of the nine counties in the region continued to increase by double digits, while the rest were up more modestly. The Central Coast region had the second largest median price increase at 18.7 percent, followed by the Central Valley (17.6 percent), Southern California (14.4 percent), and the Far North (13.6 percent).
- All but one of the 51 counties C.A.R. tracks reported a year-over-year price gain, with 37 of them increasing by 10 percent or more. Mono had the highest price growth, with a year-over-year increase of 45 percent. Mariposa was the only county with a drop in its median price, declining 8.8 percent from the same month last year.
- Price growth in many of the resort communities continued to outpace the rest of California. In November, Big Bear's median price jumped from last year by 40.8 percent, followed by South Lake Tahoe (39.6 percent), and Lake Arrowhead (32.0 percent). Mammoth Lakes had a slight price decline of 2.5 percent in November from last year. Home prices in these areas are expected to grow solidly in the short term, as demand remains on an upward trend and available supply continues to decline rapidly.
- With a resurgence in COVID-19 cases in recent weeks and the market entering the traditional holiday season, active listings declined from the prior month as expected, contributing to a substantial decline in inventory. Active listings fell 46.6 percent from last year and continued to drop more than 40 percent on a year-over-year basis for the sixth straight month. The Unsold Inventory Index (UII) fell sharply from 3.1 months in November 2019 to 1.9 months this November. The index indicates the number of months it would take to sell the supply of homes on the market at the current rate of sales.
- Except for the Bay Area, all major regions experienced a year-over-year decline in active listings of 40 percent or more in November. The Central Valley had the biggest year-over-year drop of 53.3 percent in November, followed by Southern California (49.0 percent), Central Coast (-46.3 percent), Far North (-40.1 percent), and the San Francisco Bay Area (-18.7 percent).
- All but two of the 51 counties reported by C.A.R. experienced a year-over-year decline in active listings in November. Madera had the biggest drop from last year, with a decline of 69.9 percent, followed by San Joaquin (-69.3 percent) and Sutter (-67.3 percent). Twenty-seven counties had less than half the active listings they had in November 2019. San Francisco (73.8 percent) and San Mateo (18.2 percent) remained the only counties in California with an increase in active listings from the prior year.
- The median number of days it took to sell a California single-family home was 9 days in November, down from 25 in November 2019. The November 2020 figure was the lowest ever recorded.
- C.A.R.'s statewide sales-price-to-list-price ratio* was 100.5 percent in November 2020 and 98.4 percent in November 2019. The ratio in November 2020 was the highest ever recorded in the past 30 years, another indication that shows how the supply and demand imbalance is impacting the California housing market.
- The statewide average price per square foot** for an existing single-family home was $332 in November 2020 and $288 in November 2019. The November 2020 figure was the highest since August 2007.
- The 30-year, fixed-mortgage interest rate averaged 2.77 percent in November, down from 3.70 percent in November 2019, according to Freddie Mac. The five-year, adjustable mortgage interest rate was an average of 3.0 percent, compared to 3.41 percent in November 2019.
Note: The County MLS median price and sales data in the tables are generated from a survey of more than 90 associations of REALTORS® throughout the state and represent statistics of existing single-family detached homes only. County sales data are not adjusted to account for seasonal factors that can influence home sales. Movements in sales prices should not be interpreted as changes in the cost of a standard home. The median price is where half sold for more and half sold for less; medians are more typical than average prices, which are skewed by a relatively small share of transactions at either the lower end or the upper end. Median prices can be influenced by changes in cost, as well as changes in the characteristics and the size of homes sold. The change in median prices should not be construed as actual price changes in specific homes.
*Sales-to-list-price ratio is an indicator that reflects the negotiation power of home buyers and home sellers under current market conditions. The ratio is calculated by dividing the final sales price of a property by its last list price and is expressed as a percentage. A sales-to-list ratio with 100 percent or above suggests that the property sold for more than the list price, and a ratio below 100 percent indicates that the price sold below the asking price.
**Price per square foot is a measure commonly used by real estate agents and brokers to determine how much a square foot of space a buyer will pay for a property. It is calculated as the sale price of the home divided by the number of finished square feet. C.A.R. currently tracks price-per-square foot statistics for 50 counties.
Leading the way…® in California real estate for more than 110 years, the CALIFORNIA ASSOCIATION OF REALTORS® (www.car.org) is one of the largest state trade organizations in the United States with more than 200,000 members dedicated to the advancement of professionalism in real estate. C.A.R. is headquartered in Los Angeles.
November 2020 County Sales and Price Activity |
|||||||||
November 2020 |
Median Sold Price of Existing Single-Family Homes |
Sales |
|||||||
State/Region/County |
Nov. 2020 |
Oct. 2020 |
Nov. 2019 |
Price MTM% Chg |
Price YTY% Chg |
Sales MTM% Chg |
Sales YTY% Chg |
||
Calif. Single-family homes |
$699,000 |
$711,300 |
$589,770 |
-1.7% |
18.5% |
5.0% |
26.3% |
||
Calif. Condo/Townhomes |
$520,000 |
$520,000 |
$485,110 |
0.0% |
7.2% |
-9.2% |
30.0% |
||
Los Angeles Metro Area |
$630,000 |
$632,710 |
$550,000 |
-0.4% |
14.5% |
-15.3% |
18.1% |
||
Central Coast |
$825,000 |
$850,000 |
$695,000 |
-2.9% |
18.7% |
-14.9% |
33.4% |
||
Central Valley |
$400,000 |
$395,000 |
$340,000 |
1.3% |
17.6% |
-10.7% |
18.3% |
||
Far North |
$340,000 |
$344,000 |
$299,250 |
-1.2% |
13.6% |
-22.1% |
3.1% |
||
Inland Empire |
$450,000 |
$445,000 |
$379,000 |
1.1% |
18.7% |
-14.3% |
20.7% |
||
San Francisco Bay Area |
$1,100,000 |
$1,100,000 |
$925,000 |
0.0% |
18.9% |
-7.3% |
34.4% |
||
Southern California |
$657,820 |
$657,750 |
$575,000 |
0.0% |
14.4% |
-13.9% |
19.1% |
||
San Francisco Bay Area |
|||||||||
Alameda |
$1,049,040 |
$1,049,000 |
$910,000 |
0.0% |
15.3% |
0.7% |
39.6% |
||
Contra Costa |
$810,000 |
$787,250 |
$640,000 |
2.9% |
26.6% |
-3.4% |
49.9% |
||
Marin |
$1,425,000 |
$1,468,500 |
$1,270,000 |
-3.0% |
12.2% |
-5.2% |
40.6% |
||
Napa |
$824,500 |
$749,380 |
$669,000 |
10.0% |
23.2% |
-28.4% |
28.0% |
||
San Francisco |
$1,697,500 |
$1,625,000 |
$1,619,000 |
4.5% |
4.8% |
-11.0% |
28.6% |
||
San Mateo |
$1,650,000 |
$1,680,000 |
$1,595,000 |
-1.8% |
3.4% |
-17.6% |
28.3% |
||
Santa Clara |
$1,383,000 |
$1,442,500 |
$1,259,000 |
-4.1% |
9.8% |
-9.2% |
34.4% |
||
Solano |
$505,250 |
$508,000 |
$462,980 |
-0.5% |
9.1% |
-3.4% |
16.6% |
||
Sonoma |
$715,000 |
$720,000 |
$650,000 |
-0.7% |
10.0% |
-14.6% |
14.2% |
||
Southern California |
|||||||||
Los Angeles |
$664,160 |
$728,160 |
$594,840 |
-8.8% |
11.7% |
-17.6% |
10.5% |
||
Orange |
$930,000 |
$930,000 |
$822,000 |
0.0% |
13.1% |
-15.6% |
24.6% |
||
Riverside |
$490,000 |
$485,000 |
$425,000 |
1.0% |
15.3% |
-13.9% |
23.0% |
||
San Bernardino |
$380,250 |
$365,000 |
$315,000 |
4.2% |
20.7% |
-14.8% |
17.1% |
||
San Diego |
$740,000 |
$749,000 |
$659,000 |
-1.2% |
12.3% |
-7.8% |
23.2% |
||
Ventura |
$760,000 |
$750,000 |
$660,000 |
1.3% |
15.2% |
-3.8% |
40.9% |
||
Central Coast |
|||||||||
Monterey |
$850,000 |
$850,000 |
$720,000 |
0.0% |
18.1% |
-11.8% |
30.7% |
||
San Luis Obispo |
$699,500 |
$700,500 |
$615,000 |
-0.1% |
13.7% |
-19.5% |
34.2% |
||
Santa Barbara |
$955,000 |
$1,037,500 |
$661,500 |
-8.0% |
44.4% |
-15.4% |
38.7% |
||
Santa Cruz |
$1,050,000 |
$1,060,000 |
$875,000 |
-0.9% |
20.0% |
-9.8% |
27.9% |
||
Central Valley |
|||||||||
Fresno |
$323,500 |
$331,500 |
$291,500 |
-2.4% |
11.0% |
-10.6% |
13.8% |
||
Glenn |
$334,750 |
$287,500 |
$330,000 |
16.4% |
1.4% |
-12.5% |
-39.1% |
||
Kern |
$290,000 |
$295,000 |
$258,000 |
-1.7% |
12.4% |
-7.8% |
27.3% |
||
Kings |
$265,000 |
$290,500 |
$258,000 |
-8.8% |
2.7% |
-22.7% |
-11.5% |
||
Madera |
$320,000 |
$302,750 |
$295,500 |
5.7% |
8.3% |
-1.2% |
29.5% |
||
Merced |
$315,500 |
$322,500 |
$275,000 |
-2.2% |
14.7% |
-30.6% |
-11.5% |
||
Placer |
$552,650 |
$548,000 |
$489,800 |
0.8% |
12.8% |
-18.4% |
26.8% |
||
Sacramento |
$442,500 |
$440,000 |
$385,000 |
0.6% |
14.9% |
-9.1% |
23.3% |
||
San Benito |
$665,590 |
$634,000 |
$595,000 |
5.0% |
11.9% |
35.2% |
55.3% |
||
San Joaquin |
$441,500 |
$431,440 |
$380,000 |
2.3% |
16.2% |
-14.8% |
18.9% |
||
Stanislaus |
$389,000 |
$377,000 |
$326,500 |
3.2% |
19.1% |
-9.0% |
11.3% |
||
Tulare |
$280,000 |
$283,000 |
$240,000 |
-1.1% |
16.7% |
-1.3% |
4.4% |
||
Far North |
|||||||||
Butte |
$405,000 |
$401,500 |
$350,000 |
0.9% |
15.7% |
-12.5% |
-17.9% |
||
Lassen |
$231,250 |
$194,500 |
$222,500 |
18.9% |
3.9% |
90.0% |
58.3% |
||
Plumas |
$385,000 |
$385,000 |
$275,000 |
0.0% |
40.0% |
-40.0% |
87.5% |
||
Shasta |
$327,250 |
$344,900 |
$285,000 |
-5.1% |
14.8% |
-24.3% |
0.9% |
||
Siskiyou |
$263,000 |
$286,000 |
$242,500 |
-8.0% |
8.5% |
-28.2% |
70.0% |
||
Tehama |
$371,000 |
$283,500 |
$259,250 |
30.9% |
43.1% |
-44.6% |
-29.5% |
||
Other Calif. Counties |
|||||||||
Amador |
$360,000 |
$366,500 |
$348,500 |
-1.8% |
3.3% |
-11.5% |
-2.8% |
||
Calaveras |
$407,120 |
$393,640 |
$343,500 |
3.4% |
18.5% |
-7.9% |
77.2% |
||
Del Norte |
$308,750 |
$325,000 |
$252,500 |
-5.0% |
22.3% |
-42.9% |
42.9% |
||
El Dorado |
$585,000 |
$559,000 |
$485,000 |
4.7% |
20.6% |
-10.3% |
54.0% |
||
Humboldt |
$351,000 |
$379,500 |
$328,190 |
-7.5% |
7.0% |
-15.8% |
3.2% |
||
Lake |
$317,000 |
$325,000 |
$297,500 |
-2.5% |
6.6% |
-2.3% |
26.5% |
||
Mariposa |
$374,000 |
$375,000 |
$410,000 |
-0.3% |
-8.8% |
-26.5% |
8.7% |
||
Mendocino |
$494,000 |
$529,500 |
$400,290 |
-6.7% |
23.4% |
7.8% |
7.8% |
||
Mono |
$806,000 |
$844,500 |
$556,000 |
-4.6% |
45.0% |
-12.5% |
133.3% |
||
Nevada |
$466,250 |
$492,500 |
$458,500 |
-5.3% |
1.7% |
-13.8% |
0.0% |
||
Sutter |
$370,000 |
$346,050 |
$325,000 |
6.9% |
13.8% |
1.4% |
9.2% |
||
Tuolumne |
$337,500 |
$349,500 |
$275,500 |
-3.4% |
22.5% |
-28.9% |
62.5% |
||
Yolo |
$511,000 |
$517,250 |
$446,710 |
-1.2% |
14.4% |
-8.6% |
30.6% |
||
Yuba |
$352,500 |
$350,000 |
$319,500 |
0.7% |
10.3% |
10.5% |
7.7% |
||
r = revised
NA = not available
November 2020 County Unsold Inventory and Days on Market |
||||||||||
November 2020 |
Unsold Inventory Index |
Median Time on Market |
||||||||
State/Region/County |
Nov. 2020 |
Oct. 2020 |
Nov. 2019 |
Nov. 2020 |
Oct. 2020 |
Nov. 2019 |
||||
Calif. Single-family homes |
1.9 |
2.0 |
3.1 |
9.0 |
10.0 |
25.0 |
||||
Calif. Condo/Townhomes |
2.2 |
2.4 |
2.9 |
14.0 |
14.0 |
27.0 |
||||
Los Angeles Metro Area |
2.1 |
2.1 |
3.3 |
10.0 |
10.0 |
29.0 |
||||
Central Coast |
2.1 |
2.1 |
4.1 |
10.0 |
13.0 |
30.0 |
||||
Central Valley |
1.6 |
1.8 |
2.8 |
7.0 |
7.0 |
19.0 |
||||
Far North |
3.0 |
2.6 |
4.5 |
14.5 |
19.0 |
33.0 |
||||
Inland Empire |
2.1 |
2.0 |
3.9 |
11.0 |
11.0 |
34.0 |
||||
San Francisco Bay Area |
1.6 |
1.8 |
2.1 |
11.0 |
11.0 |
22.0 |
||||
Southern California |
2.0 |
2.0 |
3.2 |
9.0 |
9.0 |
26.0 |
||||
San Francisco Bay Area |
||||||||||
Alameda |
1.3 |
1.6 |
1.6 |
8.0 |
10.0 |
16.0 |
||||
Contra Costa |
1.3 |
1.6 |
2.1 |
7.0 |
8.0 |
17.0 |
||||
Marin |
1.5 |
2.0 |
2.2 |
25.5 |
24.0 |
45.0 |
||||
Napa |
3.7 |
3.1 |
5.8 |
35.0 |
38.0 |
57.0 |
||||
San Francisco |
2.0 |
2.2 |
1.7 |
18.0 |
14.0 |
17.0 |
||||
San Mateo |
1.8 |
1.8 |
1.8 |
11.0 |
10.0 |
13.0 |
||||
Santa Clara |
1.4 |
1.6 |
1.7 |
8.0 |
8.0 |
18.0 |
||||
Solano |
1.7 |
1.9 |
2.8 |
27.5 |
28.0 |
39.0 |
||||
Sonoma |
2.7 |
2.7 |
3.4 |
33.0 |
37.0 |
51.0 |
||||
Southern California |
||||||||||
Los Angeles |
2.1 |
2.1 |
2.9 |
9.0 |
9.0 |
22.0 |
||||
Orange |
2.0 |
2.0 |
3.1 |
10.0 |
10.0 |
29.0 |
||||
Riverside |
2.1 |
2.1 |
3.9 |
11.0 |
11.0 |
33.0 |
||||
San Bernardino |
2.0 |
2.0 |
3.8 |
10.0 |
12.0 |
38.0 |
||||
San Diego |
1.6 |
1.8 |
2.7 |
7.0 |
7.0 |
17.0 |
||||
Ventura |
1.7 |
2.0 |
4.4 |
27.0 |
30.0 |
53.0 |
||||
Central Coast |
||||||||||
Monterey |
2.3 |
2.3 |
4.2 |
11.0 |
13.0 |
30.0 |
||||
San Luis Obispo |
2.2 |
2.2 |
4.2 |
10.5 |
13.0 |
32.0 |
||||
Santa Barbara |
2.0 |
2.0 |
4.4 |
10.0 |
14.0 |
29.5 |
||||
Santa Cruz |
2.0 |
2.1 |
3.2 |
8.0 |
10.0 |
28.0 |
||||
Central Valley |
||||||||||
Fresno |
1.8 |
1.8 |
3.4 |
7.0 |
7.0 |
19.0 |
||||
Glenn |
3.4 |
3.8 |
3.5 |
26.5 |
4.0 |
24.0 |
||||
Kern |
2.1 |
2.2 |
2.9 |
8.0 |
8.0 |
15.5 |
||||
Kings |
2.0 |
1.8 |
2.6 |
6.0 |
6.0 |
22.5 |
||||
Madera |
2.1 |
2.7 |
5.3 |
14.0 |
13.0 |
34.0 |
||||
Merced |
2.0 |
1.6 |
3.5 |
10.5 |
10.0 |
20.0 |
||||
Placer |
1.5 |
1.5 |
2.5 |
8.0 |
7.0 |
24.0 |
||||
Sacramento |
1.3 |
1.5 |
2.2 |
7.0 |
6.0 |
15.0 |
||||
San Benito |
1.4 |
2.5 |
2.9 |
9.0 |
9.0 |
41.0 |
||||
San Joaquin |
1.4 |
1.5 |
3.1 |
7.0 |
7.0 |
26.0 |
||||
Stanislaus |
1.6 |
1.7 |
2.4 |
7.0 |
7.0 |
17.5 |
||||
Tulare |
2.0 |
2.2 |
3.1 |
7.0 |
10.0 |
29.0 |
||||
Far North |
||||||||||
Butte |
2.5 |
2.4 |
2.6 |
7.0 |
11.0 |
20.0 |
||||
Lassen |
2.5 |
5.0 |
5.6 |
72.5 |
96.5 |
90.5 |
||||
Plumas |
3.8 |
2.6 |
11.8 |
118.0 |
127.0 |
85.5 |
||||
Shasta |
3.0 |
2.6 |
4.2 |
8.0 |
9.0 |
29.5 |
||||
Siskiyou |
2.9 |
2.3 |
9.4 |
11.0 |
16.0 |
57.0 |
||||
Tehama |
5.1 |
2.8 |
4.8 |
41.0 |
34.0 |
32.5 |
||||
Other Calif. Counties |
||||||||||
Amador |
2.7 |
3.0 |
4.5 |
17.0 |
19.0 |
48.0 |
||||
Calaveras |
1.8 |
2.1 |
6.5 |
62.5 |
53.0 |
59.0 |
||||
Del Norte |
5.3 |
3.5 |
11.0 |
116.0 |
94.0 |
117.5 |
||||
El Dorado |
1.6 |
2.0 |
4.2 |
18.0 |
25.0 |
52.5 |
||||
Humboldt |
2.2 |
2.1 |
4.0 |
12.5 |
13.5 |
32.0 |
||||
Lake |
3.5 |
3.7 |
6.4 |
27.0 |
31.0 |
54.0 |
||||
Mariposa |
3.1 |
2.7 |
4.3 |
34.0 |
29.5 |
29.0 |
||||
Mendocino |
3.3 |
4.0 |
5.2 |
51.0 |
51.5 |
74.5 |
||||
Mono |
2.5 |
3.0 |
12.7 |
105.0 |
85.0 |
122.0 |
||||
Nevada |
2.7 |
2.7 |
3.7 |
11.5 |
12.0 |
45.5 |
||||
Sutter |
1.4 |
2.0 |
3.0 |
6.0 |
9.0 |
18.0 |
||||
Tuolumne |
2.8 |
2.5 |
8.3 |
24.5 |
23.0 |
44.5 |
||||
Yolo |
1.9 |
2.1 |
3.4 |
9.0 |
8.0 |
18.0 |
||||
Yuba |
1.2 |
1.7 |
2.8 |
9.0 |
10.5 |
28.5 |
||||
r = revised
NA = not available
SOURCE CALIFORNIA ASSOCIATION OF REALTORS® (C.A.R.)


Share this article