Aritzia Reports Fourth Quarter and Full Year Fiscal 2022 Results and Planned CEO Succession
Q4 net revenue increased by 66.1% from last year to $444.3 million
Q4 net income increased by 113.0% from last year to $34.2 million
Q4 Adjusted EBITDA(1) increased by 88.3% from last year to $66.3 million
Founder and CEO Brian Hill will transition to Executive Chair on May 21, 2022, and Jennifer Wong to become Chief Executive Officer of Aritzia at that time
VANCOUVER, BC, May 5, 2022 /PRNewswire/ - Aritzia Inc. (TSX: ATZ) "Aritzia" or the "Company"), a vertically integrated, innovative design house offering Everyday Luxury online and in its boutiques, today announced its financial results for fourth quarter and full year fiscal 2022 ended February 27, 2022.

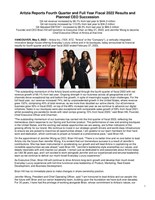
"The outstanding momentum of the Aritzia brand continued through the fourth quarter of fiscal 2022 with net revenue growth of 66.1% from last year. Ongoing strength in our business across all geographies and all channels drove exceptional top and bottom line growth, in spite of meaningful supply chain challenges. For the full fiscal year, our revenue increased 74%, led by unprecedented growth in the United States, where revenue grew 132%, comprising 45% of total revenue, as we more than doubled our active clients. Our eCommerce business grew 33% in fiscal 2022, on top of the 88% increase last year as we continue to advance our digital initiatives. Sales in our boutiques were also exceptional with comparable sales growth of 59% from fiscal 2021, whilst exceeding pre-pandemic levels with retail comps growing 15% from fiscal 2020," said Brian Hill, Founder, Chief Executive Officer and Chairman.
"The outstanding momentum of our business has carried into the first quarter of fiscal 2023, reflecting the tremendous client response to our Spring and Summer product. The performance of new and existing boutiques in the United States, and the exciting real estate opportunies we are seeing, are further indicators of the growing affinity for our brand. We continue to invest in our strategic growth drivers and world-class infrastructure to ensure we are poised to maximize all opportunities ahead. I am grateful to our team members for their hard work and dedication, which continues to propel us forward at a phenomenal pace," said Brian Hill.
On the appointment of Jennifer Wong as CEO, Brian Hill said, "There is no better time and no one better to lead Aritzia into the future than Jennifer Wong. It is evident that our tremendous success is a result of Jennifer's contributions. She has been instrumental in accelerating our growth and will lead Aritzia in capitalizing on the incredible opportunities we see ahead." Brian Hill continued, "Jennifer's leadership style exemplifies our values, and deeply resonates with and inspires our people. I remain just as dedicated to and passionate about Aritzia today as I did 38 years ago, and I am excited to work alongside Jennifer and our experienced and tenured leadership team as we continue to deliver our much-loved Everyday Luxury experience."
As Executive Chair, Brian Hill will continue to drive Aritzia's long-term growth and develop their much-loved Everyday Luxury experience with full-time functional area leadership of Product, Marketing, Real Estate Development, and Business Development.
Brian Hill has no immediate plans to make changes in share ownership position.
Jennifer Wong, President and Chief Operating Officer, said "I am honoured to lead Aritzia and our people into the future with Brian and our senior leadership team, building upon the foundation we have built over decades. For 35 years, I have had the privilege of working alongside Brian, whose commitment to Aritzia's values, our people, clients, and the communities we serve is truly extraordinary. I would like to thank our dedicated team, who have been pivotal to our success, our Board who have diligently laid the foundation for a seamless transition, and Brian for his ongoing mentorship. I am excited to continue advancing Aritzia's business and delivering on the incredible growth opportunities we see ahead."
As CEO, Jennifer Wong will lead Aritzia's people and business into our bright future. Jennifer will continue to lead our business management functions and assume leadership of our sales channels, with oversight of eCommerce immediately and Retail coming in due course.
John Currie, Lead Independent Director of Aritzia, said, "We are thrilled to appoint Jennifer Wong as CEO. There is nobody better suited to lead Aritzia into its next phase of growth. Over the last 35 years, Jennifer has been instrumental to our success, building credibility both internally and externally. Jennifer has already taken on numerous CEO responsibilities, as we have been laying the foundation for a seamless transition for years. Brian's continued involvement in the brand and business, matched by Jennifer's long-term lasting approach to strategic growth, ensures Aritzia is poised for a bright future."
The Board has been involved throughout the entire succession planning process and worked with Aritzia's leadership team to lay the foundation for an effective and seamless transition.
Fourth Quarter Highlights
- Net revenue increased by 66.1% to $444.3 million from Q4 2021 and 61.3% from Q4 2020
- USA revenue increased by 108.8% to $216.8 million from Q4 2021 and 127.9% from Q4 2020, comprising 48.8% of net revenue in Q4 2022
- eCommerce revenue increased by 21.4% to $182.0 million from Q4 2021 and 119.9% from Q4 2020, comprising 41.0% of net revenues in Q4 2022
- Retail revenue increased by 123.0% to $262.4 million from Q4 2021 and 36.2% from Q4 2020, achieving comparable sales growth(1) of 60% compared to Q4 2021 and 13% compared to pre-COVID-19 Q4 2020
- Gross profit margin(1) increased to 40.4% from 38.5% in Q4 2021 and 37.3% in Q4 2020
- Net income increased by 113.0% to $34.2 million from $16.1 million
- Adjusted EBITDA(1) increased to $66.3 million from $35.2 million in Q4 2021 and $42.4 million in Q4 2020
- Adjusted Net Income(1) of $0.34 per diluted share, compared to $0.16 per diluted share in Q4 2021 and $0.21 per diluted share in Q4 2020
(1) |
Unless otherwise indicated, all amounts are expressed in Canadian dollars. The Company's fourth quarter results include the consolidation of CYC Design Corporation ("CYC") which closed on June 25, 2021. Due to the material impact of COVID-19 on business operations in fiscal 2021 and 2022, certain references to Q4 2020 and fiscal 2020 have been included where Management deems to be a more meaningful measurement of the Company's performance. Certain metrics, including those expressed on an adjusted or comparable basis, are non-IFRS measures or supplementary measures. See "Non-IFRS Measures including Retail Industry Metrics" and "Selected Consolidated Financial Information". |
Strategic Accomplishments for Fiscal 2022
- Grew active US clients by over 100% in the 12 month period
- Achieved 131.8% growth in USA revenue, through strength in both our boutiques and eCommerce
- Drove continued momentum growing eCommerce revenue by 32.5% on top of 88.3% growth last year, to comprise 37.8% of net revenue in fiscal 2022
- Strategically managed global supply chain disruptions to ensure product availability to meet demand
- Opened six new boutiques and repositioned six existing boutiques in premier real estate locations
- Launched store inventory visibility, digital gift cards and other digital capabilities as we accelerated investments across infrastructure and talent to support future growth
- Advanced initiatives to support Aritzia's communities, cultivate diversity and enhance sustainability
Fourth Quarter Results Compared to Q4 2021
(in thousands of Canadian dollars, unless otherwise noted) |
Q4 2022 13 weeks |
Q4 2021 13 weeks |
Variance Q4 2022 to Q4 2021 |
||||||
% |
% pts |
||||||||
eCommerce revenue |
$ |
181,968 |
41.0% |
$ |
149,864 |
56.0% |
21.4% |
||
Retail revenue |
262,354 |
59.0% |
117,661 |
44.0% |
123.0% |
||||
Net revenue |
444,322 |
100.0% |
267,525 |
100.0% |
66.1% |
||||
Gross profit |
179,506 |
40.4% |
102,925 |
38.5% |
74.4% |
1.9% |
|||
SG&A |
120,221 |
27.1% |
72,357 |
27.0% |
66.1% |
0.1% |
|||
Net income |
$ |
34,225 |
7.7% |
$ |
16,070 |
6.0% |
113.0% |
1.7% |
|
Net income per diluted share |
$ |
0.29 |
$ |
0.14 |
107.1% |
||||
Adjusted EBITDA(1) |
$ |
66,303 |
14.9% |
$ |
35,205 |
13.2% |
88.3% |
1.7% |
|
Adjusted Net Income(1) per diluted share |
$ |
0.34 |
$ |
0.16 |
112.5% |
||||
Net revenue increased by 66.1% to $444.3 million, compared to $267.5 million in Q4 2021. The Company continues to see an unprecedented acceleration of sales in the United States, where net revenues increased by 108.8% to C$216.8 million, compared to C$103.8 million in Q4 2021.
- eCommerce revenue increased by 21.4% to $182.0 million, compared to $149.9 million in Q4 2021. The Company's eCommerce business continued its momentum, building on the 81.1% increase in Q4 2021.
- Retail revenue increased by 123.0% to $262.4 million, compared to $117.7 million in Q4 2021. The increase in revenue was led by outstanding performance of our comparable and new boutiques in the United States, strong double digit comparable sales growth(1) in Canada, as well as boutique revenue from 39 of our boutiques which were closed for the majority of Q4 2021. Boutique count at the end of Q4 totaled 106 compared to 101 boutiques at the end of Q4 2021.
Gross profit increased by 74.4% to $179.5 million, compared to $102.9 million in Q4 2021. Gross profit margin was 40.4%, compared to 38.5% in Q4 2021. The improvement in gross profit margin was primarily due to leverage on occupancy costs, lower markdowns, and the strengthening of the Canadian dollar, partially offset by higher expedited freight costs as a result of global supply chain disruptions.
Selling, general and administrative ("SG&A") expenses increased by 66.1% to $120.2 million, compared to $72.4 million in Q4 2021. SG&A expenses were 27.1% of net revenue, compared to 27.0% in Q4 2021. The increase in SG&A expenses was primarily due to variable selling costs associated with the increase in revenue and continued investment in talent, technology, and marketing initiatives.
Net income was $34.2 million, an increase of 113.0% compared to $16.1 million in Q4 2021.
Net income per diluted share was $0.29, compared to $0.14 in Q4 2021.
Adjusted EBITDA(1) was $66.3 million or 14.9% of net revenue, an increase of 88.3% compared to $35.2 million or 13.2% of net revenue in Q4 2021.
Adjusted Net Income(1) was $39.5 million, an increase of 123.3% compared to $17.7 million in Q4 2021.
Adjusted Net Income(1) per diluted share was $0.34, an increase of 112.5% compared to $0.16 in Q4 2021.
Cash and cash equivalents at the end of Q4 totaled $265.2 million compared to $149.1 million at the end of Q4 2021. In the last twelve months, the Company has repaid its $75.0 million term loan and funded the initial payment of $32.9 million for the acquisition of CYC. The Company currently has zero drawn on its revolving credit facility.
Inventory at the end of Q4 was $208.1 million, compared to $171.8 million at the end of Q4 2021. The Company continues to manage its inventory position to meet demand despite global supply chain disruptions.
Capital cash expenditures (net of proceeds from lease incentives)(1) were $16.4 million in Q4 2022, compared to $9.4 million in Q4 2021.
Fiscal 2022 Compared to Fiscal 2021
(in thousands of Canadian dollars, |
Fiscal 2022 52 weeks |
Fiscal 2021 52 weeks |
Variance
|
||||||
% |
% pts |
||||||||
eCommerce revenue |
$ |
564,340 |
37.8% |
$ |
425,929 |
49.7% |
32.5% |
||
Retail revenue |
930,290 |
62.2% |
431,394 |
50.3% |
115.6% |
||||
Net revenue |
1,494,630 |
100.0% |
857,323 |
100.0% |
74.3% |
||||
Gross profit |
654,952 |
43.8% |
312,505 |
36.5% |
109.6% |
7.3% |
|||
SG&A |
392,802 |
26.3% |
250,726 |
29.2% |
56.7% |
(2.9%) |
|||
Net income |
$ |
156,917 |
10.5% |
$ |
19,227 |
2.2% |
716.1% |
8.3% |
|
Net income per diluted share |
$ |
1.36 |
$ |
0.17 |
700.0% |
||||
Adjusted EBITDA(1) |
$ |
289,385 |
19.4% |
$ |
76,812 |
9.0% |
276.7% |
10.4% |
|
Adjusted Net Income (1) per |
$ |
1.53 |
$ |
0.23 |
565.2% |
||||
Net revenue increased by 74.3% to $1.5 billion, compared to $857.3 million in fiscal 2021. The Company has seen an unprecedented acceleration of sales in the United States, where net revenues increased by 131.8% to C$676.1 million, compared to C$291.7 million in fiscal 2021. The Company also saw meaningful growth in Canada where net revenue increased by 44.7% to $818.5 million, compared to $565.6 million in fiscal 2021.
Gross profit increased by 109.6% to $655.0 million, compared to $312.5 million in fiscal 2021. Gross profit margin was 43.8% compared to 36.5% in fiscal 2021. The improvement in gross profit margin was primarily due to leverage on occupancy costs, lower markdowns, the strengthening of the Canadian dollar, and lower warehousing and distribution costs, partially offset by higher expedited freight costs as a result of global supply chain disruptions and lower rent abatements.
SG&A expenses increased by 56.7% to $392.8 million, compared to $250.7 million in fiscal 2021. SG&A expenses were 26.3% of net revenue compared to 29.2% of net revenue in fiscal 2021. Excluding the benefit of government payroll subsidies, the increase in SG&A expenses was 42.2%. The increase in SG&A expenses was primarily due to variable selling costs associated with the increase in revenue and continued investment in talent, technology, and marketing initiatives.
Net income was $156.9 million, compared to $19.2 million in fiscal 2021.
Net income per diluted share was $1.36, compared to $0.17 in fiscal 2021.
Adjusted EBITDA(1) was $289.4 million, or 19.4% of net revenue, compared to $76.8 million, or 9.0% of net revenue in fiscal 2021.
Adjusted Net Income(1) was $176.7 million, compared to $26.0 million in fiscal 2021.
Adjusted Net Income(1) per diluted share was $1.53, compared to $0.23 for the fiscal 2021.
Capital cash expenditures (net of proceeds from lease incentives)(1) were $52.6 million, compared to $42.5 million in fiscal 2021.
(1) |
See "Non-IFRS Measures including Retail Industry Metrics" and "Selected Consolidated Financial Information" below, including for a reconciliation of the non-IFRS measures used in this release to the most comparable IFRS measures. See also sections entitled "How We Assess the Performance of our Business", "Non-IFRS Measures including Retail Industry Metrics" and "Selected Consolidated Financial Information" in the Management's Discussion and Analysis for further details concerning Adjusted EBITDA, Adjusted Net Income and Adjusted Net Income per diluted share, capital cash expenditures (net of proceeds from lease incentives) and free cash flow including definitions and reconciliations to the relevant reported IFRS measure. |
Outlook
The Company's strong momentum continued into the first quarter of fiscal 2023. Aritzia is on-track to deliver net revenue of approximately $375 million, representing just over a 50% increase compared to last year. This reflects continued strength in the United States across both its retail and eCommerce channels, as well as, strong recovery of the Company's business in Canada. This revenue range for the first quarter reflects all boutiques opened with no COVID-19 related restrictions in place, compared to last year when 50% or 34 of the Company's boutiques in Canada were mandated to close for approximately two-thirds of the quarter.
For fiscal 2023, Aritzia currently expects the following:
- Net revenue of approximately $1.8 billion, representing an increase of approximately 20% from fiscal 2022. This is led by continued strength in the Company's business in the United States across both channels, as well as continued growth in Canada driven by its eCommerce business and recovery in its boutiques, and contribution from its retail expansion with:
- Eight to ten new boutiques with all but one in the United States, including Forum Shops in Las Vegas and Aventura Mall in Miami already opened; and
- Four to five boutique expansions or repositions, including three to four locations in Canada and one in the United States.
- Gross profit margin to decrease by approximately 100 bps compared to last year, reflecting ongoing impacts from global supply chain disruptions, inflationary pressure, and discontinued COVID relief subsidies;
- SG&A as a percent of net revenue to increase approximately 50 bps to 100 bps compared to last year, reflecting ongoing investments to fuel our future growth;
- Net capital expenditures in the range of $110 million to $120 million, comprised of:
- Boutique network growth,
- New distribution centre in the Greater Toronto area, and
- Ongoing investments in technology, infrastructure to enhance the Company's eCommerce capabilities and omni-channel experience, and support office expansion.
The foregoing outlook is based on management's current strategies and may be considered forward-looking information under applicable securities laws. Such outlook is based on estimates and assumptions made by management regarding, among other things, general economic and geopolitical conditions and the competitive environment as well as further COVID-19 resurgences. Readers are cautioned that actual results may vary. See also the "Forward-Looking Information" section of this earnings release and "Risk Factors" section of our MD&A and AIF.
Normal Course Issuer Bid
On January 12, 2022, the Company announced the commencement of a normal course issuer bid ("NCIB") through the facilities of the Toronto Stock Exchange to repurchase and cancel up to 3,732,725 of its subordinate voting shares ("Shares"), representing approximately 5.0% of the public float of 74,654,507, during the twelve month period commencing January 17, 2022 and ending January 16, 2023. During fiscal 2022, the Company repurchased 164,200 Shares for cancellation at an average price of $54.79 per Share, for total cash consideration of $9.0 million.
Conference Call Details
A conference call to discuss the Company's fourth quarter results is scheduled for Thursday, May 5, 2022, at 1:30 p.m. PT / 4:30 p.m. ET. To participate, please dial 1-800-319-4610 (North America toll-free) or 1-416-915-3239 (Toronto and overseas long-distance). The call is also accessible via webcast at http://investors.aritzia.com/events-and-presentations/. A recording will be available shortly after the conclusion of the call. To access the replay, please dial 1-855-669-9658 and the access code 8779. An archive of the webcast will be available on Aritzia's website.
About Aritzia
Aritzia is a vertically integrated design house with an innovative global platform, home to an extensive portfolio of exclusive brands for every function and individual aesthetic. We're about good design, quality materials and timeless style that endures and inspires — all with the wellbeing of our People and Planet in mind. We call this Everyday Luxury.
Founded in 1984, in Vancouver, Canada, we create and curate products that are both beautiful and beautifully made, cultivate aspirational environments, offer engaging service that delights, and connect through captivating communications. We pride ourselves on providing immersive, and highly personal shopping experiences at aritzia.com and in our 100+ boutiques throughout North America to everyone, everywhere.
Everyday Luxury. To Elevate Your World.™
Comparable Sales Growth
Comparable sales growth is typically a useful operating metric in assessing the performance of the Company's business to explain our total combined revenue growth in eCommerce and established boutiques. Due to temporary boutique closures from COVID-19, which resulted in boutiques being removed from our comparable store base, we believe total comparable sales growth is not currently representative of our business and therefore we have not reported figures on this metric in this MD&A. Instead, we may make a temporary reference in this MD&A to retail comparable sales growth from established boutiques which is calculated as comparable sales growth with the exclusion of eCommerce revenue growth..
Non-IFRS Measures including Retail Industry Metrics
This press release makes reference to certain non-IFRS measures including certain retail industry metrics. These measures are not recognized measures under IFRS, do not have a standardized meaning prescribed by IFRS, and are therefore unlikely to be comparable to similar measures presented by other companies. Rather, these measures are provided as additional information to complement those IFRS measures by providing further understanding of our results of operations from management's perspective. Accordingly, these measures should not be considered in isolation nor as a substitute for analysis of our financial information reported under IFRS. We use non-IFRS measures including "EBITDA", "Adjusted EBITDA", "Adjusted Net Income", "Adjusted Net Income per Diluted Share", "capital cash expenditures (net of proceeds from lease incentives)" and "free cash flow." This press release also makes reference to "gross profit margin" as well as "comparable sales growth", which are commonly used operating metrics in the retail industry but may be calculated differently compared to other retailers. Gross profit margin and comparable sales growth are considered supplementary measures under applicable securities laws. These non-IFRS measures including retail industry metrics are used to provide investors with supplemental measures of our operating performance and thus highlight trends in our core business that may not otherwise be apparent when relying solely on IFRS measures. We believe that securities analysts, investors and other interested parties frequently use non-IFRS measures including retail industry metrics in the evaluation of issuers. Our management also uses non-IFRS measures including retail industry metrics in order to facilitate operating performance comparisons from period to period, to prepare annual operating budgets and forecasts and to determine components of management compensation. Definitions and reconciliations of non-IFRS measures to the relevant reported measures can be found in our MD&A. Such reconciliations can also be found in this press release under the heading "Selected Consolidated Financial Information".
Forward-Looking Information
Certain statements made in this press release may constitute forward-looking information under applicable securities laws. Forward-looking statements are based on information currently available to management and on estimates and assumptions made by management regarding, among other things, general economic and geopolitical conditions and the competitive environment within the retail industry, in light of its experience and perceptions of historical trends, current conditions and expected future developments, as well as other factors that are believed to be appropriate and reasonable in the circumstances. These statements may relate to our future financial outlook, our leadership transition and its impact on our business, people and growth, our plans relating to our distribution facilities and digital infrastructure, and anticipated events or results and include, our ability to sustain momentum in our business and advance our strategic growth drivers, continued focus on driving digital innovation and eCommerce and Omni capabilities, accelerating boutique growth and expanding our product assortment, acquiring new clients and investing in our infrastructure and growing team, the Company's response to mitigate anticipated supply chain disruptions, geopolitical risks, inflationary pressures and labour shortages, repurchases under our NCIB, our outlook for: (i) net revenue in the first quarter of fiscal 2023, (ii) net revenue in fiscal 2023, (iii) gross profit margin in fiscal 2023, (iv) SG&A as a percent of net revenue in fiscal 2023, (v) net capital expenditure in fiscal 2023 and (vi) new boutiques and expansion or repositioning of existing boutiques in fiscal 2023. Particularly, information regarding our expectations of future results, targets, performance achievements, prospects or opportunities is forward-looking information. As the context requires, this may include certain targets as disclosed in the prospectus for our initial public offering, which are based on the factors and assumptions, and subject to the risks, as set out therein and herein. Often but not always, forward-looking statements can be identified by the use of forward-looking terminology such as "plans", "targets", "expects" or "does not expect", "is expected", "an opportunity exists", "budget", "scheduled", "estimates", "outlook", "forecasts", "projection", "prospects", "strategy", "intends", "anticipates", "does not anticipate", "believes", or variations of such words and phrases or state that certain actions, events or results "may", "could", "would", "might", "will", "will be taken", "occur" or "be achieved". In addition, any statements that refer to expectations, intentions, projections or other characterizations of future events or circumstances contain forward-looking information. Statements containing forward-looking information are not historical facts but instead represent our expectations, estimates and projections regarding future events or circumstances.
Implicit in forward-looking statements in respect of the Company's expectations for: (i) net revenue of approximately $375 million for the first quarter of fiscal 2023, representing just over a 50% increase compared to last year, (ii) net revenue of approximately $1.8 billion in fiscal 2023, representing an increase of approximately 20% from fiscal 2022, (iii) gross profit margin to decrease by approximately 100 bps compared to last year, (iv) SG&A as a percent of net revenue to increase approximately 50 bps to 100 bps compared to last year and (v) net capital expenditures in the range of $100 million to $120 million, are certain current assumptions including the continued acceleration of sales in the United States both in retail and eCommerce channels as well as continued momentum of the Company's eCommerce business in Canada. The Company's forward-looking information is also based upon assumptions regarding the overall retail environment, the COVID-19 pandemic and related health and safety protocols and currency exchange rates for fiscal 2023. Specifically, we have assumed the following exchange rates for fiscal 2023: USD:CAD = 1:1.26.
Given this unprecedented period of uncertainty, there can be no assurances regarding: (a) the limitations or restrictions that may be placed on servicing our clients in reopened boutiques or potential re-closing of boutiques or the duration of any such limitations or restrictions; (b) the COVID-19-related impacts on Aritzia's business, operations, labour force, supply chain performance and growth strategies, (c) Aritzia's ability to mitigate such impacts, including ongoing measures to enhance short-term liquidity, contain costs and safeguard the business; (d) general economic conditions related to COVID-19 and impacts to consumer discretionary spending and shopping habits; (e) credit, market, currency, commodity market, inflation, interest rates, global supply chains, operational, and liquidity risks generally; (f) geopolitical events; and (g) other risks inherent to Aritzia's business and/or factors beyond its control which could have a material adverse effect on the Company.
Many factors could cause our actual results, level of activity, performance or achievements or future events or developments to differ materially from those expressed or implied by the forward-looking statements, including, without limitation, the factors discussed in the "Risk Factors" section of the Company's annual information form dated May 5, 2022 for the fiscal year ended February 27, 2022 (the "AIF"). A copy of the AIF and the Company's other publicly filed documents can be accessed under the Company's profile on the System for Electronic Document Analysis and Retrieval ("SEDAR") at www.sedar.com.
The Company cautions that the list of risk factors and uncertainties described in the AIF is not exhaustive and other factors could also adversely affect its results. Readers are urged to consider the risks, uncertainties and assumptions carefully in evaluating the forward-looking information and are cautioned not to place undue reliance on such information. The forward-looking information contained in this press release represents our expectations as of the date of this press release (or as the date they are otherwise stated to be made), and are subject to change after such date. However, we disclaim any intention or obligation or undertaking to update or revise any forward-looking information whether as a result of new information, future events or otherwise, except as required under applicable securities laws.
Selected Consolidated Financial Information
CONSOLIDATED STATEMENTS OF OPERATIONS
(in thousands of Canadian dollars, |
Q4 2022 13 Weeks |
Q4 2021 13 Weeks |
Q4 2020 13 Weeks |
Fiscal 2022 52 Weeks |
Fiscal 2021 52 Weeks |
Fiscal 2020 52 Weeks |
|||||||||||||
Net revenue |
$ |
444,322 |
100.0% |
$ |
267,525 |
100.0% |
$ |
275,430 |
100.0% |
$ |
1,494,630 |
100.0% |
$ |
857,323 |
100.0% |
$ |
980,589 |
100.0% |
|
Cost of goods sold |
264,816 |
59.6% |
164,600 |
61.5% |
172,589 |
62.7% |
839,678 |
56.2% |
544,818 |
63.5% |
577,165 |
58.9% |
|||||||
Gross profit |
179,506 |
40.4% |
102,925 |
38.5% |
102,841 |
37.3% |
654,952 |
43.8% |
312,505 |
36.5% |
403,424 |
41.1% |
|||||||
Operating expenses |
|||||||||||||||||||
Selling, general and administrative |
120,221 |
27.1% |
72,357 |
27.0% |
64,331 |
23.4% |
392,802 |
26.3% |
250,726 |
29.2% |
243,362 |
24.8% |
|||||||
Stock-based compensation |
5,725 |
1.3% |
4,193 |
1.6% |
2,411 |
0.9% |
26,131 |
1.7% |
10,691 |
1.2% |
7,790 |
0.8% |
|||||||
Income from operations |
53,560 |
12.1% |
26,375 |
9.9% |
36,099 |
13.1% |
236,019 |
15.8% |
51,088 |
6.0% |
152,272 |
15.5% |
|||||||
Finance expense |
6,092 |
1.4% |
6,464 |
2.4% |
6,914 |
2.5% |
25,202 |
1.7% |
28,420 |
3.3% |
28,319 |
2.9% |
|||||||
Other expense (income) |
740 |
0.2% |
(2,129) |
(0.8%) |
(1,354) |
(0.5%) |
(8,783) |
(0.6%) |
(3,534) |
(0.4%) |
(2,185) |
(0.2%) |
|||||||
Income before income taxes |
46,728 |
10.5% |
22,040 |
8.2% |
30,539 |
11.1% |
219,600 |
14.7% |
26,202 |
3.1% |
126,138 |
12.9% |
|||||||
Income tax expense |
12,503 |
2.8% |
5,970 |
2.2% |
8,824 |
3.2% |
62,683 |
4.2% |
6,975 |
0.8% |
35,544 |
3.6% |
|||||||
Net income |
$ |
34,225 |
7.7% |
$ |
16,070 |
6.0% |
$ |
21,715 |
7.9% |
$ |
156,917 |
10.5% |
$ |
19,227 |
2.2% |
$ |
90,594 |
9.2% |
|
Other Performance Measures: |
|||||||||||||||||||
Year-over-year net revenue |
66.1% |
(2.9%) |
6.3% |
74.3% |
(12.6%) |
12.2% |
|||||||||||||
Comparable sales growth(i) |
n/a |
n/a |
8.9% |
n/a |
n/a |
7.6% |
|||||||||||||
Capital cash expenditures (net of |
$ |
(16,434) |
$ |
(9,415) |
$ |
(9,732) |
$ |
(52,607) |
$ |
(42,529) |
$ |
(36,253) |
|||||||
Free cash flow |
$ |
(37,047) |
$ |
(24,936) |
$ |
20,656 |
$ |
221,937 |
$ |
36,306 |
$ |
117,246 |
|||||||
Number of boutiques, end of |
106 |
101 |
96 |
106 |
101 |
96 |
|||||||||||||
Note: |
(i) Please see the "Comparable Sales Growth" section above for more details. |
NET REVENUE BY GEOGRAPHIC LOCATION
(in thousands of Canadian dollars) |
Q4 2022 13 weeks |
Q4 2021 13 weeks |
Q4 2020 13 weeks |
Fiscal 2022 52 weeks |
Fiscal 2021 52 weeks |
Fiscal 2020 52 weeks |
Canada |
$ 227,524 |
$ 163,681 |
$ 180,303 |
$ 818,495 |
$ 565,591 |
$ 642,973 |
United States |
216,798 |
103,844 |
95,127 |
676,135 |
291,732 |
337,616 |
Net revenue |
$ 444,322 |
$ 267,525 |
$ 275,430 |
$ 1,494,630 |
$ 857,323 |
$ 980,589 |
CONSOLIDATED CASH FLOWS
(in thousands of Canadian dollars) |
Q4 2022 13 weeks |
Q4 2021 13 weeks |
Q4 2020 13 weeks |
Fiscal 2022 52 weeks |
Fiscal 2021 52 weeks |
Fiscal 2020 52 weeks |
Net cash generated from operating activities |
$ 733 |
$ 5,438 |
$ 45,463 |
$ 338,353 |
$ 125,628 |
$ 210,539 |
Net cash (used in) generated from financing |
(20,171) |
(17,969) |
(11,179) |
(124,093) |
(40,586) |
(145,865) |
Cash used in investing activities |
(20,734) |
(11,368) |
(12,167) |
(99,576) |
(50,848) |
(47,790) |
Effect of exchange rate changes on cash and |
(515) |
(990) |
(33) |
1,414 |
(2,797) |
(31) |
Change in cash and cash equivalents |
$ (40,687) |
$ (24,889) |
$ 22,084 |
$ 116,098 |
$ 31,397 |
$ 16,853 |
RECONCILIATION OF NET INCOME TO EBITDA, ADJUSTED EBITDA AND ADJUSTED NET INCOME
(in thousands of Canadian dollars, |
Q4 2022 13 weeks |
Q4 2021 13 weeks |
Q4 2020 13 weeks |
Fiscal 2022 52 weeks |
Fiscal 2021 52 weeks |
Fiscal 2020 52 weeks |
Reconciliation of Net Income to |
||||||
Net income |
$ 34,225 |
$ 16,070 |
$ 21,715 |
$ 156,917 |
$ 19,227 |
$ 90,594 |
Depreciation and amortization |
12,110 |
10,723 |
9,017 |
44,569 |
38,871 |
34,422 |
Depreciation on right-of-use assets |
17,593 |
16,410 |
15,117 |
68,058 |
66,278 |
59,080 |
Finance expense |
6,092 |
6,464 |
6,914 |
25,202 |
28,420 |
28,319 |
Income tax expense |
12,503 |
5,970 |
8,824 |
62,683 |
6,975 |
35,544 |
EBITDA |
82,523 |
55,637 |
61,587 |
357,429 |
159,771 |
247,959 |
Adjustments to EBITDA: |
||||||
Stock-based compensation |
5,725 |
4,193 |
2,411 |
26,131 |
10,691 |
7,790 |
Rent impact from IFRS 16, Leases(i) |
(22,939) |
(21,985) |
(20,973) |
(90,048) |
(89,949) |
(82,527) |
Unrealized gain on equity derivatives |
994 |
(2,640) |
(650) |
(11,192) |
(3,701) |
(650) |
Fair value adjustment of NCI in |
- |
- |
- |
2,000 |
- |
- |
Fair value adjustment for inventories |
- |
- |
- |
1,902 |
- |
- |
Acquisition costs of CYC |
- |
- |
- |
2,633 |
- |
- |
Secondary offering transaction costs |
- |
- |
- |
530 |
- |
- |
Adjusted EBITDA |
$ 66,303 |
$ 35,205 |
$ 42,375 |
$ 289,385 |
$ 76,812 |
$ 172,572 |
Adjusted EBITDA as a percentage |
14.9% |
13.2% |
15.4% |
19.4% |
9.0% |
17.6% |
Reconciliation of Net Income to |
||||||
Net income |
$ 34,225 |
$ 16,070 |
$ 21,715 |
$ 156,917 |
$ 19,227 |
$ 90,594 |
Adjustments to net income: |
||||||
Stock-based compensation |
5,725 |
4,193 |
2,411 |
26,131 |
10,691 |
7,790 |
Unrealized loss (gain) on equity |
994 |
(2,640) |
(650) |
(11,192) |
(3,701) |
(650) |
Fair value adjustment of NCI in |
- |
- |
- |
2,000 |
- |
- |
Fair value adjustment for |
- |
- |
- |
1,902 |
- |
- |
Acquisition costs of CYC |
- |
- |
- |
2,633 |
- |
- |
Secondary offering transaction costs |
- |
- |
- |
530 |
- |
- |
Related tax effects |
(1,469) |
55 |
(48) |
(2,185) |
(189) |
(346) |
Adjusted Net Income |
$ 39,475 |
$ 17,678 |
$ 23,428 |
$ 176,736 |
$ 26,028 |
$ 97,388 |
Adjusted Net Income as a |
8.9% |
6.6% |
8.5% |
11.8% |
3.0% |
9.9% |
Weighted average number of |
116,774 |
114,052 |
113,120 |
115,784 |
112,844 |
112,128 |
Adjusted Net Income per diluted share |
$ 0.34 |
$ 0.16 |
$ 0.21 |
$ 1.53 |
$ 0.23 |
$ 0.87 |
Note: |
(i) Rent Impact from IFRS 16, Leases |
(in thousands of Canadian dollars) |
Q4 2022 13 weeks |
Q4 2021 13 weeks |
Q4 2020 13 weeks |
Fiscal 2022 52 weeks |
Fiscal 2021 52 weeks |
Fiscal 2020 52 weeks |
Depreciation of right-of-use assets, |
$ (17,460) |
$ (16,410) |
$ (15,117) |
$ (67,702) |
$ (66,278) |
$ (59,080) |
Interest expense on lease liabilities |
(5,479) |
(5,575) |
(5,856) |
(22,346) |
(23,671) |
(23,447) |
Rent impact from IFRS 16, Leases |
$ (22,939) |
$ (21,985) |
$ (20,973) |
$ (90,048) |
$ (89,949) |
$ (82,527) |
CAPITAL CASH EXPENDITURES (NET OF PROCEEDS FROM LEASE INCENTIVES)
(in thousands of Canadian dollars) |
Q4 2022 13 weeks |
Q4 2021 13 weeks |
Q4 2020 13 weeks |
Fiscal 2022 52 weeks |
Fiscal 2021 52 weeks |
Fiscal 2020 52 weeks |
Cash used in investing activities |
$ (20,734) |
$ (11,368) |
$ (12,167) |
$ (99,576) |
$ (50,848) |
$ (47,790) |
Acquisition of CYC Design |
- |
- |
- |
32,555 |
- |
- |
Proceeds from lease incentives |
4,300 |
1,953 |
2,435 |
14,414 |
8,319 |
11,537 |
Capital cash expenditures (net of |
$ (16,434) |
$ (9,415) |
$ (9,732) |
$ (52,607) |
$ (42,529) |
$ (36,253) |
FREE CASH FLOW
(in thousands of Canadian dollars) |
Q4 2022 13 weeks |
Q4 2021 13 weeks |
Q4 2020 13 weeks |
Fiscal 2022 52 weeks |
Fiscal 2021 52 weeks |
Fiscal 2020 52 weeks |
Net cash generated from operating |
$ 733 |
$ 5,438 |
$ 45,463 |
$ 338,353 |
$ 125,628 |
$ 210,539 |
Interest paid on credit facilities |
613 |
890 |
971 |
2,491 |
4,651 |
4,429 |
Proceeds from lease incentives |
4,300 |
1,953 |
2,435 |
14,414 |
8,319 |
11,537 |
Repayments of principal on lease |
(21,959) |
(21,849) |
(16,046) |
(66,300) |
(51,444) |
(61,469) |
Purchase of property, equipment and |
(20,734) |
(11,368) |
(12,167) |
(67,021) |
(50,848) |
(47,790) |
Free cash flow |
$ (37,047) |
$ (24,936) |
$ 20,656 |
$ 221,937 |
$ 36,306 |
$ 117,246 |
CONSOLIDATED STATEMENTS OF FINANCIAL POSITION
(in thousands of Canadian dollars) |
As at |
As at |
||
Assets |
||||
Cash and cash equivalents |
$ 265,245 |
$ 149,147 |
||
Accounts receivable |
8,147 |
6,202 |
||
Income taxes recoverable |
6,455 |
4,719 |
||
Inventory |
208,125 |
171,821 |
||
Prepaid expenses and other current assets |
33,564 |
23,452 |
||
Total current assets |
521,536 |
355,341 |
||
Property and equipment |
223,190 |
189,568 |
||
Intangible assets |
87,398 |
62,049 |
||
Goodwill |
198,846 |
151,682 |
||
Right-of-use assets |
362,887 |
363,417 |
||
Other assets |
4,271 |
2,886 |
||
Deferred tax assets |
26,458 |
15,794 |
||
Total assets |
$ 1,424,586 |
$ 1,140,737 |
||
Liabilities |
||||
Accounts payable and accrued liabilities |
$ 179,344 |
$ 131,893 |
||
Income taxes payable |
58,917 |
8,287 |
||
Current portion of contingent consideration |
6,619 |
- |
||
Current portion of lease liabilities |
86,724 |
71,452 |
||
Deferred revenue |
55,721 |
37,563 |
||
Total current liabilities |
387,325 |
249,195 |
||
Lease liabilities |
417,067 |
423,380 |
||
Other non-current liabilities |
22,359 |
15,059 |
||
Contingent consideration |
6,618 |
- |
||
Non-controlling interest in exchangeable shares liability |
35,500 |
- |
||
Deferred tax liabilities |
24,906 |
17,985 |
||
Long-term debt |
- |
74,855 |
||
Total liabilities |
893,775 |
780,474 |
||
Shareholders' equity |
||||
Share capital |
251,291 |
228,665 |
||
Contributed surplus |
56,342 |
56,606 |
||
Retained earnings |
223,553 |
75,216 |
||
Accumulated other comprehensive loss |
(375) |
(224) |
||
Total shareholders' equity |
530,811 |
360,263 |
||
Total liabilities and shareholders' equity |
$ 1,424,586 |
$ 1,140,737 |
BOUTIQUE COUNT SUMMARY
Q4 2022 13 weeks(i) |
Q4 2021 13 weeks |
Fiscal 2022 52 weeks(i) |
Fiscal 2021 52 weeks |
|
Number of boutiques, beginning of period |
105 |
101 |
101 |
96 |
New boutiques |
2 |
1 |
6 |
7 |
Repositioned to flagship boutique |
- |
(1) |
- |
(1) |
Boutique closure |
(1) |
- |
(1) |
- |
Boutiques temporarily closed due to mall |
- |
- |
- |
(1) |
Number of boutiques, end of period |
106 |
101 |
106 |
101 |
Boutiques expanded or repositioned |
1 |
- |
6 |
3 |
Note: |
(i) CYC had four boutiques as at February 27, 2022 which are excluded from the boutique count. |
SOURCE Aritzia Inc.






Share this article