Ashford Trust Reports Fourth Quarter And Year End 2019 Results
Actual RevPAR Increased 3.1% for all Hotels in the Fourth Quarter
Actual RevPAR Increased 2.9% for all Hotels for the Full Year
Comparable RevPAR Increased 1.2% for all Hotels Not Under Renovation in the Fourth Quarter
Net Loss Attributable to Common Stockholders was $38.8 Million in the Fourth Quarter
Adjusted Funds From Operations Per Share Increased 22% in the Fourth Quarter
Completed Sale and Distribution of Ashford Inc. Shares
Entered into New Franchise Agreement for the Hilton Alexandria Old Town
Announced Plan to Convert the Crowne Plaza La Concha Key West to Marriott's Autograph Collection
Announced Sale of SpringHill Suites Jacksonville for $11.2 Million
Announced the Sale of Parking Lot Adjacent to the Hilton St. Petersburg for $17.5 Million
DALLAS, Feb. 25, 2020 /PRNewswire/ -- Ashford Hospitality Trust, Inc. (NYSE: AHT) ("Ashford Trust" or the "Company") today reported financial results and performance measures for the fourth quarter and full year ended December 31, 2019. The comparable performance measurements for Occupancy, Average Daily Rate (ADR), Revenue Per Available Room (RevPAR), and Hotel EBITDA assume each of the hotel properties in the Company's hotel portfolio as of December 31, 2019 were owned as of the beginning of each of the periods presented. Unless otherwise stated, all reported results compare the fourth quarter ended December 31, 2019 with the fourth quarter ended December 31, 2018 (see discussion below). The reconciliation of non-GAAP financial measures is included in the financial tables accompanying this press release.
STRATEGIC OVERVIEW
- Invests predominantly in upper upscale, full-service hotels
- Targets moderate leverage levels to enhance equity returns
- Highly-aligned management team and advisory structure
- Targets cash and cash equivalents at a level of 25 - 35% of total equity market capitalization for the purposes of:
- working capital needs at property and corporate levels;
- providing a hedge in the event of uncertain economic times; and
- being prepared to pursue accretive investments or stock buybacks as those opportunities arise
FINANCIAL AND OPERATING HIGHLIGHTS
- Net loss attributable to common stockholders was $38.8 million or $0.39 per diluted share for the quarter. For the full year of 2019, net loss attributable to common stockholders was $156.2 million or $1.58 per diluted share.
- Comparable RevPAR for all hotels increased 0.7% to $119.04 during the quarter.
- Comparable RevPAR for all hotels not under renovation increased 1.2% to $118.97 during the quarter.
- Comparable Total RevPAR for all hotels increased 1.3% during the quarter.
- Adjusted EBITDAre was $89.1 million for the quarter. Adjusted EBITDAre for the full year of 2019 was $425.0 million.
- Adjusted funds from operations (AFFO) was $0.22 per diluted share for the quarter, an increase of 22% over the prior-year quarter. For the full year of 2019, AFFO per diluted share was $1.22.
- During the quarter, the Company sold 393,077 shares of Ashford Inc. (NYSE American: AINC) ("Ashford") common stock to Ashford for proceeds of approximately $11.8 million. Additionally, during the quarter, the Company distributed its remaining 205,086 shares of Ashford common stock on a pro-rata basis to its common shareholders and unitholders.
- During the quarter, the Company entered into a new franchise agreement for the Hilton Alexandria Old Town in Alexandria, Virginia that transitioned the hotel from being Hilton-managed to being managed by Remington Hotels.
- During the quarter, the Company entered into a new franchise agreement with Marriott International to convert the Crowne Plaza La Concha Key West Hotel in Key West, Florida to an Autograph Collection property.
- During the quarter, the Company announced it had sold the parking lot adjacent to the Hilton St. Petersburg Bayfront Hotel in St. Petersburg, Florida for $17.5 million to be paid over time.
- During the quarter, the Company announced the sale of the 102-room SpringHill Suites Jacksonville in Jacksonville, Florida for $11.2 million ($109,000 per key).
- During the quarter, the Company amended and extended its mortgage loan for the 140-room Hotel Indigo Atlanta in Atlanta, Georgia.
- Subsequent to quarter end, the Company refinanced its mortgage loan for the 226-room Le Pavillon Hotel in New Orleans, Louisiana.
- Capex invested during the quarter was $37.5 million, bringing the total capex invested for the full year to $159.2 million.
CONVERSION OF THE HILTON ALEXANDRIA TO A FRANCHISED PROPERTY
On October 3, 2019, the Company announced that it entered into a new franchise agreement for the 252-room Hilton Alexandria Old Town in Alexandria, Virginia that it acquired in June 2018. Under the new franchise agreement, the hotel transitioned from being Hilton-managed to being managed by Remington Hotels. The management conversion was effective on October 1, 2019 and did not require a Property Improvement Plan ("PIP").
CONVERSION OF CROWNE PLAZA KEY WEST TO AUTOGRAPH COLLECTION
On October 3, 2019, the Company announced it entered into a new franchise agreement with Marriott International ("Marriott") to convert the Crowne Plaza La Concha Key West Hotel in Key West, Florida to an Autograph Collection property. The 160-room hotel is ideally located on Duval Street in the heart of Old Town Key West within walking distance of major attractions, shopping, entertainment, and nightlife.
The agreement with Marriott calls for the hotel to be converted to an Autograph Collection property by July 1, 2022, pursuant to a conversion PIP that is currently estimated to be $13.7 million, approximately $7.8 million of which is incremental. The PIP includes updates to the exterior, guestrooms, guest bathrooms, corridors, lobby, restaurant, lounge, pool, and meeting space. The conversion will create a distinctive style for the hotel that is commensurate with the upper upscale/luxury Autograph product. Post-conversion, Remington Hotels will continue to manage the property. The Company believes that post-conversion, the new Autograph property should realize a RevPAR premium to the current hotel and that its incremental investment should yield an approximate 19% unlevered internal rate of return.
SALE OF PARKING LOT AT HILTON ST. PETERSBURG
On October 15, 2019, the Company announced the sale of a 1.65-acre (72,068 square foot) parking lot adjacent to the Hilton St. Petersburg Bayfront Hotel in St. Petersburg, Florida for total consideration of $17.5 million to be paid over time. The lot was sold to a Florida-based company and will be developed into a 35-story condominium tower and parking garage. As part of the agreement, following project completion, the Company will have ownership rights to 205 covered parking spaces in the new parking garage for use by Hilton St. Petersburg Bayfront guests. The first payment tranche resulted in approximately $8.0 million of debt paydown.
SALE OF SPRINGHILL SUITES JACKSONVILLE
On December 4, 2019, the Company announced the sale of the 102-room SpringHill Suites Jacksonville in Jacksonville, Florida for $11.2 million ($109,000 per key). The sales price, inclusive of buyer's estimated capex of $2.5 million, represents a trailing twelve-month cap rate of 5.9% on net operating income and a 14.3x Hotel EBITDA multiple as of October 31, 2019.
CAPITAL STRUCTURE
At December 31, 2019, the Company had total mortgage loans of $4.1 billion with a blended average interest rate of 5.1% and a weighted average maturity of 4.8 years assuming full extension of the loans.
On October 2, 2019, the Company announced a stock purchase agreement with Ashford under which Ashford purchased 393,077 shares of its common stock for $30 per share, resulting in total proceeds of approximately $11.8 million to the Company. The purchase price reflected a premium of approximately 20% based on the closing price of Ashford common stock on October 1, 2019. Due to the parameters of the private letter ruling from the Internal Revenue Service received by the Company, Ashford was only able to acquire the shares held by the Company's taxable REIT subsidiaries. Additionally, on November 5, 2019, the Company distributed its remaining 205,086 shares of Ashford common stock to its common shareholders and unitholders through a pro-rata, taxable dividend.
During the quarter, the Company amended and extended its mortgage loan for the 140-room Hotel Indigo Atlanta in Atlanta, Georgia, which had an existing outstanding balance of $16.0 million, a floating interest rate of LIBOR + 2.90%, and a final maturity date in May 2022. The amended, non-recourse loan totals $16.1 million and has a three-year initial term with two one-year extension options, subject to the satisfaction of certain conditions. The loan is interest only for the initial term with 1% annual amortization payments during the extension periods. The loan provides for a floating interest rate of LIBOR + 2.25%.
Subsequent to quarter end, the Company refinanced its mortgage loan for the 226-room Le Pavillon Hotel in New Orleans, Louisiana, which had an existing outstanding balance of approximately $43.8 million, a floating interest rate of LIBOR + 5.10%, and a final maturity date in June 2020. The new, non-recourse loan totals $37 million and has a three-year initial term with two one-year extension options, subject to the satisfaction of certain conditions. The loan provides for a floating interest rate of LIBOR + 3.40%.
PORTFOLIO REVPAR
As of December 31, 2019, the portfolio consisted of 117 hotels. During the fourth quarter of 2019, 113 of the Company's hotels were not under renovation. The Company believes reporting its operating metrics for its hotels on a comparable total basis (all 117 hotels), and comparable not under renovation basis (113 hotels), is a measure that reflects a meaningful and focused comparison of the operating results in its portfolio. Details of each category are provided in the tables attached to this release.
- Comparable RevPAR increased 0.7 % to $119.04 for all hotels on a 0.9% increase in ADR and a 0.1% decrease in occupancy.
- Comparable RevPAR increased 1.2% to $118.97 for all hotels not under renovation on a 1.0% increase in ADR and a 0.1% increase in occupancy.
HOTEL EBITDA MARGINS AND QUARTERLY SEASONALITY TRENDS
The Company believes year-over-year Comparable Hotel EBITDA and Comparable Hotel EBITDA Margin comparisons are more meaningful to gauge the performance of the Company's hotels than sequential quarter-over-quarter comparisons. To help investors better understand the seasonality in the Company's portfolio, the Company provides quarterly detail on its Comparable Hotel EBITDA and Comparable Hotel EBITDA Margin for the current and certain prior-year periods based upon the number of hotels in the Company's portfolio as of the end of the current period. As the Company's portfolio mix changes from time to time, so will the seasonality for Comparable Hotel EBITDA and Comparable Hotel EBITDA Margin. The details of the quarterly calculations for the previous four quarters for the 117 hotels are provided in the table attached to this release.
COMMON STOCK DIVIDEND
On December 5, 2019, the Company announced that its Board of Directors had declared a quarterly cash dividend of $0.06 per diluted share for the Company's common stock for the fourth quarter ending December 31, 2019, payable on January 15, 2020, to shareholders of record as of December 31, 2019.
"During 2019, we continued to benefit from the operational and financial advantages of our high-quality, well-diversified portfolio of hotels," commented Douglas A. Kessler, Ashford Trust's President and Chief Executive Officer. "We remain focused on maximizing the value of our assets and continue to pursue proactive, value-added initiatives that we believe will enhance shareholder returns. Consistent with our strategy, during the quarter, we announced the planned conversion of the Hilton Alexandria to a franchised property and the upbranding of the Crowne Plaza La Concha Key West Hotel to an Autograph Collection property. Both transactions are excellent examples of how we unlock embedded value in our portfolio. Additionally, disciplined capital recycling remains an important component of our strategy. In the quarter, we sold the SpringHill Suites Jacksonville at a very attractive cap rate compared to our current market valuation and also completed a strategic land parcel sale that allowed us to lower our leverage while simultaneously improve the parking facilities at the Hilton St. Petersburg Bayfront Hotel. Looking ahead, we are committed to optimizing the performance of our portfolio and pursuing value-added initiatives that we believe will enhance returns for our shareholders."
INVESTOR CONFERENCE CALL AND SIMULCAST
Ashford Hospitality Trust, Inc. will conduct a conference call on Wednesday, February 26, 2020, at 11:00 a.m. ET. The number to call for this interactive teleconference is (201) 493-6725. A replay of the conference call will be available through Wednesday, March 4, 2020, by dialing (412) 317-6671 and entering the confirmation number, 13697610.
The Company will also provide an online simulcast and rebroadcast of its fourth quarter 2019 earnings release conference call. The live broadcast of Ashford Hospitality Trust's quarterly conference call will be available online at the Company's web site, www.ahtreit.com on Wednesday, February 26, 2020, beginning at 11:00 a.m. ET. The online replay will follow shortly after the call and continue for approximately one year.
We use certain non-GAAP measures, in addition to the required GAAP presentations, as we believe these measures improve the understanding of our operational results and make comparisons of operating results among peer real estate investment trusts more meaningful. Non-GAAP financial measures, which should not be relied upon as a substitute for GAAP measures, used in this press release are FFO, AFFO, EBITDA, EBITDAre, Adjusted EBITDAre, and Hotel EBITDA. Please refer to our most recently filed Annual Report on Form 10-K for a more detailed description of how these non-GAAP measures are calculated. The reconciliations of non-GAAP measures to the closest GAAP measures are provided below and provide further details of our results for the period being reported.
Ashford Hospitality Trust is a real estate investment trust (REIT) focused on investing predominantly in upper upscale, full-service hotels.
Ashford has created an Ashford App for the hospitality REIT investor community. The Ashford App is available for free download at Apple's App Store and the Google Play Store by searching "Ashford."
Certain statements and assumptions in this press release contain or are based upon "forward-looking" information and are being made pursuant to the safe harbor provisions of the federal securities regulations. Forward-looking statements in this press release may include, among others, statements about the Company's strategy and future plans. When we use the words "will likely result," "may," "anticipate," "estimate," "should," "expect," "believe," "intend," or similar expressions, we intend to identify forward-looking statements. Such statements are subject to numerous assumptions and uncertainties, many of which are outside Ashford Trust's control.
These forward-looking statements are subject to known and unknown risks and uncertainties, which could cause actual results to differ materially from those anticipated, including, without limitation: general conditions of the capital markets and the market price of our common stock; changes in our business or investment strategy; availability, terms and deployment of capital; availability of qualified personnel; changes in our industry and the market in which we operate, interest rates or the general economy; our ability to successfully complete and integrate acquisitions, and manage our planned growth, and the degree and nature of our competition. These and other risk factors are more fully discussed in Ashford Trust's filings with the Securities and Exchange Commission.
The forward-looking statements included in this press release are only made as of the date of this press release. The Company can give no assurance that these forward-looking statements will be attained or that any deviation will not occur. We are not obligated to publicly update or revise any forward-looking statements, whether as a result of new information, future events or circumstances, changes in expectations or otherwise.
ASHFORD HOSPITALITY TRUST, INC. AND SUBSIDIARIES | |||||||||||
December 31, | December 31, | ||||||||||
ASSETS | |||||||||||
Investments in hotel properties, net | $ | 4,108,443 | $ | 4,105,219 | |||||||
Cash and cash equivalents | 262,636 | 319,210 | |||||||||
Restricted cash | 135,571 | 120,602 | |||||||||
Marketable securities | 14,591 | 21,816 | |||||||||
Accounts receivable, net of allowance of $698 and $485, respectively | 39,638 | 37,060 | |||||||||
Inventories | 4,346 | 4,224 | |||||||||
Notes receivable | 7,709 | — | |||||||||
Investment in Ashford Inc. | — | 1,896 | |||||||||
Investment in OpenKey | 2,829 | 2,593 | |||||||||
Deferred costs, net | 2,897 | 3,449 | |||||||||
Prepaid expenses | 21,886 | 19,982 | |||||||||
Derivative assets, net | 1,691 | 2,396 | |||||||||
Operating lease right-of-use assets | 49,995 | — | |||||||||
Other assets | 17,932 | 15,923 | |||||||||
Intangible assets, net | 797 | 9,824 | |||||||||
Due from related parties, net | 3,019 | — | |||||||||
Due from third-party hotel managers | 17,368 | 21,760 | |||||||||
Total assets | $ | 4,691,348 | $ | 4,685,954 | |||||||
LIABILITIES AND EQUITY | |||||||||||
Liabilities: | |||||||||||
Indebtedness, net | $ | 4,106,518 | $ | 3,927,266 | |||||||
Accounts payable and accrued expenses | 134,341 | 136,757 | |||||||||
Dividends and distributions payable | 20,849 | 26,794 | |||||||||
Due to Ashford Inc., net | 6,570 | 23,034 | |||||||||
Due to related parties, net | — | 1,477 | |||||||||
Due to third-party hotel managers | 2,509 | 2,529 | |||||||||
Intangible liabilities, net | 2,337 | 15,483 | |||||||||
Operating lease liabilities | 53,270 | — | |||||||||
Derivative liabilities, net | 42 | 50 | |||||||||
Other liabilities | 25,776 | 18,716 | |||||||||
Total liabilities | 4,352,212 | 4,152,106 | |||||||||
Redeemable noncontrolling interests in operating partnership | 69,870 | 80,743 | |||||||||
Equity: | |||||||||||
Preferred stock, $0.01 par value, 50,000,000 shares authorized : | |||||||||||
Series D Cumulative Preferred Stock 2,389,393 shares issued and outstanding at December 31, 2019 and 2018 | 24 | 24 | |||||||||
Series F Cumulative Preferred Stock 4,800,000 shares issued and outstanding at December 31, 2019 and 2018 | 48 | 48 | |||||||||
Series G Cumulative Preferred Stock 6,200,000 shares issued and outstanding at December 31, 2019 and 2018 | 62 | 62 | |||||||||
Series H Cumulative Preferred Stock 3,800,000 shares issued and outstanding at December 31, 2019 and 2018 | 38 | 38 | |||||||||
Series I Cumulative Preferred Stock 5,400,000 shares issued and outstanding at December 31, 2019 and 2018 | 54 | 54 | |||||||||
Common stock, $0.01 par value, 400,000,000 shares authorized, 102,103,602 and 101,035,530 shares issued and outstanding | 1,021 | 1,010 | |||||||||
Additional paid-in capital | 1,825,553 | 1,814,273 | |||||||||
Accumulated deficit | (1,558,038) | (1,363,020) | |||||||||
Total shareholders' equity of the Company | 268,762 | 452,489 | |||||||||
Noncontrolling interests in consolidated entities | 504 | 616 | |||||||||
Total equity | 269,266 | 453,105 | |||||||||
Total liabilities and equity | $ | 4,691,348 | $ | 4,685,954 | |||||||
ASHFORD HOSPITALITY TRUST, INC. AND SUBSIDIARIES | |||||||||||||||
Three Months Ended | Year Ended | ||||||||||||||
December 31, | December 31, | ||||||||||||||
2019 | 2018 | 2019 | 2018 | ||||||||||||
REVENUE | |||||||||||||||
Rooms | $ | 274,650 | $ | 266,597 | $ | 1,184,987 | $ | 1,134,687 | |||||||
Food and beverage | 61,820 | 59,442 | 243,917 | 224,311 | |||||||||||
Other | 17,223 | 16,424 | 69,653 | 67,782 | |||||||||||
Total hotel revenue | 353,693 | 342,463 | 1,498,557 | 1,426,780 | |||||||||||
Other | 963 | 1,025 | 4,202 | 4,009 | |||||||||||
Total revenue | 354,656 | 343,488 | 1,502,759 | 1,430,789 | |||||||||||
EXPENSES | |||||||||||||||
Hotel operating expenses | |||||||||||||||
Rooms | 63,186 | 60,642 | 258,446 | 248,139 | |||||||||||
Food and beverage | 42,411 | 40,632 | 167,945 | 156,902 | |||||||||||
Other expenses | 115,308 | 109,834 | 472,437 | 442,463 | |||||||||||
Management fees | 12,681 | 12,772 | 53,846 | 53,078 | |||||||||||
Total hotel operating expenses | 233,586 | 223,880 | 952,674 | 900,582 | |||||||||||
Property taxes, insurance and other | 19,979 | 18,992 | 84,110 | 78,355 | |||||||||||
Depreciation and amortization | 66,408 | 65,922 | 269,003 | 258,458 | |||||||||||
Impairment charges | 27,095 | 21,739 | 33,628 | 23,391 | |||||||||||
Transaction costs | — | — | 2 | 11 | |||||||||||
Advisory services fee: | |||||||||||||||
Base advisory fee | 8,969 | 8,882 | 36,269 | 35,526 | |||||||||||
Reimbursable expenses | 1,537 | 2,574 | 9,300 | 8,351 | |||||||||||
Non-cash stock/unit-based compensation | 4,577 | 4,705 | 18,063 | 25,245 | |||||||||||
Corporate, general and administrative: | |||||||||||||||
Non-cash stock/unit-based compensation | 82 | — | 886 | 536 | |||||||||||
Other general and administrative | 3,097 | 2,481 | 10,221 | 10,395 | |||||||||||
Total operating expenses | 365,330 | 349,175 | 1,414,156 | 1,340,850 | |||||||||||
Gain (loss) on sale of assets and hotel properties | 23,203 | 81 | 26,126 | 475 | |||||||||||
OPERATING INCOME (LOSS) | 12,529 | (5,606) | 114,729 | 90,414 | |||||||||||
Equity in earnings (loss) of unconsolidated entities | (99) | (25) | (2,307) | 867 | |||||||||||
Interest income | 665 | 1,173 | 3,067 | 3,952 | |||||||||||
Other income (expense), net | 11,472 | (16) | 10,490 | 64 | |||||||||||
Interest expense, net of premium amortization | (54,478) | (56,281) | (232,457) | (215,344) | |||||||||||
Amortization of loan costs | (7,014) | (6,825) | (29,544) | (21,442) | |||||||||||
Write-off of premiums, loan costs and exit fees | (263) | 469 | (2,841) | (8,847) | |||||||||||
Unrealized gain (loss) on marketable securities | 175 | (255) | 1,896 | (1,013) | |||||||||||
Unrealized gain (loss) on derivatives | (440) | 1,494 | (4,494) | (2,178) | |||||||||||
INCOME (LOSS) BEFORE INCOME TAXES | (37,453) | (65,872) | (141,461) | (153,527) | |||||||||||
Income tax benefit (expense) | 1,834 | (176) | (1,218) | (2,782) | |||||||||||
NET INCOME (LOSS) | (35,619) | (66,048) | (142,679) | (156,309) | |||||||||||
(Income) loss from consolidated entities attributable to noncontrolling interest | 110 | 22 | 112 | 30 | |||||||||||
Net (income) loss attributable to redeemable noncontrolling interests in operating partnership | 7,350 | 11,226 | 28,932 | 29,313 | |||||||||||
NET INCOME (LOSS) ATTRIBUTABLE TO THE COMPANY | (28,159) | (54,800) | (113,635) | (126,966) | |||||||||||
Preferred dividends | (10,644) | (10,644) | (42,577) | (42,577) | |||||||||||
NET INCOME (LOSS) ATTRIBUTABLE TO COMMON STOCKHOLDERS | $ | (38,803) | $ | (65,444) | $ | (156,212) | $ | (169,543) | |||||||
INCOME (LOSS) PER SHARE – BASIC AND DILUTED | |||||||||||||||
Basic: | |||||||||||||||
Net income (loss) attributable to common stockholders | $ | (0.39) | $ | (0.66) | $ | (1.58) | $ | (1.75) | |||||||
Weighted average common shares outstanding – basic | 99,968 | 99,324 | 99,837 | 97,282 | |||||||||||
Diluted: | |||||||||||||||
Net income (loss) attributable to common stockholders | $ | (0.39) | $ | (0.66) | $ | (1.58) | $ | (1.75) | |||||||
Weighted average common shares outstanding – diluted | 99,968 | 99,324 | 99,837 | 97,282 | |||||||||||
Dividends declared per common share: | $ | 0.06 | $ | 0.12 | $ | 0.30 | $ | 0.48 | |||||||
ASHFORD HOSPITALITY TRUST, INC. AND SUBSIDIARIES | |||||||||||||||
Three Months Ended | Year Ended | ||||||||||||||
December 31, | December 31, | ||||||||||||||
2019 | 2018 | 2019 | 2018 | ||||||||||||
Net income (loss) | $ | (35,619) | $ | (66,048) | $ | (142,679) | $ | (156,309) | |||||||
Interest expense and amortization of premiums and loan costs, net | 61,492 | 63,106 | 262,001 | 236,786 | |||||||||||
Depreciation and amortization | 66,408 | 65,922 | 269,003 | 258,458 | |||||||||||
Income tax expense (benefit) | (1,834) | 176 | 1,218 | 2,782 | |||||||||||
Equity in (earnings) loss of unconsolidated entities | 99 | 25 | 2,307 | (867) | |||||||||||
Company's portion of EBITDA of Ashford Inc. | (26) | 2,486 | 4,336 | 3,445 | |||||||||||
Company's portion of EBITDA of OpenKey | (95) | (153) | (403) | (572) | |||||||||||
EBITDA | 90,425 | 65,514 | 395,783 | 343,723 | |||||||||||
Impairment charges on real estate | 27,095 | 21,739 | 33,628 | 23,391 | |||||||||||
(Gain) loss on sale of assets and hotel properties | (23,203) | (81) | (26,126) | (475) | |||||||||||
EBITDAre | 94,317 | 87,172 | 403,285 | 366,639 | |||||||||||
Amortization of unfavorable contract liabilities | 16 | (38) | 176 | (155) | |||||||||||
Uninsured hurricane related costs | — | (20) | — | (291) | |||||||||||
(Gain) loss on insurance settlements | (407) | (928) | (450) | (928) | |||||||||||
Write-off of premiums, loan costs and exit fees | 263 | (469) | 2,841 | 8,847 | |||||||||||
Other (income) expense, net | (11,392) | 194 | (10,219) | 539 | |||||||||||
Transaction and conversion costs | 1,268 | 267 | 2,329 | 863 | |||||||||||
Legal, advisory and settlement costs | (406) | 156 | 1,660 | 1,084 | |||||||||||
Unrealized (gain) loss on marketable securities | (175) | 255 | (1,896) | 1,013 | |||||||||||
Unrealized (gain) loss on derivatives | 440 | (1,494) | 4,494 | 2,178 | |||||||||||
Dead deal costs | 28 | 236 | 78 | 291 | |||||||||||
Non-cash stock/unit-based compensation | 4,854 | 4,993 | 19,717 | 26,939 | |||||||||||
Company's portion of adjustments to EBITDAre of Ashford Inc. | 262 | (495) | 2,941 | 4,479 | |||||||||||
Company's portion of adjustments to EBITDAre of OpenKey | 6 | 16 | 49 | 17 | |||||||||||
Adjusted EBITDAre | $ | 89,074 | $ | 89,845 | $ | 425,005 | $ | 411,515 | |||||||
ASHFORD HOSPITALITY TRUST, INC. AND SUBSIDIARIES | |||||||||||||||
Three Months Ended | Year Ended | ||||||||||||||
December 31, | December 31, | ||||||||||||||
2019 | 2018 | 2019 | 2018 | ||||||||||||
Net income (loss) | $ | (35,619) | $ | (66,048) | $ | (142,679) | $ | (156,309) | |||||||
(Income) loss from consolidated entities attributable to noncontrolling interest | 110 | 22 | 112 | 30 | |||||||||||
Net (income) loss attributable to redeemable noncontrolling interests in operating partnership | 7,350 | 11,226 | 28,932 | 29,313 | |||||||||||
Preferred dividends | (10,644) | (10,644) | (42,577) | (42,577) | |||||||||||
Net income (loss) attributable to common stockholders | (38,803) | (65,444) | (156,212) | (169,543) | |||||||||||
Depreciation and amortization on real estate | 66,354 | 65,864 | 268,778 | 258,227 | |||||||||||
(Gain) loss on sale of assets and hotel properties | (23,203) | (81) | (26,126) | (475) | |||||||||||
Net income (loss) attributable to redeemable noncontrolling interests in operating partnership | (7,350) | (11,226) | (28,932) | (29,313) | |||||||||||
Equity in (earnings) loss of unconsolidated entities | 99 | 25 | 2,307 | (867) | |||||||||||
Impairment charges on real estate | 27,095 | 21,739 | 33,628 | 23,391 | |||||||||||
Company's portion of FFO of Ashford Inc. | (440) | 134 | (4,030) | 1,524 | |||||||||||
Company's portion of FFO of OpenKey | (99) | (155) | (396) | (581) | |||||||||||
FFO available to common stockholders and OP unitholders | 23,653 | 10,856 | 89,017 | 82,363 | |||||||||||
Write-off of premiums, loan costs and exit fees | 263 | (469) | 2,841 | 8,847 | |||||||||||
(Gain) loss on insurance settlements | (407) | (928) | (450) | (928) | |||||||||||
Uninsured hurricane related costs | — | (20) | — | (291) | |||||||||||
Other (income) expense, net | (11,392) | 194 | (10,219) | 539 | |||||||||||
Transaction and conversion costs | 1,268 | 267 | 2,329 | 863 | |||||||||||
Legal, advisory and settlement costs | (406) | 156 | 1,660 | 1,084 | |||||||||||
Unrealized (gain) loss on marketable securities | (175) | 255 | (1,896) | 1,013 | |||||||||||
Unrealized (gain) loss on derivatives | 440 | (1,494) | 4,494 | 2,178 | |||||||||||
Dead deal costs | 28 | 236 | 78 | 291 | |||||||||||
Non-cash stock/unit-based compensation | 4,854 | 4,993 | 19,717 | 26,939 | |||||||||||
Amortization of loan costs | 7,012 | 6,823 | 29,537 | 21,435 | |||||||||||
Company's portion of adjustments to FFO of Ashford Inc. | 557 | 199 | 8,319 | 907 | |||||||||||
Company's portion of adjustments to FFO of OpenKey | 9 | 17 | 55 | 21 | |||||||||||
Adjusted FFO available to common stockholders and OP unitholders | $ | 25,704 | $ | 21,085 | $ | 145,482 | $ | 145,261 | |||||||
Adjusted FFO per diluted share available to common stockholders and OP unitholders | $ | 0.22 | $ | 0.18 | $ | 1.22 | $ | 1.26 | |||||||
Weighted average diluted shares | 119,340 | 116,786 | 119,062 | 115,466 | |||||||||||
ASHFORD HOSPITALITY TRUST, INC. AND SUBSIDIARIES | |||||||||||||||||||||||
Indebtedness | Maturity | Interest Rate | Fixed- | Floating- | Total | Comparable | Comparable TTM EBITDA | ||||||||||||||||
JPMorgan Chase - 8 hotels | February 2020 | LIBOR + 2.92% | $ | — | $ | 395,000 | (1) | $ | 395,000 | $ | 40,665 | 10.3 | % | ||||||||||
BAML Highland Pool - 19 hotels | April 2020 | LIBOR + 3.20% | — | 907,030 | (1) | 907,030 | 105,297 | 11.6 | % | ||||||||||||||
BAML Le Pavillon - 1 hotel | June 2020 | LIBOR + 5.10% | — | 43,750 | (3) | 43,750 | 2,742 | 6.3 | % | ||||||||||||||
KEYS Pool A - 7 hotels | June 2020 | LIBOR + 3.65% | — | 180,720 | (1) | 180,720 | 20,886 | 11.6 | % | ||||||||||||||
KEYS Pool B - 7 hotels | June 2020 | LIBOR + 3.39% | — | 174,400 | (1) | 174,400 | 20,840 | 11.9 | % | ||||||||||||||
KEYS Pool C - 5 hotels | June 2020 | LIBOR + 3.73% | — | 221,040 | (1) | 221,040 | 20,481 | 9.3 | % | ||||||||||||||
KEYS Pool D - 5 hotels | June 2020 | LIBOR + 4.02% | — | 262,640 | (1) | 262,640 | 27,719 | 10.6 | % | ||||||||||||||
KEYS Pool E - 5 hotels | June 2020 | LIBOR + 2.73% | — | 160,000 | (1) | 160,000 | 24,361 | 15.2 | % | ||||||||||||||
KEYS Pool F - 5 hotels | June 2020 | LIBOR + 3.68% | — | 215,120 | (1) | 215,120 | 24,138 | 11.2 | % | ||||||||||||||
Morgan Stanley Ann Arbor - 1 hotel | July 2020 | LIBOR + 4.40% | — | 35,200 | (4) | 35,200 | 3,199 | 9.1 | % | ||||||||||||||
Morgan Stanley - 8 hotels | July 2020 | LIBOR + 4.33% | — | 144,000 | (4) | 144,000 | 10,635 | 7.4 | % | ||||||||||||||
GACC Gateway - 1 hotel | November 2020 | 6.26% | 91,542 | — | 91,542 | 13,164 | 14.4 | % | |||||||||||||||
JPMorgan Chase La Posada - 1 hotel | November 2020 | LIBOR + 2.55% | — | 25,000 | (5) | 25,000 | 4,143 | 16.6 | % | ||||||||||||||
Morgan Stanley Pool - 17 hotels | November 2020 | LIBOR + 3.00% | — | 419,000 | (6) | 419,000 | 48,565 | 11.6 | % | ||||||||||||||
BAML Princeton/Nashville - 2 hotels | March 2021 | LIBOR + 2.75% | — | 240,000 | (1) | 240,000 | 35,394 | 14.7 | % | ||||||||||||||
SPT Embassy Suites New York Manhattan Times | February 2022 | LIBOR + 3.90% | — | 145,000 | (2) | 145,000 | 8,609 | 5.9 | % | ||||||||||||||
Prudential Boston Back Bay - 1 hotel | November 2022 | LIBOR + 2.00% | — | 97,000 | 97,000 | 14,822 | 15.3 | % | |||||||||||||||
BAML Indigo Atlanta - 1 hotel | December 2022 | LIBOR + 2.25% | — | 16,100 | (2) | 16,100 | 2,660 | 15.7 | % | ||||||||||||||
Deutsche Bank W Minneapolis - 1 hotel | May 2023 | 5.46% | 51,843 | — | 51,843 | 4,843 | 9.3 | % | |||||||||||||||
Aareal Hilton Alexandria - 1 hotel | June 2023 | LIBOR + 2.45% | — | 73,450 | 73,450 | 7,853 | 10.7 | % | |||||||||||||||
GACC Manchester RI - 1 hotel | January 2024 | 5.49% | 6,759 | — | 6,759 | 1,152 | 17.0 | % | |||||||||||||||
GACC Jacksonville RI - 1 hotel | January 2024 | 5.49% | 9,865 | — | 9,865 | 1,944 | 19.7 | % | |||||||||||||||
Key Bank Manchester CY - 1 hotel | May 2024 | 4.99% | 6,292 | — | 6,292 | 1,060 | 16.8 | % | |||||||||||||||
Southside Bank Ashton - 1 hotel | June 2024 | LIBOR + 2.00% | — | 8,881 | 8,881 | 900 | 10.1 | % | |||||||||||||||
Morgan Stanley Pool C1 - 3 hotels | August 2024 | 5.20% | 64,207 | — | 64,207 | 6,807 | 10.6 | % | |||||||||||||||
Morgan Stanley Pool C2 - 2 hotels | August 2024 | 4.85% | 11,845 | — | 11,845 | 1,373 | 11.6 | % | |||||||||||||||
Morgan Stanley Pool C3 - 3 hotels | August 2024 | 4.90% | 23,683 | — | 23,683 | 2,844 | 12.0 | % | |||||||||||||||
BAML Pool 5 - 2 hotels | February 2025 | 4.45% | 19,438 | — | 19,438 | 2,409 | 12.4 | % | |||||||||||||||
BAML Pool 3 - 3 hotels | February 2025 | 4.45% | 50,279 | — | 50,279 | 8,937 | 17.8 | % | |||||||||||||||
US Bank Hilton Santa Cruz/Scotts Valley - 1 hotel | March 2025 | 4.66% | 24,919 | — | 24,919 | 2,342 | 9.4 | % | |||||||||||||||
Unencumbered hotels | — | — | — | 951 | N/A | ||||||||||||||||||
Total | $ | 360,672 | $ | 3,763,331 | $ | 4,124,003 | $ | 471,735 | 11.4 | % | |||||||||||||
Percentage | 8.7 | % | 91.3 | % | 100.0 | % | |||||||||||||||||
Weighted average interest rate | 5.30 | % | 5.06 | % | 5.08 | % | |||||||||||||||||
All indebtedness is non-recourse. | |||||||||||||||||||||||
ASHFORD HOSPITALITY TRUST, INC. AND SUBSIDIARIES | ||||||||||||||||||||||||||||
2020 | 2021 | 2022 | 2023 | 2024 | Thereafter | Total | ||||||||||||||||||||||
BAML Le Pavillon - 1 hotel | $ | 43,750 | $ | — | $ | — | $ | — | $ | — | $ | — | $ | 43,750 | ||||||||||||||
Morgan Stanley - 8 hotels | 144,000 | — | — | — | — | — | 144,000 | |||||||||||||||||||||
Morgan Stanley Ann Arbor - 1 hotel | 35,200 | — | — | — | — | — | 35,200 | |||||||||||||||||||||
GACC Gateway - 1 hotel | 89,886 | — | — | — | — | — | 89,886 | |||||||||||||||||||||
Prudential Boston Back Bay - 1 hotel | — | — | 97,000 | — | — | — | 97,000 | |||||||||||||||||||||
Deutsche Bank W Minneapolis - 1 hotel | — | — | — | 48,182 | — | — | 48,182 | |||||||||||||||||||||
Aareal Hilton Alexandria - 1 hotel | — | — | — | 73,450 | — | — | 73,450 | |||||||||||||||||||||
JPMorgan Chase La Posada - 1 hotel | — | — | — | 25,000 | — | — | 25,000 | |||||||||||||||||||||
GACC Jacksonville RI - 1 hotel | — | — | — | — | 9,036 | — | 9,036 | |||||||||||||||||||||
GACC Manchester RI - 1 hotel | — | — | — | — | 6,191 | — | 6,191 | |||||||||||||||||||||
SPT Embassy Suites New York Manhattan Times Square - 1 hotel | — | — | — | — | 145,000 | — | 145,000 | |||||||||||||||||||||
Key Bank Manchester CY - 1 hotel | — | — | — | — | 5,671 | — | 5,671 | |||||||||||||||||||||
Southside Bank Ashton - 1 hotel | — | — | — | — | 8,881 | — | 8,881 | |||||||||||||||||||||
Morgan Stanley Pool C1 - 3 hotels | — | — | — | — | 58,612 | — | 58,612 | |||||||||||||||||||||
Morgan Stanley Pool C2 - 2 hotels | — | — | — | — | 10,755 | — | 10,755 | |||||||||||||||||||||
Morgan Stanley Pool C3 - 3 hotels | — | — | — | — | 21,522 | — | 21,522 | |||||||||||||||||||||
Morgan Stanley Pool - 17 hotels | — | — | — | — | 419,000 | — | 419,000 | |||||||||||||||||||||
BAML Indigo Atlanta - 1 hotel | — | — | — | — | 15,781 | — | 15,781 | |||||||||||||||||||||
JPMorgan Chase - 8 hotels | — | — | — | — | — | 395,000 | 395,000 | |||||||||||||||||||||
BAML Pool 3 - 3 hotels | — | — | — | — | — | 44,413 | 44,413 | |||||||||||||||||||||
BAML Pool 5 - 2 hotels | — | — | — | — | — | 17,073 | 17,073 | |||||||||||||||||||||
US Bank Hilton Santa Cruz/Scotts Valley - 1 hotel | — | — | — | — | — | 22,030 | 22,030 | |||||||||||||||||||||
BAML Highland Pool - 19 hotels | — | — | — | — | — | 907,030 | 907,030 | |||||||||||||||||||||
KEYS Pool A - 7 hotels | — | — | — | — | — | 180,720 | 180,720 | |||||||||||||||||||||
KEYS Pool B - 7 hotels | — | — | — | — | — | 174,400 | 174,400 | |||||||||||||||||||||
KEYS Pool C - 5 hotels | — | — | — | — | — | 221,040 | 221,040 | |||||||||||||||||||||
KEYS Pool D - 5 hotels | — | — | — | — | — | 262,640 | 262,640 | |||||||||||||||||||||
KEYS Pool E - 5 hotels | — | — | — | — | — | 160,000 | 160,000 | |||||||||||||||||||||
KEYS Pool F - 5 hotels | — | — | — | — | — | 215,120 | 215,120 | |||||||||||||||||||||
BAML Princeton/Nashville - 2 hotels | — | — | — | — | — | 240,000 | 240,000 | |||||||||||||||||||||
Principal due in future periods | 312,836 | — | 97,000 | 146,632 | 700,449 | 2,839,466 | 4,096,383 | |||||||||||||||||||||
Scheduled amortization payments remaining | 6,614 | 5,485 | 5,767 | 5,402 | 4,250 | 102 | 27,620 | |||||||||||||||||||||
Total indebtedness | $ | 319,450 | $ | 5,485 | $ | 102,767 | $ | 152,034 | $ | 704,699 | $ | 2,839,568 | $ | 4,124,003 | ||||||||||||||
ASHFORD HOSPITALITY TRUST, INC. AND SUBSIDIARIES | ||||||||||||||||||||||||||||||
ALL HOTELS: | ||||||||||||||||||||||||||||||
Three Months Ended December 31, | ||||||||||||||||||||||||||||||
Actual | Non- | Comparable | Actual | Non- | Comparable | Actual | Comparable | |||||||||||||||||||||||
2019 | 2019 | 2019 | 2018 | 2018 | 2018 | % Variance | % Variance | |||||||||||||||||||||||
Rooms revenue (in thousands) | $ | 273,660 | $ | (499) | $ | 273,161 | $ | 265,654 | $ | 5,529 | $ | 271,183 | 3.01 | % | 0.73 | % | ||||||||||||||
RevPAR | $ | 118.92 | $ | (77.53) | $ | 119.04 | $ | 115.34 | $ | (614.56) | $ | 118.20 | 3.11 | % | 0.71 | % | ||||||||||||||
Occupancy | 73.16 | % | (73.03) | % | 73.16 | % | 72.88 | % | (23.44) | % | 73.26 | % | 0.38 | % | (0.14) | % | ||||||||||||||
ADR | $ | 162.55 | $ | (106.16) | $ | 162.71 | $ | 158.25 | $ | 2,622.02 | $ | 161.34 | 2.72 | % | 0.85 | % | ||||||||||||||
ALL HOTELS: | ||||||||||||||||||||||||||||||
Year Ended December 31, | ||||||||||||||||||||||||||||||
Actual | Non- | Comparable | Actual | Non- | Comparable | Actual | Comparable | |||||||||||||||||||||||
2019 | 2019 | 2019 | 2018 | 2018 | 2018 | % Variance | % Variance | |||||||||||||||||||||||
Rooms revenue (in thousands) | $ | 1,180,922 | $ | (13,245) | $ | 1,167,677 | $ | 1,130,258 | $ | 20,124 | $ | 1,150,382 | 4.48 | % | 1.50 | % | ||||||||||||||
RevPAR | $ | 127.84 | $ | (98.74) | $ | 128.26 | $ | 124.19 | $ | (5,052.74) | $ | 126.45 | 2.94 | % | 1.43 | % | ||||||||||||||
Occupancy | 76.35 | % | (77.74) | % | 76.33 | % | 76.40 | % | (292.39) | % | 76.56 | % | (0.07) | % | (0.30) | % | ||||||||||||||
ADR | $ | 167.44 | $ | (127.01) | $ | 168.04 | $ | 162.55 | $ | 1,728.07 | $ | 165.17 | 3.01 | % | 1.74 | % | ||||||||||||||
NOTES: | ||||||||||||||||||||||||||||||
ALL HOTELS | ||||||||||||||||||||||||||||||
Three Months Ended December 31, | ||||||||||||||||||||||||||||||
Actual | Non- | Comparable | Actual | Non- | Comparable | Actual | Comparable | |||||||||||||||||||||||
2019 | 2019 | 2019 | 2018 | 2018 | 2018 | % Variance | % Variance | |||||||||||||||||||||||
Rooms revenue (in thousands) | $ | 261,518 | $ | (499) | $ | 261,019 | $ | 252,448 | $ | 5,529 | $ | 257,977 | 3.59 | % | 1.18 | % | ||||||||||||||
RevPAR | $ | 118.85 | $ | (77.53) | $ | 118.97 | $ | 114.62 | $ | (614.56) | $ | 117.61 | 3.69 | % | 1.16 | % | ||||||||||||||
Occupancy | 73.42 | % | (73.03) | % | 73.42 | % | 72.92 | % | (23.44) | % | 73.32 | % | 0.69 | % | 0.14 | % | ||||||||||||||
ADR | $ | 161.88 | $ | (106.16) | $ | 162.04 | $ | 157.17 | $ | 2,622.02 | $ | 160.40 | 2.99 | % | 1.02 | % | ||||||||||||||
ALL HOTELS | ||||||||||||||||||||||||||||||
Year Ended December 31, | ||||||||||||||||||||||||||||||
Actual | Non- | Comparable | Actual | Non- | Comparable | Actual | Comparable | |||||||||||||||||||||||
2019 | 2019 | 2019 | 2018 | 2018 | 2018 | % Variance | % Variance | |||||||||||||||||||||||
Rooms revenue (in thousands) | $ | 1,128,899 | $ | (13,245) | $ | 1,115,654 | $ | 1,074,592 | $ | 20,124 | $ | 1,094,716 | 5.05 | % | 1.91 | % | ||||||||||||||
RevPAR | $ | 127.73 | $ | (98.74) | $ | 128.18 | $ | 123.49 | $ | (5,052.74) | $ | 125.86 | 3.43 | % | 1.84 | % | ||||||||||||||
Occupancy | 76.61 | % | (77.74) | % | 76.59 | % | 76.48 | % | (292.39) | % | 76.65 | % | 0.17 | % | (0.08) | % | ||||||||||||||
ADR | $ | 166.73 | $ | (127.01) | $ | 167.35 | $ | 161.47 | $ | 1,728.07 | $ | 164.21 | 3.26 | % | 1.91 | % | ||||||||||||||
NOTES: | ||||||||||||||||||||||||||||||
ASHFORD HOSPITALITY TRUST, INC. AND SUBSIDIARIES | |||||||||||||||||||||
ALL HOTELS: | Three Months Ended | Year Ended | |||||||||||||||||||
December 31, | December 31, | ||||||||||||||||||||
2019 | 2018 | % Variance | 2019 | 2018 | % Variance | ||||||||||||||||
Total hotel revenue | $ | 352,335 | $ | 341,229 | 3.25 | % | $ | 1,493,057 | $ | 1,421,032 | 5.07 | % | |||||||||
Non-comparable adjustments | (541) | 5,981 | (15,923) | 26,375 | |||||||||||||||||
Comparable total hotel revenue | $ | 351,794 | $ | 347,210 | 1.32 | % | $ | 1,477,134 | $ | 1,447,407 | 2.05 | % | |||||||||
Hotel EBITDA | $ | 103,346 | $ | 102,549 | 0.78 | % | $ | 476,378 | $ | 459,344 | 3.71 | % | |||||||||
Non-comparable adjustments | (140) | 2,963 | (4,643) | 10,035 | |||||||||||||||||
Comparable hotel EBITDA | $ | 103,206 | $ | 105,512 | (2.19) | % | $ | 471,735 | $ | 469,379 | 0.50 | % | |||||||||
Hotel EBITDA margin | 29.33 | % | 30.05 | % | (0.72) | % | 31.91 | % | 32.32 | % | (0.41) | % | |||||||||
Comparable hotel EBITDA margin | 29.34 | % | 30.39 | % | (1.05) | % | 31.94 | % | 32.43 | % | (0.49) | % | |||||||||
Hotel EBITDA adjustments attributable to consolidated noncontrolling interests | $ | 69 | $ | 63 | 9.52 | % | $ | 332 | $ | 321 | 3.43 | % | |||||||||
Hotel EBITDA attributable to the Company and OP unitholders | $ | 103,277 | $ | 102,486 | 0.77 | % | $ | 476,046 | $ | 459,023 | 3.71 | % | |||||||||
Comparable hotel EBITDA attributable to the Company and OP unitholders | $ | 103,137 | $ | 105,449 | (2.19) | % | $ | 471,403 | $ | 469,058 | 0.50 | % | |||||||||
NOTES: | |||||||||||||||||||||
ALL HOTELS | Three Months Ended | Year Ended | |||||||||||||||||||
December 31, | December 31, | ||||||||||||||||||||
2019 | 2018 | % Variance | 2019 | 2018 | % Variance | ||||||||||||||||
Total hotel revenue | $ | 335,340 | $ | 322,219 | 4.07 | % | $ | 1,420,298 | $ | 1,342,827 | 5.77 | % | |||||||||
Non-comparable adjustments | (541) | 5,981 | (15,923) | 26,375 | |||||||||||||||||
Comparable total hotel revenue | $ | 334,799 | $ | 328,200 | 2.01 | % | $ | 1,404,375 | $ | 1,369,202 | 2.57 | % | |||||||||
Hotel EBITDA | $ | 98,158 | $ | 96,376 | 1.85 | % | $ | 452,752 | $ | 432,594 | 4.66 | % | |||||||||
Non-comparable adjustments | (140) | 2,948 | (4,643) | 9,974 | |||||||||||||||||
Comparable hotel EBITDA | $ | 98,018 | $ | 99,324 | (1.31) | % | $ | 448,109 | $ | 442,568 | 1.25 | % | |||||||||
Hotel EBITDA margin | 29.27 | % | 29.91 | % | (0.64) | % | 31.88 | % | 32.22 | % | (0.34) | % | |||||||||
Comparable hotel EBITDA margin | 29.28 | % | 30.26 | % | (0.98) | % | 31.91 | % | 32.32 | % | (0.41) | % | |||||||||
Hotel EBITDA adjustments attributable to consolidated noncontrolling interests | $ | 69 | $ | 63 | 9.52 | % | $ | 332 | $ | 321 | 3.43 | % | |||||||||
Hotel EBITDA attributable to the Company and OP unitholders | $ | 98,089 | $ | 96,313 | 1.84 | % | $ | 452,420 | $ | 432,273 | 4.66 | % | |||||||||
Comparable hotel EBITDA attributable to the Company and OP unitholders | $ | 97,949 | $ | 99,261 | (1.32) | % | $ | 447,777 | $ | 442,247 | 1.25 | % | |||||||||
NOTES: | |||||||||||||||||||||
ASHFORD HOSPITALITY TRUST, INC. AND SUBSIDIARIES | |||||||||||||||||||||||||||||||||||||||||||||||
Actual | Non- | Comparable | Actual | Non- | Comparable | Actual | Non- | Comparable | Actual | Non- | Comparable | ||||||||||||||||||||||||||||||||||||
2019 | 2019 | 2019 | 2019 | 2019 | 2019 | 2019 | 2019 | 2019 | 2019 | 2019 | 2019 | ||||||||||||||||||||||||||||||||||||
4th Quarter | 4th Quarter | 4th Quarter | 3rd Quarter | 3rd Quarter | 3rd Quarter | 2nd Quarter | 2nd Quarter | 2nd Quarter | 1st Quarter | 1st Quarter | 1st Quarter | ||||||||||||||||||||||||||||||||||||
Total hotel revenue | $ | 352,335 | $ | (541) | $ | 351,794 | $ | 371,999 | $ | (3,272) | $ | 368,727 | $ | 412,671 | $ | (7,109) | $ | 405,562 | $ | 356,052 | $ | (5,001) | $ | 351,051 | |||||||||||||||||||||||
Hotel EBITDA | $ | 103,346 | $ | (140) | $ | 103,206 | $ | 115,796 | $ | (754) | $ | 115,042 | $ | 145,327 | $ | (1,866) | $ | 143,461 | $ | 111,909 | $ | (1,883) | $ | 110,026 | |||||||||||||||||||||||
Hotel EBITDA margin | 29.33 | % | 29.34 | % | 31.13 | % | 31.20 | % | 35.22 | % | 35.37 | % | 31.43 | % | 31.34 | % | |||||||||||||||||||||||||||||||
EBITDA % of total TTM | 21.7 | % | 21.9 | % | 24.3 | % | 24.4 | % | 30.5 | % | 30.4 | % | 23.7 | % | 22.8 | % | |||||||||||||||||||||||||||||||
JV interests in EBITDA | $ | 69 | $ | — | $ | 69 | $ | 98 | $ | — | $ | 98 | $ | 105 | $ | — | $ | 105 | $ | 60 | $ | — | $ | 60 | |||||||||||||||||||||||
Actual | Non- | Comparable | |||||||||||||||||||||||||||||||||||||||||||||
2019 | 2019 | 2019 | |||||||||||||||||||||||||||||||||||||||||||||
TTM | TTM | TTM | |||||||||||||||||||||||||||||||||||||||||||||
Total hotel revenue | $ | 1,493,057 | $ | (15,923) | $ | 1,477,134 | |||||||||||||||||||||||||||||||||||||||||
Hotel EBITDA | $ | 476,378 | $ | (4,643) | $ | 471,735 | |||||||||||||||||||||||||||||||||||||||||
Hotel EBITDA margin | 31.91 | % | 31.94 | % | |||||||||||||||||||||||||||||||||||||||||||
EBITDA % of total TTM | 100.0 | % | 100.0 | % | |||||||||||||||||||||||||||||||||||||||||||
JV interests in EBITDA | $ | 332 | $ | — | $ | 332 | |||||||||||||||||||||||||||||||||||||||||
NOTES: | |||||||||||||||||||||||||||||||||||||||||||||||
ASHFORD HOSPITALITY TRUST, INC. AND SUBSIDIARIES | |||||||||||||||||||||||||||||||||||
Three Months Ended December 31, | |||||||||||||||||||||||||||||||||||
Number of | Number of | Actual | Non-comparable | Comparable | Actual | Non-comparable | Comparable | Actual | Comparable | ||||||||||||||||||||||||||
2019 | 2019 | 2019 | 2018 | 2018 | 2018 | % Variance | % Variance | ||||||||||||||||||||||||||||
Atlanta, GA Area | 9 | 1,426 | $ | 129.79 | $ | — | $ | 129.79 | $ | 118.67 | $ | — | $ | 118.67 | 9.4 | % | 9.4 | % | |||||||||||||||||
Boston, MA Area | 3 | 915 | 170.20 | — | 170.20 | 180.40 | — | 180.40 | (5.7) | % | (5.7) | % | |||||||||||||||||||||||
Dallas / Ft. Worth, TX Area | 7 | 1,518 | 103.23 | — | 103.23 | 103.71 | — | 103.71 | (0.5) | % | (0.5) | % | |||||||||||||||||||||||
Houston, TX Area | 3 | 692 | 97.00 | — | 97.00 | 97.14 | — | 97.14 | (0.1) | % | (0.1) | % | |||||||||||||||||||||||
Los Angeles, CA Metro Area | 6 | 1,619 | 119.65 | — | 119.65 | 121.28 | — | 121.28 | (1.3) | % | (1.3) | % | |||||||||||||||||||||||
Miami, FL Metro Area | 3 | 588 | 128.56 | — | 128.56 | 117.61 | — | 117.61 | 9.3 | % | 9.3 | % | |||||||||||||||||||||||
Minneapolis - St. Paul, MN-WI Area | 4 | 809 | 94.26 | — | 94.26 | 106.27 | — | 106.27 | (11.3) | % | (11.3) | % | |||||||||||||||||||||||
Nashville, TN Area | 1 | 673 | 198.59 | — | 198.59 | 193.32 | — | 193.32 | 2.7 | % | 2.7 | % | |||||||||||||||||||||||
New York / New Jersey Metro Area | 7 | 2,051 | 134.35 | — | 134.35 | 110.79 | 253.52 | 132.36 | 21.3 | % | 1.5 | % | |||||||||||||||||||||||
Orlando, FL Area | 3 | 734 | 112.93 | — | 112.93 | 106.67 | — | 106.67 | 5.9 | % | 5.9 | % | |||||||||||||||||||||||
Philadelphia, PA Area | 3 | 648 | 100.72 | — | 100.72 | 97.27 | — | 97.27 | 3.5 | % | 3.5 | % | |||||||||||||||||||||||
San Diego, CA Area | 2 | 410 | 97.06 | — | 97.06 | 110.50 | — | 110.50 | (12.2) | % | (12.2) | % | |||||||||||||||||||||||
San Francisco - Oakland, CA Metro Area | 7 | 1,547 | 146.35 | — | 146.35 | 157.23 | 146.81 | 156.03 | (6.9) | % | (6.2) | % | |||||||||||||||||||||||
Tampa, FL Area | 2 | 571 | 106.56 | — | 106.56 | 101.67 | — | 101.67 | 4.8 | % | 4.8 | % | |||||||||||||||||||||||
Washington D.C. - MD - VA Area | 9 | 2,426 | 128.25 | — | 128.25 | 120.87 | — | 120.87 | 6.1 | % | 6.1 | % | |||||||||||||||||||||||
Other Areas | 48 | 8,315 | 103.61 | (77.53) | 103.83 | 101.28 | (76.16) | 103.05 | 2.3 | % | 0.8 | % | |||||||||||||||||||||||
Total Portfolio | 117 | 24,942 | $ | 118.92 | $ | (77.53) | $ | 119.04 | $ | 115.34 | $ | (614.56) | $ | 118.20 | 3.1 | % | 0.7 | % | |||||||||||||||||
NOTES: | |||||||||||||||||||||||||||||||||||
ASHFORD HOSPITALITY TRUST, INC. AND SUBSIDIARIES | |||||||||||||||||||||||||||||||||||||||||
Three Months Ended December 31, | |||||||||||||||||||||||||||||||||||||||||
Number | Number of | Actual | Non- | Comparable | % of | Actual | Non- | Comparable | % of | Actual | Comparable | ||||||||||||||||||||||||||||||
2019 | 2019 | 2019 | 2018 | 2018 | 2018 | % Variance | % Variance | ||||||||||||||||||||||||||||||||||
Atlanta, GA Area | 9 | 1,426 | $ | 6,787 | $ | (41) | $ | 6,746 | 6.5 | % | $ | 5,395 | $ | (30) | $ | 5,365 | 5.1 | % | 25.8 | % | 25.7 | % | |||||||||||||||||||
Boston, MA Area | 3 | 915 | 5,854 | — | 5,854 | 5.7 | % | 6,507 | 34 | 6,541 | 6.2 | % | (10.0) | % | (10.5) | % | |||||||||||||||||||||||||
Dallas / Ft. Worth, TX Area | 7 | 1,518 | 6,041 | — | 6,041 | 5.9 | % | 6,213 | 61 | 6,274 | 5.9 | % | (2.8) | % | (3.7) | % | |||||||||||||||||||||||||
Houston, TX Area | 3 | 692 | 2,362 | — | 2,362 | 2.3 | % | 2,352 | 29 | 2,381 | 2.3 | % | 0.4 | % | (0.8) | % | |||||||||||||||||||||||||
Los Angeles, CA Metro Area | 6 | 1,619 | 6,408 | (1) | 6,407 | 6.2 | % | 7,392 | (36) | 7,356 | 7.0 | % | (13.3) | % | (12.9) | % | |||||||||||||||||||||||||
Miami, FL Metro Area | 3 | 588 | 2,794 | — | 2,794 | 2.7 | % | 2,593 | (3) | 2,590 | 2.5 | % | 7.8 | % | 7.9 | % | |||||||||||||||||||||||||
Minneapolis - St. Paul, MN-WI Area | 4 | 809 | 1,333 | — | 1,333 | 1.3 | % | 2,737 | 15 | 2,752 | 2.6 | % | (51.3) | % | (51.6) | % | |||||||||||||||||||||||||
Nashville, TN Area | 1 | 673 | 7,692 | — | 7,692 | 7.5 | % | 5,989 | 1.00 | 5,990 | 5.7 | % | 28.4 | % | 28.4 | % | |||||||||||||||||||||||||
New York / New Jersey Metro Area | 7 | 2,051 | 9,491 | 297 | 9,788 | 9.5 | % | 7,503 | 2,747 | 10,250 | 9.7 | % | 26.5 | % | (4.5) | % | |||||||||||||||||||||||||
Orlando, FL Area | 3 | 734 | 2,600 | — | 2,600 | 2.5 | % | 2,301 | (5) | 2,296 | 2.2 | % | 13.0 | % | 13.2 | % | |||||||||||||||||||||||||
Philadelphia, PA Area | 3 | 648 | 2,100 | — | 2,100 | 2.0 | % | 1,887 | (30) | 1,857 | 1.8 | % | 11.3 | % | 13.1 | % | |||||||||||||||||||||||||
San Diego, CA Area | 2 | 410 | 1,040 | — | 1,040 | 1.0 | % | 1,498 | (7) | 1,491 | 1.4 | % | (30.6) | % | (30.2) | % | |||||||||||||||||||||||||
San Francisco - Oakland, CA Metro Area | 7 | 1,547 | 7,964 | — | 7,964 | 7.7 | % | 8,815 | 837 | 9,652 | 9.1 | % | (9.7) | % | (17.5) | % | |||||||||||||||||||||||||
Tampa, FL Area | 2 | 571 | 2,172 | (7) | 2,165 | 2.1 | % | 1,885 | 4 | 1,889 | 1.8 | % | 15.2 | % | 14.6 | % | |||||||||||||||||||||||||
Washington D.C. - MD - VA Area | 9 | 2,426 | 10,295 | (184) | 10,111 | 9.8 | % | 9,837 | 86 | 9,923 | 9.4 | % | 4.7 | % | 1.9 | % | |||||||||||||||||||||||||
Other Areas | 48 | 8,315 | 28,413 | (204) | 28,209 | 27.3 | % | 29,645 | (740) | 28,905 | 27.3 | % | (4.2) | % | (2.4) | % | |||||||||||||||||||||||||
Total Portfolio | 117 | 24,942 | $ | 103,346 | $ | (140) | $ | 103,206 | 100.0 | % | $ | 102,549 | $ | 2,963 | $ | 105,512 | 100.0 | % | 0.8 | % | (2.2) | % | |||||||||||||||||||
NOTES: | |||||||||||||||||||||||||||||||||||||||||
ASHFORD HOSPITALITY TRUST, INC. AND SUBSIDIARIES | |||||||||||||||||||||||||||||||||||
Year Ended December 31, | |||||||||||||||||||||||||||||||||||
Number | Number of | Actual | Non- | Comparable | Actual | Non- | Comparable | Actual | Comparable | ||||||||||||||||||||||||||
2019 | 2019 | 2019 | 2018 | 2018 | 2018 | % Variance | % Variance | ||||||||||||||||||||||||||||
Atlanta, GA Area | 9 | 1,426 | $ | 139.43 | $ | — | $ | 139.43 | $ | 128.22 | $ | — | $ | 128.22 | 8.7 | % | 8.7 | % | |||||||||||||||||
Boston, MA Area | 3 | 915 | 183.31 | — | 183.31 | 180.35 | — | 180.35 | 1.6 | % | 1.6 | % | |||||||||||||||||||||||
Dallas / Ft. Worth, TX Area | 7 | 1,518 | 108.16 | — | 108.16 | 111.74 | — | 111.74 | (3.2) | % | (3.2) | % | |||||||||||||||||||||||
Houston, TX Area | 3 | 692 | 103.09 | — | 103.09 | 106.04 | — | 106.04 | (2.8) | % | (2.8) | % | |||||||||||||||||||||||
Los Angeles, CA Metro Area | 6 | 1,619 | 133.16 | — | 133.16 | 131.95 | — | 131.95 | 0.9 | % | 0.9 | % | |||||||||||||||||||||||
Miami, FL Metro Area | 3 | 588 | 129.83 | — | 129.83 | 132.39 | — | 132.39 | (1.9) | % | (1.9) | % | |||||||||||||||||||||||
Minneapolis - St. Paul, MN-WI Area | 4 | 809 | 108.62 | — | 108.62 | 122.38 | — | 122.38 | (11.2) | % | (11.2) | % | |||||||||||||||||||||||
Nashville, TN Area | 1 | 673 | 210.17 | — | 210.17 | 204.04 | — | 204.04 | 3.0 | % | 3.0 | % | |||||||||||||||||||||||
New York / New Jersey Metro Area | 7 | 2,051 | 133.35 | 118.67 | 133.22 | 117.14 | 194.59 | 128.41 | 13.8 | % | 3.7 | % | |||||||||||||||||||||||
Orlando, FL Area | 3 | 734 | 113.47 | — | 113.47 | 108.12 | — | 108.12 | 4.9 | % | 4.9 | % | |||||||||||||||||||||||
Philadelphia, PA Area | 3 | 648 | 103.45 | — | 103.45 | 103.10 | — | 103.10 | 0.3 | % | 0.3 | % | |||||||||||||||||||||||
San Diego, CA Area | 2 | 410 | 119.20 | — | 119.20 | 122.90 | — | 122.90 | (3.0) | % | (3.0) | % | |||||||||||||||||||||||
San Francisco - Oakland, CA Metro Area | 7 | 1,547 | 164.20 | 109.80 | 163.24 | 162.88 | 158.30 | 162.35 | 0.8 | % | 0.5 | % | |||||||||||||||||||||||
Tampa, FL Area | 2 | 571 | 120.85 | — | 120.85 | 112.70 | (154.79) | 109.86 | 7.2 | % | 10.0 | % | |||||||||||||||||||||||
Washington D.C. - MD - VA Area | 9 | 2,426 | 140.12 | — | 140.12 | 134.23 | 235.98 | 137.53 | 4.4 | % | 1.9 | % | |||||||||||||||||||||||
Other Areas | 48 | 8,315 | 112.67 | (100.33) | 113.28 | 109.87 | (82.39) | 111.60 | 2.5 | % | 1.5 | % | |||||||||||||||||||||||
Total Portfolio | 117 | 24,942 | $ | 127.84 | $ | (98.74) | $ | 128.26 | $ | 124.19 | $ | (5,052.74) | $ | 126.45 | 2.9 | % | 1.4 | % | |||||||||||||||||
NOTES: | |||||||||||||||||||||||||||||||||||
ASHFORD HOSPITALITY TRUST, INC. AND SUBSIDIARIES | |||||||||||||||||||||||||||||||||||||||||
Year Ended December 31, | |||||||||||||||||||||||||||||||||||||||||
Number | Number of | Actual | Non- | Comparable | % of | Actual | Non- | Comparable | % of | Actual | Comparable | ||||||||||||||||||||||||||||||
2019 | 2019 | 2019 | 2018 | 2018 | 2018 | % Variance | % Variance | ||||||||||||||||||||||||||||||||||
Atlanta, GA Area | 9 | 1,426 | $ | 28,838 | $ | (33) | $ | 28,805 | 6.1 | % | $ | 24,039 | $ | (14) | $ | 24,025 | 5.1 | % | 19.9 | % | 19.9 | % | |||||||||||||||||||
Boston, MA Area | 3 | 915 | 25,890 | — | 25,890 | 5.5 | % | 25,777 | 134 | 25,911 | 5.5 | % | 0.4 | % | (0.1) | % | |||||||||||||||||||||||||
Dallas / Ft. Worth, TX Area | 7 | 1,518 | 25,694 | — | 25,694 | 5.4 | % | 26,839 | 247 | 27,086 | 5.8 | % | (4.3) | % | (5.1) | % | |||||||||||||||||||||||||
Houston, TX Area | 3 | 692 | 10,304 | — | 10,304 | 2.2 | % | 11,360 | 114 | 11,474 | 2.4 | % | (9.3) | % | (10.2) | % | |||||||||||||||||||||||||
Los Angeles, CA Metro Area | 6 | 1,619 | 32,052 | (1) | 32,051 | 6.8 | % | 33,109 | (143) | 32,966 | 7.0 | % | (3.2) | % | (2.8) | % | |||||||||||||||||||||||||
Miami, FL Metro Area | 3 | 588 | 11,003 | — | 11,003 | 2.3 | % | 11,966 | (12) | 11,954 | 2.5 | % | (8.0) | % | (8.0) | % | |||||||||||||||||||||||||
Minneapolis - St. Paul, MN-WI Area | 4 | 809 | 9,518 | — | 9,518 | 2.0 | % | 14,256 | 63 | 14,319 | 3.1 | % | (33.2) | % | (33.5) | % | |||||||||||||||||||||||||
Nashville, TN Area | 1 | 673 | 31,204 | — | 31,204 | 6.6 | % | 24,655 | — | 24,655 | 5.3 | % | 26.6 | % | 26.6 | % | |||||||||||||||||||||||||
New York / New Jersey Metro Area | 7 | 2,051 | 37,686 | 315 | 38,001 | 8.1 | % | 30,488 | 6,408 | 36,896 | 7.9 | % | 23.6 | % | 3.0 | % | |||||||||||||||||||||||||
Orlando, FL Area | 3 | 734 | 10,247 | — | 10,247 | 2.2 | % | 9,482 | (19) | 9,463 | 2.0 | % | 8.1 | % | 8.3 | % | |||||||||||||||||||||||||
Philadelphia, PA Area | 3 | 648 | 8,248 | — | 8,248 | 1.7 | % | 8,441 | (121) | 8,320 | 1.8 | % | (2.3) | % | (0.9) | % | |||||||||||||||||||||||||
San Diego, CA Area | 2 | 410 | 6,591 | — | 6,591 | 1.4 | % | 7,272 | (29) | 7,243 | 1.5 | % | (9.4) | % | (9.0) | % | |||||||||||||||||||||||||
San Francisco - Oakland, CA Metro Area | 7 | 1,547 | 39,151 | 218 | 39,369 | 8.3 | % | 36,892 | 4,226 | 41,118 | 8.8 | % | 6.1 | % | (4.3) | % | |||||||||||||||||||||||||
Tampa, FL Area | 2 | 571 | 10,879 | (7) | 10,872 | 2.3 | % | 10,853 | (1,156) | 9,697 | 2.1 | % | 0.2 | % | 12.1 | % | |||||||||||||||||||||||||
Washington D.C. - MD - VA Area | 9 | 2,426 | 48,486 | (73) | 48,413 | 10.3 | % | 42,924 | 4,822 | 47,746 | 10.2 | % | 13.0 | % | 1.5 | % | |||||||||||||||||||||||||
Other Areas | 48 | 8,315 | 140,587 | (5,062) | 135,525 | 28.8 | % | 140,991 | (4,485) | 136,506 | 29.0 | % | (0.3) | % | (0.7) | % | |||||||||||||||||||||||||
Total Portfolio | 117 | 24,942 | $ | 476,378 | $ | (4,643) | $ | 471,735 | 100.0 | % | $ | 459,344 | $ | 10,035 | $ | 469,379 | 100.0 | % | 3.7 | % | 0.5 | % | |||||||||||||||||||
NOTES: | |||||||||||||||||||||||||||||||||||||||||
ASHFORD HOSPITALITY TRUST, INC. AND SUBSIDIARIES | |||
December 31, 2019 | |||
Common stock shares outstanding | 102,104 | ||
Partnership units outstanding | 21,941 | ||
Combined common stock shares and partnership units outstanding | 124,045 | ||
Common stock price | $ | 2.79 | |
Market capitalization | $ | 346,086 | |
Series D cumulative preferred stock | $ | 59,735 | |
Series F cumulative preferred stock | $ | 120,000 | |
Series G cumulative preferred stock | $ | 155,000 | |
Series H cumulative preferred stock | $ | 95,000 | |
Series I cumulative preferred stock | $ | 135,000 | |
Indebtedness | $ | 4,124,003 | |
Joint venture partner's share of consolidated indebtedness | $ | (1,958) | |
Net working capital (see below) | $ | (331,273) | |
Total enterprise value (TEV) | $ | 4,701,593 | |
Cash and cash equivalents | $ | 262,414 | |
Restricted cash | $ | 135,363 | |
Accounts receivable, net | $ | 39,630 | |
Prepaid expenses | $ | 21,882 | |
Investment in securities | $ | 14,591 | |
Due from third-party hotel managers, net | $ | 14,857 | |
Total current assets | $ | 488,737 | |
Accounts payable, net & accrued expenses | $ | 133,069 | |
Dividends and distributions payable | $ | 20,849 | |
Due to affiliates, net | $ | 3,546 | |
Total current liabilities | $ | 157,464 | |
Net working capital* | $ | 331,273 | |
* Includes the Company's pro rata share of net working capital in joint ventures. | |||
ASHFORD HOSPITALITY TRUST, INC. AND SUBSIDIARIES | ||||||||||
2019 | 2020 | |||||||||
1st | 2nd | 3rd | 4th | 1st | 2nd | 3rd | 4th | |||
Rooms | Actual | Actual | Actual | Actual | Estimated | Estimated | Estimated | Estimated | ||
Courtyard Crystal City Reagan Airport | 272 | x | ||||||||
Courtyard Louisville Airport | 150 | x | ||||||||
Embassy Suites Crystal City | 269 | x | x | |||||||
Fairfield Inn and Suites Kennesaw | 86 | x | x | |||||||
Hampton Inn Buford Mall of Georgia | 92 | x | ||||||||
Hampton Inn Suites Columbus Easton | 145 | x | ||||||||
Hilton Alexandria Old Town | 252 | x | ||||||||
Hilton Fort Worth | 294 | x | x | x | ||||||
Hilton Garden Inn BWI Airport | 158 | x | x | |||||||
Hilton Santa Cruz Scotts Valley | 178 | x | x | |||||||
Hyatt Regency Coral Gables | 254 | x | ||||||||
Hyatt Regency Savannah | 351 | x | x | |||||||
Hyatt Regency Windwatch | 358 | x | ||||||||
Marriott Bridgewater | 347 | x | x | x | ||||||
Marriott Crystal Gateway | 701 | x | ||||||||
Marriott DFW Airport | 491 | x | x | x | ||||||
Marriott Fremont Silicon Valley | 357 | x | x | x | x | |||||
Marriott Omaha | 300 | x | x | |||||||
Marriott RTP | 225 | x | x | |||||||
One Ocean Resort | 193 | x | ||||||||
Renaissance Nashville | 673 | x | x | x | ||||||
Ritz-Carlton Atlanta | 444 | x | ||||||||
Sheraton Ann Arbor | 197 | x | x | |||||||
W Atlanta Downtown | 237 | x | ||||||||
W Minneapolis Hotel - The Foshay | 229 | x | x | |||||||
Westin Princeton | 296 | x | ||||||||
Total | 11 | 4 | 5 | 4 | 6 | 3 | 5 | 8 | ||
(a) Only hotels which have had or are expected to have significant capital expenditures that could result in displacement in 2019 or 2020 are included in this table. | ||||||||||
Exhibit 1 | |||||||||||||||||||
ASHFORD HOSPITALITY TRUST, INC. AND SUBSIDIARIES | |||||||||||||||||||
2019 | 2019 | 2019 | 2019 | December 31, 2019 | |||||||||||||||
4th Quarter | 3rd Quarter | 2nd Quarter | 1st Quarter | TTM | |||||||||||||||
Net income (loss) | $ | 24,896 | $ | 42,625 | $ | 63,002 | $ | 38,235 | $ | 168,758 | |||||||||
Non-property adjustments | 3,678 | (2,274) | 6,205 | (268) | 7,341 | ||||||||||||||
Interest income | (51) | (103) | (76) | (76) | (306) | ||||||||||||||
Interest expense | 4,616 | 5,004 | 5,165 | 4,423 | 19,208 | ||||||||||||||
Amortization of loan costs | 452 | 447 | 440 | 424 | 1,763 | ||||||||||||||
Depreciation and amortization | 66,925 | 67,681 | 67,303 | 66,987 | 268,896 | ||||||||||||||
Income tax expense (benefit) | 174 | 44 | 63 | 43 | 324 | ||||||||||||||
Non-hotel EBITDA ownership expense | 2,656 | 2,372 | 3,225 | 2,141 | 10,394 | ||||||||||||||
Hotel EBITDA including amounts attributable to | 103,346 | 115,796 | 145,327 | 111,909 | 476,378 | ||||||||||||||
Non-comparable adjustments | (140) | (754) | (1,866) | (1,883) | (4,643) | ||||||||||||||
Comparable hotel EBITDA | $ | 103,206 | $ | 115,042 | $ | 143,461 | $ | 110,026 | $ | 471,735 | |||||||||
NOTES: | |||||||||||||||||||
|
Exhibit 1 | |||||||||||||||||||||||
ASHFORD HOSPITALITY TRUST, INC. AND SUBSIDIARIES | |||||||||||||||||||||||
Three Months Ended December 31, 2019 | |||||||||||||||||||||||
Hotel | Hotel | Hotel Total | Orlando WorldQuest Resort | Corporate / Allocated | Ashford | ||||||||||||||||||
Net income (loss) | $ | 23,789 | $ | 1,107 | $ | 24,896 | $ | 52 | $ | (60,567) | $ | (35,619) | |||||||||||
Non-property adjustments | 3,678 | — | 3,678 | — | (3,678) | — | |||||||||||||||||
Interest income | (43) | (8) | (51) | — | 51 | — | |||||||||||||||||
Interest expense | 4,616 | — | 4,616 | — | 49,862 | 54,478 | |||||||||||||||||
Amortization of loan cost | 452 | — | 452 | — | 6,562 | 7,014 | |||||||||||||||||
Depreciation and amortization | 63,361 | 3,564 | 66,925 | 166 | (683) | 66,408 | |||||||||||||||||
Income tax expense (benefit) | 173 | 1 | 174 | — | (2,008) | (1,834) | |||||||||||||||||
Non-hotel EBITDA ownership expense | 2,132 | 524 | 2,656 | 7 | (2,663) | — | |||||||||||||||||
Hotel EBITDA including amounts attributable to noncontrolling | 98,158 | 5,188 | 103,346 | 225 | (13,124) | 90,447 | |||||||||||||||||
Less: EBITDA adjustments attributable to consolidated | (69) | — | (69) | — | 69 | — | |||||||||||||||||
Equity in (earnings) loss of unconsolidated entities | — | — | — | — | 99 | 99 | |||||||||||||||||
Company's portion of EBITDA of Ashford Inc. | — | — | — | — | (26) | (26) | |||||||||||||||||
Company's portion of EBITDA of OpenKey | — | — | — | — | (95) | (95) | |||||||||||||||||
Hotel EBITDA attributable to the Company and OP unitholders | $ | 98,089 | $ | 5,188 | $ | 103,277 | $ | 225 | $ | (13,077) | $ | 90,425 | |||||||||||
Non-comparable adjustments | (140) | — | (140) | ||||||||||||||||||||
Comparable hotel EBITDA | $ | 98,018 | $ | 5,188 | $ | 103,206 | |||||||||||||||||
NOTES: | |||||||||||||||||||||||
|
Exhibit 1 | |||||||||||||||||||||||
ASHFORD HOSPITALITY TRUST, INC. AND SUBSIDIARIES | |||||||||||||||||||||||
Three Months Ended December 31, 2018 | |||||||||||||||||||||||
Hotel | Hotel | Hotel Total | Orlando WorldQuest Resort | Corporate / Allocated | Ashford | ||||||||||||||||||
Net income (loss) | $ | 7,516 | $ | 3,304 | $ | 10,820 | $ | 25 | $ | (76,893) | $ | (66,048) | |||||||||||
Non-property adjustments | 20,729 | 1 | 20,730 | — | (20,730) | — | |||||||||||||||||
Interest income | (63) | (27) | (90) | — | 90 | — | |||||||||||||||||
Interest expense | 2,355 | — | 2,355 | — | 53,926 | 56,281 | |||||||||||||||||
Amortization of loan cost | 210 | — | 210 | — | 6,615 | 6,825 | |||||||||||||||||
Depreciation and amortization | 62,897 | 2,840 | 65,737 | 138 | 47 | 65,922 | |||||||||||||||||
Income tax expense (benefit) | 109 | — | 109 | — | 67 | 176 | |||||||||||||||||
Non-hotel EBITDA ownership expense | 2,623 | 55 | 2,678 | 13 | (2,691) | — | |||||||||||||||||
Hotel EBITDA including amounts attributable to noncontrolling | 96,376 | 6,173 | 102,549 | 176 | (39,569) | 63,156 | |||||||||||||||||
Less: EBITDA adjustments attributable to consolidated | 63 | — | 63 | — | (63) | — | |||||||||||||||||
Equity in (earnings) loss of unconsolidated entities | — | — | — | — | 25 | 25 | |||||||||||||||||
Company's portion of EBITDA of Ashford Inc. | — | — | — | — | 2,486 | 2,486 | |||||||||||||||||
Company's portion of EBITDA of OpenKey | — | — | — | — | (153) | (153) | |||||||||||||||||
Hotel EBITDA attributable to the Company and OP unitholders | $ | 96,439 | $ | 6,173 | $ | 102,612 | $ | 176 | $ | (37,274) | $ | 65,514 | |||||||||||
Non-comparable adjustments | 2,948 | 15 | 2,963 | ||||||||||||||||||||
Comparable hotel EBITDA | $ | 99,324 | $ | 6,188 | $ | 105,512 | |||||||||||||||||
NOTES: | |||||||||||||||||||||||
|
Exhibit 1 | |||||||||||||||||||||||
ASHFORD HOSPITALITY TRUST, INC. AND SUBSIDIARIES | |||||||||||||||||||||||
Year Ended December 31, 2019 | |||||||||||||||||||||||
Hotel Properties Not Under Renovation | Hotel Properties Under Renovation | Hotel Total | Orlando WorldQuest Resort | Corporate / Allocated | Ashford Hospitality Trust, Inc. | ||||||||||||||||||
Net income (loss) | $ | 157,978 | $ | 10,780 | $ | 168,758 | $ | 358 | $ | (311,795) | $ | (142,679) | |||||||||||
Non-property adjustments | 7,341 | — | 7,341 | (70) | (7,271) | — | |||||||||||||||||
Interest income | (223) | (83) | (306) | — | 306 | — | |||||||||||||||||
Interest expense | 19,208 | — | 19,208 | — | 213,249 | 232,457 | |||||||||||||||||
Amortization of loan cost | 1,763 | — | 1,763 | — | 27,781 | 29,544 | |||||||||||||||||
Depreciation and amortization | 256,532 | 12,364 | 268,896 | 644 | (537) | 269,003 | |||||||||||||||||
Income tax expense (benefit) | 324 | — | 324 | — | 894 | 1,218 | |||||||||||||||||
Non-hotel EBITDA ownership expense | 9,829 | 565 | 10,394 | 33 | (10,427) | — | |||||||||||||||||
Hotel EBITDA including amounts attributable to noncontrolling | 452,752 | 23,626 | 476,378 | 965 | (87,800) | 389,543 | |||||||||||||||||
Less: EBITDA adjustments attributable to consolidated | (332) | — | (332) | — | 332 | — | |||||||||||||||||
Equity in (earnings) loss of unconsolidated entities | — | — | — | — | 2,307 | 2,307 | |||||||||||||||||
Company's portion of EBITDA of Ashford Inc. | — | — | — | — | 4,336 | 4,336 | |||||||||||||||||
Company's portion of EBITDA of OpenKey | — | — | — | — | (403) | (403) | |||||||||||||||||
Hotel EBITDA attributable to the Company and OP unitholders | $ | 452,420 | $ | 23,626 | $ | 476,046 | $ | 965 | $ | (81,228) | $ | 395,783 | |||||||||||
Non-comparable adjustments | (4,643) | — | (4,643) | ||||||||||||||||||||
Comparable hotel EBITDA | $ | 448,109 | $ | 23,626 | $ | 471,735 | |||||||||||||||||
NOTES: | |||||||||||||||||||||||
|
Exhibit 1 | |||||||||||||||||||||||
ASHFORD HOSPITALITY TRUST, INC. AND SUBSIDIARIES | |||||||||||||||||||||||
Year Ended December 31, 2018 | |||||||||||||||||||||||
Hotel | Hotel | Hotel Total | Orlando WorldQuest Resort | Corporate / Allocated | Ashford Hospitality Trust, Inc. | ||||||||||||||||||
Net income (loss) | $ | 148,510 | $ | 14,408 | $ | 162,918 | $ | 843 | $ | (320,070) | $ | (156,309) | |||||||||||
Non-property adjustments | 21,988 | — | 21,988 | — | (21,988) | — | |||||||||||||||||
Interest income | (167) | (84) | (251) | — | 251 | — | |||||||||||||||||
Interest expense | 7,685 | — | 7,685 | — | 207,659 | 215,344 | |||||||||||||||||
Amortization of loan cost | 649 | — | 649 | — | 20,793 | 21,442 | |||||||||||||||||
Depreciation and amortization | 245,707 | 12,029 | 257,736 | 528 | 194 | 258,458 | |||||||||||||||||
Income tax expense (benefit) | 132 | — | 132 | — | 2,650 | 2,782 | |||||||||||||||||
Non-hotel EBITDA ownership expense | 8,090 | 397 | 8,487 | 32 | (8,519) | — | |||||||||||||||||
Hotel EBITDA including amounts attributable to noncontrolling | 432,594 | 26,750 | 459,344 | 1,403 | (119,030) | 341,717 | |||||||||||||||||
Less: EBITDA adjustments attributable to consolidated | (321) | — | (321) | — | 321 | — | |||||||||||||||||
Equity in (earnings) loss of unconsolidated entities | — | — | — | — | (867) | (867) | |||||||||||||||||
Company's portion of EBITDA of Ashford Inc. | — | — | — | — | 3,445 | 3,445 | |||||||||||||||||
Company's portion of EBITDA of OpenKey | — | — | — | — | (572) | (572) | |||||||||||||||||
Hotel EBITDA attributable to the Company and OP unitholders | $ | 432,273 | $ | 26,750 | $ | 459,023 | $ | 1,403 | $ | (116,703) | $ | 343,723 | |||||||||||
Non-comparable adjustments | 9,974 | 61 | 10,035 | ||||||||||||||||||||
Comparable hotel EBITDA | $ | 442,568 | $ | 26,811 | $ | 469,379 | |||||||||||||||||
NOTES: | |||||||||||||||||||||||
|
Exhibit 1 | |||||||||||||||||||||||||||||||||||
ASHFORD HOSPITALITY TRUST, INC. AND SUBSIDIARIES | |||||||||||||||||||||||||||||||||||
Three Months Ended December 31, 2019 | |||||||||||||||||||||||||||||||||||
Atlanta, GA Area | Boston, MA Area | Dallas / | Houston, | Los | Miami, FL Metro Area | Minneapolis - | Nashville, | New York / New Jersey Metro Area | |||||||||||||||||||||||||||
Net income (loss) | $ | 2,293 | $ | 1,557 | $ | 1,313 | $ | 861 | $ | 2,294 | $ | 468 | $ | (1,149) | $ | 4,798 | $ | 2,229 | |||||||||||||||||
Non-property adjustments | 193 | — | — | — | (92) | — | — | — | — | ||||||||||||||||||||||||||
Interest income | (1) | — | (2) | — | (2) | (1) | (5) | — | (4) | ||||||||||||||||||||||||||
Interest expense | 198 | 953 | — | — | — | — | — | — | 2,078 | ||||||||||||||||||||||||||
Amortization of loan costs | 41 | 58 | — | — | — | — | — | — | 185 | ||||||||||||||||||||||||||
Depreciation and amortization | 3,984 | 3,175 | 4,625 | 1,454 | 4,230 | 2,270 | 2,110 | 2,596 | 4,626 | ||||||||||||||||||||||||||
Income tax expense (benefit) | — | — | — | — | — | — | — | 66 | 62 | ||||||||||||||||||||||||||
Non-hotel EBITDA ownership expense | 79 | 111 | 105 | 47 | (22) | 57 | 377 | 232 | 315 | ||||||||||||||||||||||||||
Hotel EBITDA including amounts attributable | 6,787 | 5,854 | 6,041 | 2,362 | 6,408 | 2,794 | 1,333 | 7,692 | 9,491 | ||||||||||||||||||||||||||
Non-comparable adjustments | (41) | — | — | — | (1) | — | — | — | 297 | ||||||||||||||||||||||||||
Comparable hotel EBITDA | $ | 6,746 | $ | 5,854 | $ | 6,041 | $ | 2,362 | $ | 6,407 | $ | 2,794 | $ | 1,333 | $ | 7,692 | $ | 9,788 | |||||||||||||||||
Orlando, | Philadelphia, PA Area | San Diego, | San | Tampa, FL | Washington D.C. - MD - | Other Areas | Total | ||||||||||||||||||||||||||||
Net income (loss) | $ | 394 | $ | 534 | $ | 289 | $ | 3,929 | $ | 20,069 | $ | 1,170 | $ | (16,153) | $ | 24,896 | |||||||||||||||||||
Non-property adjustments | — | — | — | — | (19,418) | — | 22,995 | 3,678 | |||||||||||||||||||||||||||
Interest income | (3) | (1) | (1) | (9) | — | (11) | (11) | (51) | |||||||||||||||||||||||||||
Interest expense | — | — | — | 297 | — | 806 | 284 | 4,616 | |||||||||||||||||||||||||||
Amortization of loan costs | — | — | — | 15 | — | 58 | 95 | 452 | |||||||||||||||||||||||||||
Depreciation and amortization | 2,248 | 1,558 | 793 | 3,442 | 1,580 | 8,062 | 20,172 | 66,925 | |||||||||||||||||||||||||||
Income tax expense (benefit) | — | 15 | — | — | — | — | 31 | 174 | |||||||||||||||||||||||||||
Non-hotel EBITDA ownership expense | (39) | (6) | (41) | 290 | (59) | 210 | 1,000 | 2,656 | |||||||||||||||||||||||||||
Hotel EBITDA including amounts attributable t | 2,600 | 2,100 | 1,040 | 7,964 | 2,172 | 10,295 | 28,413 | 103,346 | |||||||||||||||||||||||||||
Non-comparable adjustments | — | — | — | — | (7) | (184) | (204) | (140) | |||||||||||||||||||||||||||
Comparable hotel EBITDA | $ | 2,600 | $ | 2,100 | $ | 1,040 | $ | 7,964 | $ | 2,165 | $ | 10,111 | $ | 28,209 | $ | 103,206 | |||||||||||||||||||
NOTES: | |||||||||||||||||||||||||||||||||||
|
Exhibit 1 | |||||||||||||||||||||||||||||||||||
ASHFORD HOSPITALITY TRUST, INC. AND SUBSIDIARIES | |||||||||||||||||||||||||||||||||||
Three Months Ended December 31, 2018 | |||||||||||||||||||||||||||||||||||
Atlanta, | Boston, MA Area | Dallas / | Houston, | Los Angeles, CA Metro | Miami, FL Metro Area | Minneapolis - St. Paul, MN - | Nashville, | New York / | |||||||||||||||||||||||||||
Net income (loss) | $ | 1,672 | $ | 1,590 | $ | 2,359 | $ | 1,381 | $ | 2,770 | $ | 294 | $ | 362 | $ | 3,382 | $ | 3,301 | |||||||||||||||||
Non-property adjustments | (1) | — | — | (485) | — | — | — | — | — | ||||||||||||||||||||||||||
Interest income | (1) | — | (3) | — | (3) | — | (19) | — | (11) | ||||||||||||||||||||||||||
Interest expense | 208 | 1,068 | — | — | — | — | — | — | — | ||||||||||||||||||||||||||
Amortization of loan costs | 39 | 57 | — | — | — | — | — | — | — | ||||||||||||||||||||||||||
Depreciation and amortization | 3,463 | 3,329 | 3,724 | 1,365 | 4,567 | 2,151 | 2,363 | 2,446 | 4,080 | ||||||||||||||||||||||||||
Income tax expense (benefit) | — | — | — | — | — | — | — | 129 | (4) | ||||||||||||||||||||||||||
Non-hotel EBITDA ownership expense | 15 | 463 | 133 | 91 | 58 | 148 | 31 | 32 | 137 | ||||||||||||||||||||||||||
Hotel EBITDA including amounts attributable | 5,395 | 6,507 | 6,213 | 2,352 | 7,392 | 2,593 | 2,737 | 5,989 | 7,503 | ||||||||||||||||||||||||||
Non-comparable adjustments | (30) | 34 | 61 | 29 | (36) | (3) | 15 | 1 | 2,747 | ||||||||||||||||||||||||||
Comparable hotel EBITDA | $ | 5,365 | $ | 6,541 | $ | 6,274 | $ | 2,381 | $ | 7,356 | $ | 2,590 | $ | 2,752 | $ | 5,990 | $ | 10,250 | |||||||||||||||||
Orlando, | Philadelphia, PA Area | San Diego, | San | Tampa, FL Area | Washington D.C. - MD - | Other Areas | Total | ||||||||||||||||||||||||||||
Net income (loss) | $ | (19) | $ | 133 | $ | 528 | $ | 5,500 | $ | 240 | $ | 1,080 | $ | (13,753) | $ | 10,820 | |||||||||||||||||||
Non-property adjustments | — | — | — | — | (4) | (77) | 21,297 | 20,730 | |||||||||||||||||||||||||||
Interest income | (3) | (1) | (1) | (8) | — | (20) | (20) | (90) | |||||||||||||||||||||||||||
Interest expense | — | — | — | — | — | 892 | 187 | 2,355 | |||||||||||||||||||||||||||
Amortization of loan costs | — | — | — | — | — | 56 | 58 | 210 | |||||||||||||||||||||||||||
Depreciation and amortization | 2,243 | 1,623 | 834 | 3,191 | 1,547 | 7,801 | 21,010 | 65,737 | |||||||||||||||||||||||||||
Income tax expense (benefit) | — | 8 | — | — | — | — | (24) | 109 | |||||||||||||||||||||||||||
Non-hotel EBITDA ownership expense | 80 | 124 | 137 | 132 | 102 | 105 | 890 | 2,678 | |||||||||||||||||||||||||||
Hotel EBITDA including amounts attributable | 2,301 | 1,887 | 1,498 | 8,815 | 1,885 | 9,837 | 29,645 | 102,549 | |||||||||||||||||||||||||||
Non-comparable adjustments | (5) | (30) | (7) | 837 | 4 | 86 | (740) | 2,963 | |||||||||||||||||||||||||||
Comparable hotel EBITDA | $ | 2,296 | $ | 1,857 | $ | 1,491 | $ | 9,652 | $ | 1,889 | $ | 9,923 | $ | 28,905 | $ | 105,512 | |||||||||||||||||||
NOTES: | |||||||||||||||||||||||||||||||||||
|
Exhibit 1 | |||||||||||||||||||||||||||||||||||
ASHFORD HOSPITALITY TRUST, INC. AND SUBSIDIARIES | |||||||||||||||||||||||||||||||||||
Year Ended December 31, 2019 | |||||||||||||||||||||||||||||||||||
Atlanta, | Boston, MA Area | Dallas / | Houston, | Los Angeles, CA Metro Area | Miami, FL Metro Area | Minneapolis - St. Paul, MN - WI Area | Nashville, | New York / New Jersey Metro Area | |||||||||||||||||||||||||||
Net income (loss) | $ | 11,157 | $ | 8,527 | $ | 8,211 | $ | 4,149 | $ | 14,190 | $ | 1,703 | $ | 572 | $ | 20,162 | $ | 8,591 | |||||||||||||||||
Non-property adjustments | 193 | — | — | (43) | (92) | — | (47) | — | (326) | ||||||||||||||||||||||||||
Interest income | (4) | — | (9) | — | (12) | (4) | (54) | — | (35) | ||||||||||||||||||||||||||
Interest expense | 841 | 4,191 | — | — | — | — | — | — | 8,432 | ||||||||||||||||||||||||||
Amortization of loan costs | 162 | 230 | — | — | — | — | — | — | 722 | ||||||||||||||||||||||||||
Depreciation and amortization | 15,684 | 12,606 | 17,105 | 5,807 | 17,581 | 9,095 | 8,445 | 10,146 | 18,581 | ||||||||||||||||||||||||||
Income tax expense (benefit) | — | — | — | — | — | — | — | 190 | 62 | ||||||||||||||||||||||||||
Non-hotel EBITDA ownership expense | 805 | 336 | 387 | 391 | 385 | 209 | 602 | 706 | 1,659 | ||||||||||||||||||||||||||
Hotel EBITDA including amounts attributable | 28,838 | 25,890 | 25,694 | 10,304 | 32,052 | 11,003 | 9,518 | 31,204 | 37,686 | ||||||||||||||||||||||||||
Non-comparable adjustments | (33) | — | — | — | (1) | — | — | — | 315 | ||||||||||||||||||||||||||
Comparable hotel EBITDA | $ | 28,805 | $ | 25,890 | $ | 25,694 | $ | 10,304 | $ | 32,051 | $ | 11,003 | $ | 9,518 | $ | 31,204 | $ | 38,001 | |||||||||||||||||
Orlando, | Philadelphia, PA Area | San Diego, CA Area | San Francisco - Oakland, | Tampa, FL Area | Washington D.C. - MD - VA Area | Other Areas | Total | ||||||||||||||||||||||||||||
Net income (loss) | $ | 1,270 | $ | 1,634 | $ | 3,391 | $ | 23,552 | $ | 23,904 | $ | 12,121 | $ | 25,624 | $ | 168,758 | |||||||||||||||||||
Non-property adjustments | — | — | — | (71) | (19,419) | — | 27,146 | 7,341 | |||||||||||||||||||||||||||
Interest income | (15) | (4) | (6) | (39) | — | (63) | (61) | (306) | |||||||||||||||||||||||||||
Interest expense | — | — | — | 1,005 | — | 3,511 | 1,228 | 19,208 | |||||||||||||||||||||||||||
Amortization of loan costs | — | — | — | 50 | — | 227 | 372 | 1,763 | |||||||||||||||||||||||||||
Depreciation and amortization | 8,859 | 6,440 | 3,213 | 13,399 | 6,335 | 32,129 | 83,471 | 268,896 | |||||||||||||||||||||||||||
Income tax expense (benefit) | — | 15 | — | — | — | — | 57 | 324 | |||||||||||||||||||||||||||
Non-hotel EBITDA ownership expense | 133 | 163 | (7) | 1,255 | 59 | 561 | 2,750 | 10,394 | |||||||||||||||||||||||||||
Hotel EBITDA including amounts attributable | 10,247 | 8,248 | 6,591 | 39,151 | 10,879 | 48,486 | 140,587 | 476,378 | |||||||||||||||||||||||||||
Non-comparable adjustments | — | — | — | 218 | (7) | (73) | (5,062) | (4,643) | |||||||||||||||||||||||||||
Comparable hotel EBITDA | $ | 10,247 | $ | 8,248 | $ | 6,591 | $ | 39,369 | $ | 10,872 | $ | 48,413 | $ | 135,525 | $ | 471,735 | |||||||||||||||||||
NOTES: | |||||||||||||||||||||||||||||||||||
|
Exhibit 1 | |||||||||||||||||||||||||||||||||||
ASHFORD HOSPITALITY TRUST, INC. AND SUBSIDIARIES | |||||||||||||||||||||||||||||||||||
Year Ended December 31, 2018 | |||||||||||||||||||||||||||||||||||
Atlanta, | Boston, MA Area | Dallas / | Houston, | Los Angeles, CA Metro Area | Miami, FL Metro Area | Minneapolis - St. Paul, MN - WI Area | Nashville, | New York / New Jersey Metro Area | |||||||||||||||||||||||||||
Net income (loss) | $ | 10,008 | $ | 6,369 | $ | 12,431 | $ | 6,072 | $ | 14,506 | $ | 3,952 | $ | 4,131 | $ | 15,477 | $ | 13,660 | |||||||||||||||||
Non-property adjustments | (1) | — | — | (619) | — | (120) | — | — | — | ||||||||||||||||||||||||||
Interest income | (4) | — | (8) | — | (10) | (2) | (57) | — | (32) | ||||||||||||||||||||||||||
Interest expense | 791 | 3,914 | — | — | — | — | — | — | — | ||||||||||||||||||||||||||
Amortization of loan costs | 154 | 222 | — | — | — | — | — | — | — | ||||||||||||||||||||||||||
Depreciation and amortization | 12,694 | 14,505 | 14,004 | 5,467 | 18,325 | 7,867 | 10,002 | 8,972 | 16,467 | ||||||||||||||||||||||||||
Income tax expense (benefit) | — | — | — | — | — | — | — | 129 | (4) | ||||||||||||||||||||||||||
Non-hotel EBITDA ownership expense | 397 | 767 | 412 | 440 | 288 | 269 | 180 | 77 | 397 | ||||||||||||||||||||||||||
Hotel EBITDA including amounts attributable | 24,039 | 25,777 | 26,839 | 11,360 | 33,109 | 11,966 | 14,256 | 24,655 | 30,488 | ||||||||||||||||||||||||||
Non-comparable adjustments | (14) | 134 | 247 | 114 | (143) | (12) | 63 | — | 6,408 | ||||||||||||||||||||||||||
Comparable hotel EBITDA | $ | 24,025 | $ | 25,911 | $ | 27,086 | $ | 11,474 | $ | 32,966 | $ | 11,954 | $ | 14,319 | $ | 24,655 | $ | 36,896 | |||||||||||||||||
Orlando, | Philadelphia, PA Area | San Diego, CA Area | San Francisco - Oakland, | Tampa, FL Area | Washington D.C. - MD - VA Area | Other Areas | Total | ||||||||||||||||||||||||||||
Net income (loss) | $ | 1,338 | $ | 1,606 | $ | 3,146 | $ | 23,997 | $ | 4,356 | $ | 10,431 | $ | 31,438 | $ | 162,918 | |||||||||||||||||||
Non-property adjustments | (39) | — | — | — | (378) | 1,864 | 21,281 | 21,988 | |||||||||||||||||||||||||||
Interest income | (10) | (3) | (4) | (23) | — | (43) | (55) | (251) | |||||||||||||||||||||||||||
Interest expense | — | — | — | — | — | 1,764 | 1,216 | 7,685 | |||||||||||||||||||||||||||
Amortization of loan costs | — | — | — | — | — | 110 | 163 | 649 | |||||||||||||||||||||||||||
Depreciation and amortization | 8,059 | 6,517 | 3,525 | 12,478 | 6,615 | 28,399 | 83,840 | 257,736 | |||||||||||||||||||||||||||
Income tax expense (benefit) | — | 8 | — | — | — | — | (1) | 132 | |||||||||||||||||||||||||||
Non-hotel EBITDA ownership expense | 134 | 313 | 605 | 440 | 260 | 399 | 3,109 | 8,487 | |||||||||||||||||||||||||||
Hotel EBITDA including amounts attributable | 9,482 | 8,441 | 7,272 | 36,892 | 10,853 | 42,924 | 140,991 | 459,344 | |||||||||||||||||||||||||||
Non-comparable adjustments | (19) | (121) | (29) | 4,226 | (1,156) | 4,822 | (4,485) | 10,035 | |||||||||||||||||||||||||||
Comparable hotel EBITDA | $ | 9,463 | $ | 8,320 | $ | 7,243 | $ | 41,118 | $ | 9,697 | $ | 47,746 | $ | 136,506 | $ | 469,379 | |||||||||||||||||||
NOTES: | |||||||||||||||||||||||||||||||||||
|
Exhibit 1 | |||||||||||||||||||||||||||||||||||||||||||
ASHFORD HOSPITALITY TRUST, INC. AND SUBSIDIARIES | |||||||||||||||||||||||||||||||||||||||||||
TTM Ended December 31, 2019 | |||||||||||||||||||||||||||||||||||||||||||
KEYS Pool | KEYS Pool | KEYS Pool | KEYS Pool | KEYS Pool E - | KEYS Pool F - | BAML | Morgan | Morgan | JP Morgan Chase - 8 | BAML | |||||||||||||||||||||||||||||||||
Net income (loss) | $ | 12,858 | $ | 12,375 | $ | 3,853 | $ | 13,636 | $ | 9,686 | $ | 9,040 | $ | 41,210 | $ | 38,908 | $ | (25,862) | $ | 17,011 | $ | 2,774 | |||||||||||||||||||||
Non-property adjustments | — | — | — | — | — | — | 2,532 | (19,553) | 27,095 | (223) | — | ||||||||||||||||||||||||||||||||
Interest income | (21) | (15) | (2) | — | — | (30) | — | (18) | — | (114) | (7) | ||||||||||||||||||||||||||||||||
Interest expense | — | — | — | — | — | — | — | — | 8 | 4 | — | ||||||||||||||||||||||||||||||||
Amortization of loan costs | — | — | — | — | — | — | — | — | — | — | — | ||||||||||||||||||||||||||||||||
Depreciation and amortization | 7,988 | 8,220 | 16,184 | 13,894 | 13,650 | 14,298 | 63,073 | 28,416 | 9,077 | 23,365 | 6,096 | ||||||||||||||||||||||||||||||||
Income tax expense (benefit) | 15 | 62 | — | — | 11 | — | — | — | — | — | — | ||||||||||||||||||||||||||||||||
Non-hotel EBITDA ownership expense | 96 | 199 | 446 | 189 | 1,015 | 830 | 2,168 | 813 | 317 | 623 | 73 | ||||||||||||||||||||||||||||||||
Hotel EBITDA including amounts | 20,936 | 20,841 | 20,481 | 27,719 | 24,362 | 24,138 | 108,983 | 48,566 | 10,635 | 40,666 | 8,936 | ||||||||||||||||||||||||||||||||
Non-comparable adjustments | (50) | (1) | — | — | (1) | — | (3,686) | (1) | — | (1) | 1 | ||||||||||||||||||||||||||||||||
Comparable hotel EBITDA | $ | 20,886 | $ | 20,840 | $ | 20,481 | $ | 27,719 | $ | 24,361 | $ | 24,138 | $ | 105,297 | $ | 48,565 | $ | 10,635 | $ | 40,665 | $ | 8,937 | |||||||||||||||||||||
Morgan | Morgan | BAML | Morgan | BAML | Aareal Hilton Alexandria - 1 hotel | Morgan | Southside Bank | BAML | Prudential Boston Back Bay - 1 hotel | GACC | |||||||||||||||||||||||||||||||||
Net income (loss) | $ | 1,637 | $ | 965 | $ | 1,809 | $ | 108 | $ | 20,890 | $ | 1,331 | $ | 1,685 | $ | 308 | $ | (204) | $ | 3,877 | $ | 1,412 | |||||||||||||||||||||
Non-property adjustments | — | — | (6) | — | — | — | — | — | 193 | — | — | ||||||||||||||||||||||||||||||||
Interest income | (1) | — | (7) | — | — | (36) | — | — | — | — | — | ||||||||||||||||||||||||||||||||
Interest expense | — | — | — | — | — | 3,512 | — | — | 841 | 4,191 | — | ||||||||||||||||||||||||||||||||
Amortization of loan costs | — | — | — | — | — | 227 | — | — | 162 | 230 | — | ||||||||||||||||||||||||||||||||
Depreciation and amortization | 5,033 | 1,790 | 640 | 1,217 | 13,117 | 2,688 | 1,547 | 572 | 1,556 | 6,353 | 11,735 | ||||||||||||||||||||||||||||||||
Income tax expense (benefit) | — | — | — | — | 189 | — | — | — | — | — | — | ||||||||||||||||||||||||||||||||
Non-hotel EBITDA ownership expense | 137 | 90 | (27) | 49 | 973 | 203 | (32) | 20 | 113 | 169 | 16 | ||||||||||||||||||||||||||||||||
Hotel EBITDA including amounts | 6,806 | 2,845 | 2,409 | 1,374 | 35,169 | 7,925 | 3,200 | 900 | 2,661 | 14,820 | 13,163 | ||||||||||||||||||||||||||||||||
Non-comparable adjustments | 1 | (1) | — | (1) | 225 | (72) | (1) | — | (1) | 2 | 1 | ||||||||||||||||||||||||||||||||
Comparable hotel EBITDA | $ | 6,807 | $ | 2,844 | $ | 2,409 | $ | 1,373 | $ | 35,394 | $ | 7,853 | $ | 3,199 | $ | 900 | $ | 2,660 | $ | 14,822 | $ | 13,164 | |||||||||||||||||||||
GACC Jacksonville | JPMorgan Chase La Posada-1 | BAML Le Pavillon - 1 | Key Bank Manchester | GACC Manchester | Deutsche | SPT Embassy Suites New | US Bank Hilton Santa Cruz/Scotts Valley - 1 hotel | NorthStar | Unencumbered hotels | Total Portfolio | |||||||||||||||||||||||||||||||||
Net income (loss) | $ | (341) | $ | 1,067 | $ | (990) | $ | 503 | $ | 204 | $ | 1,919 | $ | (3,549) | $ | (347) | $ | (1,637) | $ | 2,622 | $ | 168,758 | |||||||||||||||||||||
Non-property adjustments | — | (117) | — | — | — | — | (326) | (71) | 1,677 | (3,860) | 7,341 | ||||||||||||||||||||||||||||||||
Interest income | — | — | — | — | — | (56) | — | — | — | 1 | (306) | ||||||||||||||||||||||||||||||||
Interest expense | — | 1,218 | — | — | — | — | 8,431 | 1,004 | — | (1) | 19,208 | ||||||||||||||||||||||||||||||||
Amortization of loan costs | — | 372 | — | — | — | — | 721 | 50 | — | 1 | 1,763 | ||||||||||||||||||||||||||||||||
Depreciation and amortization | 2,033 | 1,340 | 3,616 | 521 | 915 | 2,663 | 2,837 | 969 | 409 | 3,084 | 268,896 | ||||||||||||||||||||||||||||||||
Income tax expense (benefit) | — | — | — | 32 | 15 | — | — | — | — | — | 324 | ||||||||||||||||||||||||||||||||
Non-hotel EBITDA ownership expense | 253 | 263 | 116 | 5 | 19 | 316 | 424 | 517 | 17 | (16) | 10,394 | ||||||||||||||||||||||||||||||||
Hotel EBITDA including amounts | 1,945 | 4,143 | 2,742 | 1,061 | 1,153 | 4,842 | 8,538 | 2,122 | 466 | 1,831 | 476,378 | ||||||||||||||||||||||||||||||||
Non-comparable adjustments | (1) | — | — | (1) | (1) | 1 | 71 | 220 | (466) | (880) | (4,643) | ||||||||||||||||||||||||||||||||
Comparable hotel EBITDA | $ | 1,944 | $ | 4,143 | $ | 2,742 | $ | 1,060 | $ | 1,152 | $ | 4,843 | $ | 8,609 | $ | 2,342 | $ | — | $ | 951 | $ | 471,735 | |||||||||||||||||||||
NOTES: | |||||||||||||||||||||||||||||||||||||||||||
SOURCE Ashford Hospitality Trust, Inc.



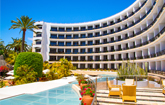

Share this article