Brookdale Announces First Quarter 2026 Results

BRENTWOOD, Tenn., May 6, 2026 /PRNewswire/ -- Brookdale Senior Living Inc. (NYSE: BKD) ("Brookdale" or the "Company") announced results for the quarter ended March 31, 2026.
HIGHLIGHTS
- Increased first quarter 2026 consolidated revenue per available unit (RevPAR) by 8.2% year-over-year.
- Improved first quarter 2026 consolidated weighted average occupancy by 280 basis points year-over-year to 82.1%.
- Net loss for the first quarter of 2026 was $7 million compared to a net loss of $65 million for the first quarter of 2025. Adjusted EBITDA(1) of $131 million for the first quarter of 2026 grew 5.6% over the first quarter of 2025.
- Beneficially refinanced and extended a significant portion of the Company's 2027 debt maturities during the first quarter.
- Received over $100 million of cash proceeds for communities sold in 2026 to date.
"Over the past six months, we have executed on a significant number of meaningful changes that have Brookdale strongly positioned for the next wave of growth," said Nick Stengle, Brookdale's Chief Executive Officer. "Our pricing is improving, our organization and cost structure are more streamlined, and our portfolio optimization is proceeding as planned. The table is now set for Brookdale to capitalize on the compelling supply-demand dynamic shaping up in the senior housing macroeconomic environment and to drive durable growth. Operating income improved from the start to the end of the quarter, and April's occupancy trends are solidly on track for us to deliver on our full year 2026 guidance levels of RevPAR year-over-year growth of 8% to 9% and $502 million to $516 million in Adjusted EBITDA."
SUMMARY OF FIRST QUARTER FINANCIAL RESULTS
Consolidated summary of operating results and metrics:
Year-Over-Year Increase / |
Sequential Increase / |
|||||||
($ in millions, except RevPAR and RevPOR) |
1Q 2026 |
1Q 2025 |
Amount |
Percent |
4Q 2025 |
Amount |
Percent |
|
Resident fees |
$ 722.5 |
$ 777.5 |
$ (55.0) |
(7.1) % |
$ 714.5 |
$ 8.0 |
1.1 % |
|
Facility operating expense |
511.5 |
557.0 |
(45.5) |
(8.2) % |
529.7 |
(18.2) |
(3.4) % |
|
Cash facility operating lease payments |
44.7 |
56.7 |
(12.0) |
(21.2) % |
43.7 |
1.0 |
2.3 % |
|
Net income (loss) |
(6.9) |
(65.0) |
(58.1) |
(89.4) % |
(40.0) |
(33.1) |
(82.7) % |
|
Adjusted EBITDA |
131.1 |
124.1 |
7.0 |
5.6 % |
105.6 |
25.5 |
24.2 % |
|
RevPAR |
$ 5,506 |
$ 5,090 |
$ 416 |
8.2 % |
$ 5,219 |
$ 287 |
5.5 % |
|
Weighted average occupancy |
82.1 % |
79.3 % |
280 bps |
n/a |
82.5 % |
(40) bps |
n/a |
|
RevPOR |
$ 6,705 |
$ 6,416 |
$ 289 |
4.5 % |
$ 6,324 |
$ 381 |
6.0 % |
|
Total average units |
43,637 |
50,840 |
(7,203) |
(14.2) % |
45,526 |
(1,889) |
(4.1) % |
|
(1) |
Adjusted EBITDA is a financial measure that is not calculated in accordance with GAAP. See "Non-GAAP Financial Measure" for the Company's definition of such measure, a reconciliation to the most comparable GAAP financial measure, and other important information regarding the use of the Company's non-GAAP financial measure. |
Same community(2) summary of operating results and metrics:
Year-Over-Year Increase / |
Sequential Increase / |
|||||||
($ in millions, except RevPAR and RevPOR) |
1Q 2026 |
1Q 2025 |
Amount |
Percent |
4Q 2025 |
Amount |
Percent |
|
Resident fees |
$ 690.9 |
$ 654.7 |
$ 36.2 |
5.5 % |
$ 656.6 |
$ 34.3 |
5.2 % |
|
Facility operating expense |
$ 481.1 |
$ 454.2 |
$ 26.9 |
5.9 % |
$ 474.7 |
$ 6.4 |
1.4 % |
|
RevPAR |
$ 5,580 |
$ 5,288 |
$ 292 |
5.5 % |
$ 5,303 |
$ 277 |
5.2 % |
|
Weighted average occupancy |
82.7 % |
81.0 % |
170 bps |
n/a |
83.5 % |
(80) bps |
n/a |
|
RevPOR |
$ 6,745 |
$ 6,526 |
$ 219 |
3.4 % |
$ 6,348 |
$ 397 |
6.3 % |
|
(2) |
The same community senior housing portfolio includes operating results and data for 516 communities consolidated and operational for the full period in both comparison years. Consolidated communities excluded from the same community portfolio include communities acquired or disposed of since the beginning of the prior year, communities classified as assets held for sale, certain communities planned for disposition including through asset sales or lease terminations, certain communities that have undergone or are undergoing expansion, redevelopment, and repositioning projects, and certain communities that have experienced a casualty event that significantly impacts their operations. To aid in comparability, same community operating results exclude natural disaster expense. The same community portfolio excludes 23 communities, including 22 communities (1,983 units) that the Company sold subsequent to March 31, 2026 or plans to sell. |
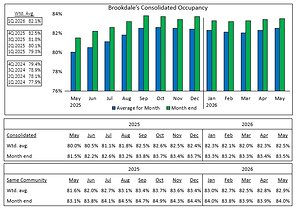
SUMMARY OF OCCUPANCY TREND
Recent consolidated occupancy trend:
2025 |
||||||||||||
Jan |
Feb |
Mar |
Apr |
May |
Jun |
Jul |
Aug |
Sep |
Oct |
Nov |
Dec |
|
Weighted average |
79.2 % |
79.3 % |
79.5 % |
79.8 % |
80.0 % |
80.5 % |
81.1 % |
81.8 % |
82.5 % |
82.6 % |
82.5 % |
82.4 % |
Month end |
80.6 % |
80.8 % |
80.9 % |
81.0 % |
81.5 % |
82.2 % |
82.6 % |
83.2 % |
83.8 % |
83.7 % |
83.4 % |
83.7 % |
2026 |
||||||||||||
Jan |
Feb |
Mar |
Apr |
|||||||||
Weighted average |
82.3 % |
82.1 % |
82.0 % |
82.3 % |
||||||||
Month end |
83.3 % |
83.2 % |
83.3 % |
83.4 % |
||||||||
Recent same community occupancy trend:
2025 |
||||||||||||
Jan |
Feb |
Mar |
Apr |
May |
Jun |
Jul |
Aug |
Sep |
Oct |
Nov |
Dec |
|
Weighted average |
80.9 % |
81.0 % |
81.2 % |
81.5 % |
81.6 % |
82.0 % |
82.7 % |
83.1 % |
83.4 % |
83.7 % |
83.6 % |
83.4 % |
Month end |
82.3 % |
82.5 % |
82.6 % |
82.7 % |
83.1 % |
83.8 % |
84.1 % |
84.5 % |
84.7 % |
84.9 % |
84.3 % |
84.4 % |
2026 |
||||||||||||
Jan |
Feb |
Mar |
Apr |
|||||||||
Weighted average |
83.0 % |
82.7 % |
82.5 % |
82.8 % |
||||||||
Month end |
84.0 % |
83.8 % |
83.9 % |
83.9 % |
||||||||
OVERVIEW OF FIRST QUARTER RESULTS
- Resident fees.
- 1Q 2026 vs 1Q 2025:
- The decrease was primarily due to the disposition of communities, primarily through lease terminations, since the beginning of the prior year period, which resulted in $93.1 million less in resident fees during the first quarter of 2026.
- The decrease was partially offset by the 5.5% increase in same community resident fees, which was primarily due to the increase in RevPOR, primarily the result of the current year annual rate increase, and the 170 basis point increase in same community weighted average occupancy.
- 1Q 2026 vs 4Q 2025:
- The increase was due to the 5.2% increase in same community resident fees, which was due to the 6.3% increase in RevPOR, reflecting the annual in-place rate increases effective January 1, 2026, partially offset by a seasonal decrease in same community occupancy of 80 basis points.
- The increase was partially offset by the disposition of communities, primarily through lease terminations, since the beginning of the prior period, which resulted in $26.4 million less in resident fees during the first quarter of 2026.
- 1Q 2026 vs 1Q 2025:
- Facility operating expense.
- 1Q 2026 vs 1Q 2025:
- The decrease was primarily due to the disposition of communities since the beginning of the prior year period, which resulted in $72.0 million less in facility operating expense during the first quarter of 2026.
- The decrease was partially offset by the 5.9% increase in same community facility operating expense, which was primarily due to increases in wage rates, increases in estimated insurance expense, and increases in utilities and maintenance expenses associated with winter storm activity.
- 1Q 2026 vs 4Q 2025:
- The decrease was primarily due to the disposition of communities since the beginning of the prior period, which resulted in $24.7 million less in facility operating expense during the first quarter of 2026.
- The decrease was partially offset by the 1.4% increase in same community facility operating expense, which was primarily due to an increase in estimated insurance expense, a seasonal increase in utilities expense associated with winter storm activity, and higher credit losses.
- 1Q 2026 vs 1Q 2025:
- Cash facility operating lease payments: The decrease compared to the first quarter of 2025 was primarily due to the disposition of communities through lease terminations.
- Net income (loss).
- 1Q 2026 vs 1Q 2025: The decrease in net loss was primarily attributable to a $32.8 million loss on extinguishment of a financing obligation during the prior year period and decreases in depreciation and amortization expense and facility operating lease expense due to the disposition of communities since the beginning of the prior year period.
- 1Q 2026 vs 4Q 2025: The decrease in net loss was primarily due to the increase in same community resident fees, partially offset by the increase in same community facility operating expense.
- Adjusted EBITDA: The increase compared to the first quarter of 2025 and the fourth quarter of 2025 was primarily due to the increase in same community resident fees, partially offset by the increase in same community facility operating expense.
TRANSACTION AND FINANCING UPDATE
On March 31, 2026, the Company obtained an aggregate $184.9 million of debt on 7 communities and repaid $190.6 million of outstanding mortgage debt secured by 11 communities previously scheduled to mature in March 2027. The principal amounts of the new loans are secured by non-recourse first mortgages, bear interest at a fixed rate of 5.38%, are interest only for the first two years, and mature in April 2033.
During the first quarter of 2026, the Company recognized $2.5 million of management termination fee revenue attributable to communities which were transitioned to a new manager effective as of April 1, 2026.
Owned Community Dispositions
During the first quarter of 2026, the Company completed the sale of seven owned communities (330 units) and received cash proceeds of $22.1 million, net of transaction costs. Subsequent to March 31, 2026, the Company completed the sale of three owned communities (545 units) and received cash proceeds of $88 million, net of transaction costs.
As previously announced, the Company plans to sell 19 additional owned communities (1,438 units) during 2026. The closings of the expected sales of assets are subject (where applicable) to the Company's successful marketing of such assets on terms acceptable to the Company. Further, the closings of the expected sales of assets are, or will be, subject to the satisfaction of various conditions, including (where applicable) the receipt of regulatory approvals. There can be no assurance that the transactions will close or, if they do, when the actual closings will occur.
LIQUIDITY
Total liquidity of $368.7 million as of March 31, 2026 included $265.2 million of unrestricted cash and cash equivalents (excluding restricted cash of $68.4 million), $4.9 million of marketable securities, and $98.6 million of availability on the Company's secured credit facility. Total liquidity as of March 31, 2026 decreased $9.0 million from December 31, 2025.
2026 OUTLOOK
The Company is reiterating the following guidance:
Full Year 2026 Guidance |
|
RevPAR year-over-year growth |
8.0% to 9.0% |
Adjusted EBITDA |
$502 million to $516 million |
Full year 2026 guidance reflects management's current expectations for transaction activity. Reconciliation of the non-GAAP financial measure included in the foregoing guidance to the most comparable GAAP financial measure is not available without unreasonable effort due to the inherent difficulty in forecasting the timing or amounts of items required to reconcile Adjusted EBITDA from the Company's net income (loss). Variability in the timing or amounts of items required to reconcile the measure may have a significant impact on the Company's future GAAP results.
SUPPLEMENTAL INFORMATION
The Company will post on its website at brookdaleinvestors.com supplemental information relating to the Company's first quarter results, an updated investor presentation, and a copy of this earnings release. The supplemental information and a copy of this earnings release will also be furnished in a Form 8-K to be filed with the SEC.
EARNINGS CONFERENCE CALL
Brookdale's management will conduct a conference call to discuss the financial results for the first quarter on May 7, 2026 at 9:00 AM ET.
A live webcast of the conference call will be available to the public on a listen-only basis at brookdaleinvestors.com. Please allow extra time before the call to download the necessary software required to listen to the internet broadcast. A replay of the webcast will be available through the website following the call.
ABOUT BROOKDALE SENIOR LIVING
Brookdale Senior Living Inc. is the nation's premier operator of senior living communities. With 568 communities across 41 states and the ability to serve approximately 51,000 residents as of March 31, 2026, Brookdale is committed to its mission of enriching the lives of seniors through compassionate care, clinical expertise, and exceptional service. The Company, through its affiliates, operates independent living, assisted living, memory care, and continuing care retirement communities, offering tailored solutions that help empower seniors to live with dignity, connection, and purpose. Leveraging deep expertise in healthcare, hospitality, and real estate, Brookdale creates opportunities for wellness, personal growth, and meaningful relationships in settings that feel like home. Guided by its four cornerstones of passion, courage, partnership, and trust, Brookdale is committed to delivering exceptional value and redefining senior living for a brighter, healthier future. Brookdale's stock trades on the New York Stock Exchange under the ticker symbol BKD. For more information, visit brookdale.com or connect with Brookdale on Facebook or YouTube.
DEFINITIONS OF REVPAR AND REVPOR
RevPAR, or average monthly senior housing resident fee revenue per available unit, is defined by the Company as resident fee revenue for the corresponding portfolio for the period (excluding revenue for private duty services provided to seniors living outside of the Company's communities), divided by the weighted average number of available units in the corresponding portfolio for the period, divided by the number of months in the period.
RevPOR, or average monthly senior housing resident fee revenue per occupied unit, is defined by the Company as resident fee revenue for the corresponding portfolio for the period (excluding revenue for private duty services provided to seniors living outside of the Company's communities), divided by the weighted average number of occupied units in the corresponding portfolio for the period, divided by the number of months in the period.
SAFE HARBOR
Certain statements in this press release and the associated earnings call may constitute forward-looking statements within the meaning of the Private Securities Litigation Reform Act of 1995. These forward-looking statements are subject to various risks and uncertainties and include all statements that are not historical statements of fact and those regarding the Company's intent, belief, or expectations. Forward-looking statements are generally identifiable by use of forward-looking terminology such as "may," "will," "should," "could," "would," "potential," "intend," "expect," "endeavor," "seek," "anticipate," "estimate," "believe," "project," "predict," "continue," "plan," "target," or other similar words or expressions, and include statements regarding the Company's expected financial and operational results. These forward-looking statements are based on certain assumptions and expectations, and the Company's ability to predict results or the actual effect of future plans or strategies is inherently uncertain. Although the Company believes that expectations reflected in any forward-looking statements are based on reasonable assumptions, it can give no assurance that its assumptions or expectations will be attained and actual results and performance could differ materially from those projected. Factors which could have a material adverse effect on the Company's operations and future prospects or which could cause events or circumstances to differ from the forward-looking statements include, but are not limited to, events which adversely affect the ability of seniors to afford resident fees, including downturns in the economy, housing market, consumer confidence, or the equity markets and unemployment among resident family members; the effects of senior housing construction and development, lower industry occupancy, and increased competition; conditions of housing markets, regulatory changes, acts of nature, and the effects of climate change in geographic areas where the Company is concentrated; terminations of the Company's resident agreements and vacancies in the living spaces it leases; changes in reimbursement rates, methods, or timing under governmental reimbursement programs including the Medicare and Medicaid programs; failure to maintain the security and functionality of the Company's information systems, to prevent a cybersecurity attack or breach, or to comply with applicable privacy and consumer protection laws, including HIPAA; the Company's ability to complete its capital expenditures in accordance with its plans; the Company's ability to identify and pursue development, investment, and acquisition opportunities and its ability to successfully integrate acquisitions; competition for the acquisition of assets; the Company's ability to complete pending or expected disposition, acquisition, or other transactions on agreed upon terms or at all, including in respect of the satisfaction of closing conditions, the risk that regulatory approvals are not obtained or are subject to unanticipated conditions, and uncertainties as to the timing of closing, and the Company's ability to identify and pursue any such opportunities in the future; risks related to the implementation of the Company's strategy, including initiatives undertaken to execute on the Company's strategic priorities and their effect on its results; limits on the Company's ability to use net operating loss carryovers to reduce future tax payments; delays in obtaining regulatory approvals; the risks associated with tariffs and the uncertain duration of trade conflicts; disruptions in the financial markets or decreases in the appraised values or performance of the Company's communities that affect the Company's ability to obtain financing or extend or refinance debt as it matures and the Company's financing costs; the Company's ability to generate sufficient cash flow to cover required interest, principal, and long-term lease payments and to fund its planned capital projects; the effect of any non-compliance with any of the Company's debt or lease agreements (including the financial or other covenants contained therein), including the risk of lenders or lessors declaring a cross default in the event of the Company's non-compliance with any such agreements and the risk of loss of the Company's property securing leases and indebtedness due to any resulting lease terminations and foreclosure actions; the inability to renew, restructure, or extend leases, or exercise purchase options at or prior to the end of any existing lease term; the effect of the Company's indebtedness and long-term leases on the Company's liquidity and its ability to operate its business; increases in market interest rates that increase the costs of the Company's debt obligations; the Company's ability to obtain additional capital on terms acceptable to it; departures of key officers and potential disruption caused by changes in management; increased competition for, or a shortage of, associates, wage pressures resulting from increased competition, low unemployment levels, minimum wage increases and changes in overtime laws, and union activity; an adverse determination or resolution of complaints filed against the Company, including putative class action complaints; negative publicity with respect to any lawsuits, claims, or other legal or regulatory proceedings; costs to respond to, and adverse determinations resulting from, government inquiries, reviews, audits, and investigations; the cost and difficulty of complying with increasing and evolving regulation, including new disclosure obligations; changes in, or its failure to comply with, employment-related laws and regulations; environmental contamination at any of the Company's communities; failure to comply with existing environmental laws; the risks associated with current global economic conditions and general economic factors on the Company and the Company's business partners such as inflation, commodity costs, fuel and other energy costs, competition in the labor market, costs of salaries, wages, benefits, and insurance, interest rates, tax rates, tariffs, and geopolitical tensions or conflicts, the impact of seasonal contagious illness or other contagious disease in the markets in which the Company operates; actions of activist stockholders; as well as other risks detailed from time to time in the Company's filings with the Securities and Exchange Commission ("SEC"), including those set forth in the Company's Annual Report on Form 10-K and Quarterly Reports on Form 10-Q. When considering forward-looking statements, you should keep in mind the risk factors and other cautionary statements in such SEC filings. Readers are cautioned not to place undue reliance on any of these forward-looking statements, which reflect management's views as of the date of this press release and/or associated earnings call. The Company cannot guarantee future results, levels of activity, performance or achievements, and, except as required by law, it expressly disclaims any obligation to release publicly any updates or revisions to any forward-looking statements contained in this press release and/or associated earnings call to reflect any change in the Company's expectations with regard thereto or change in events, conditions, or circumstances on which any statement is based.
Condensed Consolidated Statements of Operations |
|||
Three Months Ended March 31, |
|||
(in thousands, except per share data) |
2026 |
2025 |
|
Resident fees |
$ 722,456 |
$ 777,454 |
|
Management fees |
5,373 |
2,620 |
|
Reimbursed costs incurred on behalf of managed communities |
37,027 |
33,790 |
|
Total revenue |
764,856 |
813,864 |
|
Facility operating expense (excluding facility depreciation and amortization of $68,916 and |
511,470 |
556,987 |
|
General and administrative expense (including non-cash stock-based compensation expense of |
45,057 |
47,874 |
|
Facility operating lease expense |
43,981 |
52,874 |
|
Depreciation and amortization |
73,463 |
90,976 |
|
Asset impairment |
6,115 |
1,787 |
|
Loss (gain) on sale of communities, net |
(4,034) |
— |
|
Costs incurred on behalf of managed communities |
37,027 |
33,790 |
|
Income (loss) from operations |
51,777 |
29,576 |
|
Interest income |
3,113 |
3,648 |
|
Interest expense: |
|||
Debt |
(55,670) |
(54,659) |
|
Financing lease obligations |
(1,700) |
(5,600) |
|
Amortization of deferred financing costs |
(3,483) |
(3,630) |
|
Change in fair value of derivatives |
1,301 |
(1,142) |
|
Gain (loss) on debt modification and extinguishment, net |
(2,786) |
(35,220) |
|
Other non-operating income (loss) |
115 |
1,358 |
|
Income (loss) before income taxes |
(7,333) |
(65,669) |
|
Benefit (provision) for income taxes |
429 |
676 |
|
Net income (loss) |
(6,904) |
(64,993) |
|
Net (income) loss attributable to noncontrolling interest |
12 |
14 |
|
Net income (loss) attributable to Brookdale Senior Living Inc. common stockholders |
$ (6,892) |
$ (64,979) |
|
Basic and diluted net income (loss) per share attributable to Brookdale Senior Living Inc. |
$ (0.03) |
$ (0.28) |
|
Weighted average shares used in computing basic and diluted net income (loss) per share |
238,112 |
230,678 |
|
Condensed Consolidated Balance Sheets |
|||
(in thousands) |
March 31, 2026 |
December 31, 2025 |
|
Cash and cash equivalents |
$ 265,204 |
$ 279,122 |
|
Marketable securities |
4,939 |
— |
|
Restricted cash |
31,075 |
33,227 |
|
Accounts receivable, net |
64,359 |
67,680 |
|
Assets held for sale |
75,221 |
77,206 |
|
Prepaid expenses and other current assets, net |
111,750 |
96,705 |
|
Total current assets |
552,548 |
553,940 |
|
Property, plant and equipment and leasehold intangibles, net |
4,230,837 |
4,272,697 |
|
Operating lease right-of-use assets |
1,012,792 |
1,032,140 |
|
Other assets, net |
101,635 |
93,466 |
|
Total assets |
$ 5,897,812 |
$ 5,952,243 |
|
Current portion of long-term debt |
$ 82,616 |
$ 77,492 |
|
Current portion of lease obligations |
77,966 |
75,733 |
|
Other current liabilities |
373,987 |
414,700 |
|
Total current liabilities |
534,569 |
567,925 |
|
Long-term debt, less current portion |
4,224,369 |
4,215,005 |
|
Lease obligations, less current portion |
1,129,824 |
1,147,892 |
|
Other liabilities |
63,621 |
64,798 |
|
Total liabilities |
5,952,383 |
5,995,620 |
|
Total Brookdale Senior Living Inc. stockholders' equity (deficit) |
(55,935) |
(44,753) |
|
Noncontrolling interest |
1,364 |
1,376 |
|
Total equity (deficit) |
(54,571) |
(43,377) |
|
Total liabilities and equity (deficit) |
$ 5,897,812 |
$ 5,952,243 |
|
Condensed Consolidated Statements of Cash Flows |
|||
Three Months Ended March 31, |
|||
(in thousands) |
2026 |
2025 |
|
Cash Flows from Operating Activities |
|||
Net income (loss) |
$ (6,904) |
$ (64,993) |
|
Adjustments to reconcile net income (loss) to net cash provided by operating activities: |
|||
Loss (gain) on debt modification and extinguishment, net |
2,786 |
35,220 |
|
Depreciation and amortization, net |
76,946 |
94,606 |
|
Asset impairment |
6,115 |
1,787 |
|
Deferred income tax (benefit) provision |
(985) |
(1,157) |
|
Operating lease expense adjustment |
(720) |
(3,853) |
|
Change in fair value of derivatives |
(1,301) |
1,142 |
|
Loss (gain) on sale of assets, net |
(4,034) |
— |
|
Non-cash stock-based compensation expense |
3,680 |
3,979 |
|
Property and casualty insurance income |
(140) |
(1,415) |
|
Changes in operating assets and liabilities: |
|||
Accounts receivable, net |
3,321 |
(6,002) |
|
Prepaid expenses and other assets, net |
5,267 |
(5,104) |
|
Prepaid insurance premiums financed with notes payable |
(20,199) |
(22,392) |
|
Trade accounts payable and accrued expenses |
(47,287) |
(15,148) |
|
Refundable fees and deferred revenue |
(433) |
4,719 |
|
Operating lease assets and liabilities for lessor capital expenditure reimbursements |
4,775 |
2,013 |
|
Net cash provided by operating activities |
20,887 |
23,402 |
|
Cash Flows from Investing Activities |
|||
Purchase of marketable securities |
(4,939) |
— |
|
Sale and maturities of marketable securities |
— |
20,000 |
|
Capital expenditures, net of related payables |
(46,476) |
(41,817) |
|
Acquisition of assets |
— |
(311,028) |
|
Proceeds from sale of assets, net |
22,059 |
— |
|
Property and casualty insurance proceeds |
140 |
1,415 |
|
Change in lease acquisition deposits, net |
— |
5,000 |
|
Other |
(518) |
(325) |
|
Net cash provided by (used in) investing activities |
(29,734) |
(326,755) |
|
Cash Flows from Financing Activities |
|||
Proceeds from debt |
231,676 |
320,673 |
|
Repayment of debt and financing lease obligations |
(217,924) |
(70,338) |
|
Payment of financing costs, net of related payables |
(6,648) |
(5,909) |
|
Payments of employee taxes for withheld shares |
(7,612) |
(4,757) |
|
Net cash provided by (used in) financing activities |
(508) |
239,669 |
|
Net increase (decrease) in cash, cash equivalents, and restricted cash |
(9,355) |
(63,684) |
|
Cash, cash equivalents, and restricted cash at beginning of period |
343,008 |
379,840 |
|
Cash, cash equivalents, and restricted cash at end of period |
$ 333,653 |
$ 316,156 |
|
Non-GAAP Financial Measure
This earnings release contains the financial measure Adjusted EBITDA, which is not calculated in accordance with U.S. generally accepted accounting principles ("GAAP"). Presentations of this non-GAAP financial measure is intended to aid investors in better understanding the factors and trends affecting the Company's performance. However, investors should not consider this non-GAAP financial measure as a substitute for financial measures determined in accordance with GAAP, including net income (loss) or income (loss) from operations. The Company cautions investors that amounts presented in accordance with the Company's definitions of this non-GAAP financial measure may not be comparable to similar measures disclosed by other companies because not all companies calculate non-GAAP measures in the same manner. The Company urges investors to review the following reconciliation of this non-GAAP financial measure from the most comparable financial measure determined in accordance with GAAP.
Adjusted EBITDA
Adjusted EBITDA is a non-GAAP performance measure that the Company defines as net income (loss) excluding: benefit/provision for income taxes, non-operating income/expense items, and depreciation and amortization; and further adjusted to exclude income/expense associated with non-cash, non-operational, transactional, legal, cost reduction, or organizational restructuring items that management does not consider as part of the Company's underlying core operating performance and that management believes impact the comparability of performance between periods. For the periods presented herein, such other items include non-cash impairment charges, operating lease expense adjustment, non-cash stock-based compensation expense, gain/loss on sale of communities, gain/loss on facility operating lease termination, and transaction, legal, and organizational restructuring costs. Transaction costs include those directly related to acquisition, disposition, financing, and leasing activity and stockholder relations advisory matters, and are primarily comprised of legal, finance, consulting, professional fees, and other third-party costs. Legal costs include charges associated with putative class action litigation. Organizational restructuring costs include those related to the Company's efforts to reduce general and administrative expense and its senior leadership changes, including severance.
The Company believes that presentation of Adjusted EBITDA as a performance measure is useful to investors because (i) it is one of the metrics used by the Company's management for budgeting and other planning purposes, to review the Company's historic and prospective core operating performance, and to make day-to-day operating decisions; (ii) it provides an assessment of operational factors that management can impact in the short-term, namely revenues and the controllable cost structure of the organization, by eliminating items related to the Company's financing and capital structure and other items that management does not consider as part of the Company's underlying core operating performance and that management believes impact the comparability of performance between periods; (iii) the Company believes that this measure is used by research analysts and investors to evaluate the Company's operating results and to value companies in its industry; and (iv) the Company uses the measure for components of executive compensation.
Adjusted EBITDA has material limitations as a performance measure, including: (i) excluded interest and income tax are necessary to operate the Company's business under its current financing and capital structure; (ii) excluded depreciation, amortization, and impairment charges may represent the wear and tear and/or reduction in value of the Company's communities, goodwill, and other assets and may be indicative of future needs for capital expenditures; and (iii) the Company may incur income/expense similar to those for which adjustments are made, such as gain/loss on sale of assets, facility operating lease termination, or debt modification and extinguishment, non-cash stock-based compensation expense, and transaction, legal, and other costs, and such income/expense may significantly affect the Company's operating results.
The table below reconciles Adjusted EBITDA from net income (loss).
Three Months Ended |
|||||
(in thousands) |
March 31, 2026 |
December 31, 2025 |
March 31, 2025 |
||
Net income (loss) |
$ (6,904) |
$ (39,976) |
$ (64,993) |
||
Provision (benefit) for income taxes |
(429) |
(1,171) |
(676) |
||
Loss (gain) on debt modification and extinguishment, net |
2,786 |
4,426 |
35,220 |
||
Other non-operating (income) loss |
(115) |
(240) |
(1,358) |
||
Interest expense |
59,552 |
62,606 |
65,031 |
||
Interest income |
(3,113) |
(2,795) |
(3,648) |
||
Income (loss) from operations |
51,777 |
22,850 |
29,576 |
||
Depreciation and amortization |
73,463 |
76,906 |
90,976 |
||
Asset impairment |
6,115 |
6,289 |
1,787 |
||
Loss (gain) on sale of communities, net |
(4,034) |
(2,186) |
— |
||
Loss (gain) on facility operating lease termination, net |
— |
(341) |
— |
||
Operating lease expense adjustment |
(720) |
(965) |
(3,853) |
||
Non-cash stock-based compensation expense |
3,680 |
2,236 |
3,979 |
||
Transaction, legal, and organizational restructuring costs |
771 |
770 |
1,674 |
||
Adjusted EBITDA |
$ 131,052 |
$ 105,559 |
$ 124,139 |
||
SOURCE Brookdale Senior Living Inc.


Share this article