Accessibility Statement Skip Navigation
  • Resources
  • Investor Relations
  • Journalists
  • Agencies
  • Client Login
  • Send a Release
Return to PR Newswire homepage
  • News
  • Products
  • Contact
Search
When typing in this field, a list of search results will appear and be automatically updated as you type.

Searching for your content...

No results found. Please change your search terms and try again.
  • News Releases view all

    • News in Focus
        • Browse News Releases

        • All News Releases
        • All Public Company
        • English-only
        • News Releases Overview

        • Multimedia Gallery

        • All Multimedia
        • All Photos
        • All Videos
        • Multimedia Gallery Overview

        • Trending Topics

        • All Trending Topics
    • Business & Money
        • Auto & Transportation

        • Aerospace, Defense
        • Air Freight
        • Airlines & Aviation
        • Automotive
        • Maritime & Shipbuilding
        • Railroads and Intermodal Transportation
        • Supply Chain/Logistics
        • Transportation, Trucking & Railroad
        • Travel
        • Trucking and Road Transportation
        • Auto & Transportation Overview

        • View All Auto & Transportation

        • Business Technology

        • Blockchain
        • Broadcast Tech
        • Computer & Electronics
        • Computer Hardware
        • Computer Software
        • Data Analytics
        • Electronic Commerce
        • Electronic Components
        • Electronic Design Automation
        • Financial Technology
        • High Tech Security
        • Internet Technology
        • Nanotechnology
        • Networks
        • Peripherals
        • Semiconductors
        • Business Technology Overview

        • View All Business Technology

        • Entertain­ment & Media

        • Advertising
        • Art
        • Books
        • Entertainment
        • Film and Motion Picture
        • Magazines
        • Music
        • Publishing & Information Services
        • Radio & Podcast
        • Television
        • Entertainment & Media Overview

        • View All Entertain­ment & Media

        • Financial Services & Investing

        • Accounting News & Issues
        • Acquisitions, Mergers and Takeovers
        • Banking & Financial Services
        • Bankruptcy
        • Bond & Stock Ratings
        • Conference Call Announcements
        • Contracts
        • Cryptocurrency
        • Dividends
        • Earnings
        • Earnings Forecasts & Projections
        • Financing Agreements
        • Insurance
        • Investments Opinions
        • Joint Ventures
        • Mutual Funds
        • Private Placement
        • Real Estate
        • Restructuring & Recapitalization
        • Sales Reports
        • Shareholder Activism
        • Shareholder Meetings
        • Stock Offering
        • Stock Split
        • Venture Capital
        • Financial Services & Investing Overview

        • View All Financial Services & Investing

        • General Business

        • Awards
        • Commercial Real Estate
        • Corporate Expansion
        • Earnings
        • Environmental, Social and Governance (ESG)
        • Human Resource & Workforce Management
        • Licensing
        • New Products & Services
        • Obituaries
        • Outsourcing Businesses
        • Overseas Real Estate (non-US)
        • Personnel Announcements
        • Real Estate Transactions
        • Residential Real Estate
        • Small Business Services
        • Socially Responsible Investing
        • Surveys, Polls and Research
        • Trade Show News
        • General Business Overview

        • View All General Business

    • Science & Tech
        • Consumer Technology

        • Artificial Intelligence
        • Blockchain
        • Cloud Computing/Internet of Things
        • Computer Electronics
        • Computer Hardware
        • Computer Software
        • Consumer Electronics
        • Cryptocurrency
        • Data Analytics
        • Electronic Commerce
        • Electronic Gaming
        • Financial Technology
        • Mobile Entertainment
        • Multimedia & Internet
        • Peripherals
        • Social Media
        • STEM (Science, Tech, Engineering, Math)
        • Supply Chain/Logistics
        • Wireless Communications
        • Consumer Technology Overview

        • View All Consumer Technology

        • Energy & Natural Resources

        • Alternative Energies
        • Chemical
        • Electrical Utilities
        • Gas
        • General Manufacturing
        • Mining
        • Mining & Metals
        • Oil & Energy
        • Oil and Gas Discoveries
        • Utilities
        • Water Utilities
        • Energy & Natural Resources Overview

        • View All Energy & Natural Resources

        • Environ­ment

        • Conservation & Recycling
        • Environmental Issues
        • Environmental Policy
        • Environmental Products & Services
        • Green Technology
        • Natural Disasters
        • Environment Overview

        • View All Environ­ment

        • Heavy Industry & Manufacturing

        • Aerospace & Defense
        • Agriculture
        • Chemical
        • Construction & Building
        • General Manufacturing
        • HVAC (Heating, Ventilation and Air-Conditioning)
        • Machinery
        • Machine Tools, Metalworking and Metallurgy
        • Mining
        • Mining & Metals
        • Paper, Forest Products & Containers
        • Precious Metals
        • Textiles
        • Tobacco
        • Heavy Industry & Manufacturing Overview

        • View All Heavy Industry & Manufacturing

        • Telecomm­unications

        • Carriers and Services
        • Mobile Entertainment
        • Networks
        • Peripherals
        • Telecommunications Equipment
        • Telecommunications Industry
        • VoIP (Voice over Internet Protocol)
        • Wireless Communications
        • Telecommunications Overview

        • View All Telecomm­unications

    • Lifestyle & Health
        • Consumer Products & Retail

        • Animals & Pets
        • Beers, Wines and Spirits
        • Beverages
        • Bridal Services
        • Cannabis
        • Cosmetics and Personal Care
        • Fashion
        • Food & Beverages
        • Furniture and Furnishings
        • Home Improvement
        • Household, Consumer & Cosmetics
        • Household Products
        • Jewelry
        • Non-Alcoholic Beverages
        • Office Products
        • Organic Food
        • Product Recalls
        • Restaurants
        • Retail
        • Supermarkets
        • Toys
        • Consumer Products & Retail Overview

        • View All Consumer Products & Retail

        • Entertain­ment & Media

        • Advertising
        • Art
        • Books
        • Entertainment
        • Film and Motion Picture
        • Magazines
        • Music
        • Publishing & Information Services
        • Radio & Podcast
        • Television
        • Entertainment & Media Overview

        • View All Entertain­ment & Media

        • Health

        • Biometrics
        • Biotechnology
        • Clinical Trials & Medical Discoveries
        • Dentistry
        • FDA Approval
        • Fitness/Wellness
        • Health Care & Hospitals
        • Health Insurance
        • Infection Control
        • International Medical Approval
        • Medical Equipment
        • Medical Pharmaceuticals
        • Mental Health
        • Pharmaceuticals
        • Supplementary Medicine
        • Health Overview

        • View All Health

        • Sports

        • General Sports
        • Outdoors, Camping & Hiking
        • Sporting Events
        • Sports Equipment & Accessories
        • Sports Overview

        • View All Sports

        • Travel

        • Amusement Parks and Tourist Attractions
        • Gambling & Casinos
        • Hotels and Resorts
        • Leisure & Tourism
        • Outdoors, Camping & Hiking
        • Passenger Aviation
        • Travel Industry
        • Travel Overview

        • View All Travel

    • Policy & Public Interest
        • Policy & Public Interest

        • Advocacy Group Opinion
        • Animal Welfare
        • Congressional & Presidential Campaigns
        • Corporate Social Responsibility
        • Domestic Policy
        • Economic News, Trends, Analysis
        • Education
        • Environmental
        • European Government
        • FDA Approval
        • Federal and State Legislation
        • Federal Executive Branch & Agency
        • Foreign Policy & International Affairs
        • Homeland Security
        • Labor & Union
        • Legal Issues
        • Natural Disasters
        • Not For Profit
        • Patent Law
        • Public Safety
        • Trade Policy
        • U.S. State Policy
        • Policy & Public Interest Overview

        • View All Policy & Public Interest

    • People & Culture
        • People & Culture

        • Aboriginal, First Nations & Native American
        • African American
        • Asian American
        • Children
        • Diversity, Equity & Inclusion
        • Hispanic
        • Lesbian, Gay & Bisexual
        • Men's Interest
        • People with Disabilities
        • Religion
        • Senior Citizens
        • Veterans
        • Women
        • People & Culture Overview

        • View All People & Culture

    • Explore Our Platform
    • Plan Campaigns
    • Create with AI
    • Distribute Press Releases
    • Report Results
    • Amplify Content
    • All Products
    • General Inquiries
    • Editorial Bureaus
    • Partnerships
    • Media Inquiries
    • Worldwide Offices
    • Hamburger menu
    • PR Newswire: news distribution, targeting and monitoring
    • Send a Release
      • ALL CONTACT INFO
      • Contact Us

        888-776-0942
        from 8 AM - 10 PM ET

    • Searching for your content...

      No results found. Please change your search terms and try again.

      News Releases

      view all
      Close menu
    • News
    • Products
    • Contact
      • Send a Release
      • Client Login
      • Resources
      • Blog
      • Journalists
      • RSS
      • 3 News in Focus
      • 5 Business & Money
      • 5 Science & Tech
      • 5 Lifestyle & Health
      • 1 Policy & Public Interest
      • 1 People & Culture
      • Send a Release
      • Client Login
      • Resources
      • Blog
      • Journalists
      • RSS
      • Explore Our Platform
      • Plan Campaigns
      • Create with AI
      • Distribute Press Releases
      • Report Results
      • Amplify Content
      • All Products
      • Send a Release
      • Client Login
      • Resources
      • Blog
      • Journalists
      • RSS
      • General Inquiries
      • Editorial Bureaus
      • Partnerships
      • Media Inquiries
      • Worldwide Offices
      • Send a Release
      • Client Login
      • Resources
      • Blog
      • Journalists
      • RSS
      Close submenu (News in Focus) News in Focus
      • Browse News Releases
      • Multimedia Gallery
      • Trending Topics
      Close submenu (Business & Money) Business & Money
      • Auto & Transportation
      • Business Technology
      • Entertain­ment & Media
      • Financial Services & Investing
      • General Business
      Close submenu (Science & Tech) Science & Tech
      • Consumer Technology
      • Energy & Natural Resources
      • Environ­ment
      • Heavy Industry & Manufacturing
      • Telecomm­unications
      Close submenu (Lifestyle & Health) Lifestyle & Health
      • Consumer Products & Retail
      • Entertain­ment & Media
      • Health
      • Sports
      • Travel
      Close submenu (Policy & Public Interest) Policy & Public Interest
      • Policy & Public Interest
      Close submenu (People & Culture) People & Culture
      • People & Culture

      California home sales hit highest level since February, C.A.R. reports

      CALIFORNIA ASSOCIATION OF REALTORS (PRNewsFoto/C.A.R.)

      News provided by

      CALIFORNIA ASSOCIATION OF REALTORS® (C.A.R.)

      Nov 18, 2025, 11:00 ET

      Share this article

      Share this article


      • Existing, single-family home sales totaled 282,590 in October on a seasonally adjusted annualized rate, up 1.9 percent from 277,410 in September and up 4.1 percent from 271,370 in October 2024.
      • October's statewide median home price was $886,960, up 0.4 percent from $883,640 in September and down 0.2 percent from $888,740 in October 2024.
      • Year-to-date statewide home sales were up 0.8 percent.

      SACRAMENTO, Calif., Nov. 18, 2025 /PRNewswire/ -- California home sales rose in October from both the prior month and a year ago to reach the highest level since February, the CALIFORNIA ASSOCIATION OF REALTORS® (C.A.R.) said today.

      Infographic: https://www.car.org/Global/Infographics/2025-10-Sales-and-Price

      Continue Reading
      California home sales rose in October from both the prior month and a year ago to reach the highest level since February.
      California home sales rose in October from both the prior month and a year ago to reach the highest level since February.

      Closed escrow sales of existing, single-family detached homes in California totaled a seasonally adjusted annualized rate of 282,590 in October, according to information collected by C.A.R. from more than 90 local REALTOR® associations and MLSs statewide. The statewide annualized sales figure represents what would be the total number of homes sold during 2025 if sales maintained the October pace throughout the year. It is adjusted to account for seasonal factors that typically influence home sales.

      October home sales edged up 1.9 percent from 277,410 in September to 282,590 in October. Home sales improved 4.1 percent from a revised 271,370 recorded a year earlier. Total home sales through the first ten months of 2025 also moved further above last year's level in October. Nevertheless, October marked the 37th consecutive month in which statewide sales remained below the 300,000-unit benchmark.

      Statewide pending home sales in October edged up 0.8 percent year over year—the third consecutive annual increase but slipped 1.2 percent from September due primarily to seasonal factors. At the county level, pending sales improved from last year in 26 counties but dipped year-over-year in 24 counties.

      "Housing demand in California has been steadily improving, with home sales rising for the third month in a row. Even though mortgage rates have inched up since late October, the market remains active, and buyers still have solid opportunities," said 2026 C.A.R. President Tamara Suminski, a Southern California broker and REALTOR®. "Home prices are growing at a manageable pace, and we're seeing a healthier balance between buyers and sellers. As we head into 2026, these trends point to a promising moment for anyone considering a move in the California real estate market."

      The statewide median home price ticked up 0.4 percent from $883,640 in September to $886,960 in October, bucking the long-run declining trend at an average of -1.4 percent observed between September and October. The October median price dipped year over year for the first time in three months, down 0.2 percent to $888,740 but remained near the record-high reached six months ago. Despite stabilizing home prices in recent months, mortgage rate volatility and heightened economic uncertainty could continue to keep prospective buyers on the sidelines and may delay a broader recovery in the near term.

      "Mortgage rates, which briefly approached their 12-month low in October, have resumed an upward trajectory as the Federal Reserve took a more cautious approach during the government shutdown," said C.A.R. Senior Vice President and Chief Economist Jordan Levine. "With the market easing into its seasonal slowdown, housing demand will stay soft, and California is likely to close out 2025 with only a modest uptick in home sales over last year."

      Other key points from C.A.R.'s October 2025 resale housing report include:

      • At the regional level, all but one of the state's major regions recorded year-over-year sales gains on a non-seasonally adjusted basis. The Far North led all regions with an 18 percent increase from a year ago and was the only region with a double-digit gain. Southern California (5.6 percent), the Central Valley (4.0 percent), and the San Francisco Bay Area (2.5 percent) also posted moderate home sales improvements, while the Central Coast (-1.5 percent) was the sole region to register a year-over-year decline.
      • At the county level, 34 of the 53 counties tracked by C.A.R. recorded year-over-year sales improvements in October, with nearly half (16) of them growing by double-digits. Trinity (85.7 percent) led the way with the highest sales growth from October 2024, followed by Lassen (58.3 percent) and Kings (52.9 percent). Eighteen counties experienced annual sales declines in October, with sales in five counties dropping more than 10 percent including San Benito (-18.4 percent), San Luis Obispo (-15.2 percent), and Tehama (-12 percent).
      • Two of California's five major regions posted year-over-year median home price gains in October. The Central Coast increased a solid 7.9 percent from October 2024, while Southern California recorded a modest 1.1 percent price uptick. By contrast, the Far North (-3.8 percent) experienced the largest annual price decline, followed by the San Francisco Bay Area (-1.1 percent) and the Central Valley (-0.2 precent).
      • Twenty-three California counties recorded year-over-year median home price gains in October. Santa Barbara (26.7 percent) registered the sharpest increase of all counties, followed by Trinity (22 percent) and Mono (18.6 percent). More than half (28) of all counties tracked by C.A.R. posted price decreases from a year ago, with Tuolumne (15.3 percent) dropping the most, while Lassen (-11 percent) and Del Norte (-9.9 percent) recorded the second and the third steepest annual price declines in October.
      • Following the typical seasonal downward pattern, housing inventory fell in October from the previous month as the market transitioned into the off season. The Unsold Inventory Index (UII) dipped in October compared to September, as home sales ticked up and active listings pulled back. The index was 3.2 months in October, down from 3.6 months in September and essentially unchanged from 3.1 months in October 2024. Year over year, the UII grew modestly as total active listings continued to grow from a year ago for the 21st consecutive month. However, the 10.3 percent increase was the smallest since February 2024. October marked the sixth straight month of decelerating inventory growth, an indication that the momentum on the supply side is gradually easing as the market moves further into the holiday season.
      • The median number of days it took to sell a California single-family home was 32 days in October, up from 25 days in October 2024.
      • C.A.R.'s statewide sales-price-to-list-price ratio* was 98.3 percent in October 2025 and 99.9 percent in October 2024.
      • The statewide median price per square foot** for an existing single-family home was $431, down from $442 in October a year ago.
      • The 30-year, fixed-mortgage interest rate averaged 6.25 percent in October, down from 6.43 percent in October 2024, according to C.A.R.'s calculations based on Freddie Mac's weekly mortgage survey data.

      Note:  The County MLS median price and sales data in the tables are generated from a survey of more than 90 associations of REALTORS® throughout the state and represent statistics of existing single-family detached homes only. County sales data is not adjusted to account for seasonal factors that can influence home sales. Movements in sales prices should not be interpreted as changes in the cost of a standard home. The median price is where half sold for more and half sold for less; medians are more typical than average prices, which are skewed by a relatively small share of transactions at either the lower end or the upper end. Median prices can be influenced by changes in cost, as well as changes in the characteristics and the size of homes sold. The change in median prices should not be construed as actual price changes in specific homes.

      *Sales-to-list-price ratio is an indicator that reflects the negotiation power of home buyers and home sellers under current market conditions. The ratio is calculated by dividing the final sales price of a property by its original list price and is expressed as a percentage. A sales-to-list ratio with 100 percent or above suggests that the property sold for more than the list price, and a ratio below 100 percent indicates that the price sold below the asking price.

      **Price per square foot is a measure commonly used by real estate agents and brokers to determine how much a square foot of space a buyer will pay for a property. It is calculated as the sale price of the home divided by the number of finished square feet. C.A.R. currently tracks price-per-square foot statistics for 53 counties.

      Leading the way…® in California real estate for 120 years, the CALIFORNIA ASSOCIATION OF REALTORS® (www.car.org) is one of the largest state trade organizations in the United States with 190,000 members dedicated to the advancement of professionalism in real estate. C.A.R. is headquartered in Sacramento.

      October 2025 County Sales and Price Activity 
       (and condo sales data not seasonally adjusted)


      October 2025

      Median Sold Price of Existing Single-Family Homes

      Sales

      State/Region/County

      Oct.

      2025

      Sept.

      2025


      Oct.

      2024


      Price
      MTM%
      Chg

      Price
      YTY%
      Chg

       Sales
      MTM%
      Chg

       Sales
      YTY%
      Chg

      Calif. Single-family home

      $886,960

      $883,640


      $888,740


      0.4 %

      -0.2 %

      1.9 %

      4.1 %

      Calif. Condo/ Townhome

      $650,000

      $650,000


      $670,000


      0.0 %

      -3.0 %

      6.5 %

      8.1 %

      Los Angeles Metro Area

      $845,180

      $830,000


      $835,720


      1.8 %

      1.1 %

      10.1 %

      5.6 %

      Central Coast

      $1,068,000

      $1,005,000


      $990,000


      6.3 %

      7.9 %

      1.4 %

      -1.5 %

      Central Valley

      $499,000

      $499,000


      $500,000


      0.0 %

      -0.2 %

      4.8 %

      4.0 %

      Far North

      $375,000

      $390,500


      $390,000


      -4.0 %

      -3.8 %

      6.0 %

      18.0 %

      Inland Empire

      $599,520

      $591,010


      $599,000


      1.4 %

      0.1 %

      7.0 %

      6.4 %

      San Francisco Bay Area

      $1,300,000

      $1,300,000


      $1,315,000


      0.0 %

      -1.1 %

      12.4 %

      2.5 %

      Southern California

      $874,240

      $869,250


      $865,000


      0.6 %

      1.1 %

      8.4 %

      5.6 %


      San Francisco Bay Area


      Alameda

      $1,275,000

      $1,250,000


      $1,266,000


      2.0 %

      0.7 %

      10.5 %

      -2.4 %

      Contra Costa

      $860,000

      $869,000


      $869,500


      -1.0 %

      -1.1 %

      10.4 %

      2.2 %

      Marin

      $1,680,000

      $1,650,000


      $1,700,000


      1.8 %

      -1.2 %

      18.3 %

      -5.2 %

      Napa

      $899,500

      $900,000


      $910,000


      -0.1 %

      -1.2 %

      -1.3 %

      4.2 %

      San Francisco

      $1,850,000

      $1,750,000


      $1,750,000


      5.7 %

      5.7 %

      53.7 %

      11.5 %

      San Mateo

      $2,189,500

      $2,150,000


      $2,000,000


      1.8 %

      9.5 %

      15.9 %

      15.5 %

      Santa Clara

      $1,950,000

      $2,000,000


      $1,990,000


      -2.5 %

      -2.0 %

      6.7 %

      0.3 %

      Solano

      $597,000

      $608,000


      $603,000


      -1.8 %

      -1.0 %

      2.7 %

      4.8 %

      Sonoma

      $822,500

      $795,000


      $826,710


      3.5 %

      -0.5 %

      15.4 %

      2.5 %

      Southern California


      Imperial

      $400,000

      $457,000


      $389,990


      -12.5 %

      2.6 %

      -22.8 %

      -10.2 %

      Los Angeles

      $960,620

      $983,230


      $956,210


      -2.3 %

      0.5 %

      14.2 %

      5.5 %

      Orange

      $1,391,000

      $1,401,250


      $1,350,000


      -0.7 %

      3.0 %

      4.6 %

      3.2 %

      Riverside

      $634,990

      $624,000


      $635,000


      1.8 %

      0.0 %

      6.6 %

      9.6 %

      San Bernardino

      $491,970

      $500,030


      $499,000


      -1.6 %

      -1.4 %

      4.5 %

      3.8 %

      San Diego

      $985,000

      $990,000


      $1,010,000


      -0.5 %

      -2.5 %

      2.9 %

      6.1 %

      Ventura

      $947,500

      $900,000


      $940,000


      5.3 %

      0.8 %

      17.5 %

      9.4 %

      Central Coast


      Monterey

      $1,015,000

      $950,000


      $919,840


      6.8 %

      10.3 %

      28.1 %

      25.4 %

      San Luis Obispo

      $920,000

      $912,500


      $943,000


      0.8 %

      -2.4 %

      -11.8 %

      -15.2 %

      Santa Barbara

      $1,327,500

      $1,100,000


      $1,047,500


      20.7 %

      26.7 %

      1.8 %

      -1.1 %

      Santa Cruz

      $1,275,000

      $1,234,800


      $1,325,000


      3.3 %

      -3.8 %

      -6.9 %

      -9.0 %

      Central Valley


      Fresno

      $440,000

      $445,000


      $410,500


      -1.1 %

      7.2 %

      -0.6 %

      6.5 %

      Glenn

      $325,000

      $377,500


      $353,500


      -13.9 %

      -8.1 %

      41.7 %

      21.4 %

      Kern

      $389,000

      $405,000


      $399,500


      -4.0 %

      -2.6 %

      25.6 %

      6.6 %

      Kings

      $357,500

      $374,000


      $340,000


      -4.4 %

      5.1 %

      -20.4 %

      52.9 %

      Madera

      $459,000

      $450,000


      $438,000


      2.0 %

      4.8 %

      18.3 %

      -5.8 %

      Merced

      $415,000

      $430,000


      $412,000


      -3.5 %

      0.7 %

      31.0 %

      17.7 %

      Placer

      $658,750

      $653,000


      $649,200


      0.9 %

      1.5 %

      3.7 %

      8.5 %

      Sacramento

      $550,000

      $539,860


      $550,000


      1.9 %

      0.0 %

      -1.5 %

      -3.9 %

      San Benito

      $774,820

      $750,000


      $820,000


      3.3 %

      -5.5 %

      -11.4 %

      -18.4 %

      San Joaquin

      $540,000

      $555,000


      $553,950


      -2.7 %

      -2.5 %

      8.2 %

      7.9 %

      Stanislaus

      $475,000

      $475,000


      $485,000


      0.0 %

      -2.1 %

      5.5 %

      -3.7 %

      Tulare

      $380,000

      $380,000


      $391,750


      0.0 %

      -3.0 %

      7.8 %

      18.0 %

      Far North


      Butte

      $447,000

      $462,000


      $464,000


      -3.2 %

      -3.7 %

      8.8 %

      12.1 %

      Lassen

      $251,500

      $260,000


      $282,500


      -3.3 %

      -11.0 %

      -5.0 %

      58.3 %

      Plumas

      $415,000

      $455,000


      $377,500


      -8.8 %

      9.9 %

      -12.8 %

      36.7 %

      Shasta

      $360,500

      $385,000


      $379,000


      -6.4 %

      -4.9 %

      13.8 %

      22.3 %

      Siskiyou

      $286,000

      $305,500


      $301,250


      -6.4 %

      -5.1 %

      -9.5 %

      -5.0 %

      Tehama

      $353,880

      $311,500


      $345,000


      13.6 %

      2.6 %

      -21.4 %

      -12.0 %

      Trinity

      $250,000

      $210,000


      $205,000


      19.0 %

      22.0 %

      160.0 %

      85.7 %

      Other Calif. Counties


      Amador

      $414,500

      $421,000


      $440,000


      -1.5 %

      -5.8 %

      21.1 %

      -6.1 %

      Calaveras

      $424,500

      $455,000


      $434,500


      -6.7 %

      -2.3 %

      -4.2 %

      -10.5 %

      Del Norte

      $360,000

      $455,000


      $399,500


      -20.9 %

      -9.9 %

      11.8 %

      5.6 %

      El Dorado

      $680,000

      $680,000


      $664,000


      0.0 %

      2.4 %

      -12.1 %

      -2.2 %

      Humboldt

      $406,850

      $460,000


      $435,000


      -11.6 %

      -6.5 %

      12.3 %

      33.7 %

      Lake

      $340,000

      $356,500


      $340,000


      -4.6 %

      0.0 %

      20.0 %

      20.0 %

      Mariposa

      $460,000

      $488,750


      $465,000


      -5.9 %

      -1.1 %

      16.7 %

      -6.7 %

      Mendocino

      $512,000

      $473,500


      $516,000


      8.1 %

      -0.8 %

      -4.0 %

      -9.4 %

      Mono

      $1,150,000

      $1,250,000


      $970,000


      -8.0 %

      18.6 %

      57.1 %

      0.0 %

      Nevada

      $557,000

      $532,500


      $527,500


      4.6 %

      5.6 %

      -6.1 %

      0.9 %

      Sutter

      $486,000

      $443,000


      $439,000


      9.7 %

      10.7 %

      12.5 %

      20.0 %

      Tuolumne

      $360,000

      $424,500


      $425,000


      -15.2 %

      -15.3 %

      9.4 %

      14.8 %

      Yolo

      $625,000

      $628,000


      $612,500


      -0.5 %

      2.0 %

      0.0 %

      3.8 %

      Yuba

      $454,950

      $435,000


      $435,620


      4.6 %

      4.4 %

      -4.2 %

      -1.4 %

      r = revised
      NA = not available

      October 2025 County Unsold Inventory and Days on Market 
       (Regional and condo sales data not seasonally adjusted)


      October 2025

      Unsold Inventory Index

      Median Time on Market

      State/Region/County

      Oct.

      2025

      Sept.

      2025


      Oct.

      2024


      Oct.

      2025

      Sept.

      2025


      Oct.

      2024


      Calif. Single-family home

      3.2

      3.6


      3.1


      32.0

      32.0


      25.0


      Calif. Condo/Townhome

      3.9

      4.3


      3.5


      38.0

      37.0


      28.0


      Los Angeles Metro Area

      3.4

      3.8


      3.4


      37.0

      34.0


      28.0


      Central Coast

      3.5

      3.7


      3.2


      30.0

      25.5


      22.0


      Central Valley

      3.3

      3.6


      3.1


      32.0

      31.0


      24.0


      Far North

      4.5

      5.2


      5.0


      34.0

      37.0


      28.0


      Inland Empire

      4.1

      4.5


      4.1


      44.0

      39.0


      33.0


      San Francisco Bay Area

      2.2

      2.8


      2.1


      22.0

      24.0


      18.0


      Southern California

      3.3

      3.7


      3.3


      35.0

      33.0


      27.0


      San Francisco Bay Area


      Alameda

      2.0

      2.4


      1.9


      14.0

      16.0


      14.0


      Contra Costa

      2.4

      2.9


      2.1


      19.0

      22.0


      15.0


      Marin

      2.4

      3.4


      2.0


      59.0

      66.0


      53.0


      Napa

      7.0

      7.4


      6.0


      88.5

      114.0


      72.0


      San Francisco

      1.2

      2.0


      1.7


      37.0

      33.0


      36.0


      San Mateo

      1.7

      2.1


      1.8


      12.0

      12.0


      12.0


      Santa Clara

      1.5

      1.8


      1.5


      10.0

      10.0


      9.0


      Solano

      3.3

      3.6


      2.9


      59.0

      54.0


      45.0


      Sonoma

      3.2

      4.1


      2.8


      69.0

      76.0


      59.0


      Southern California


      Imperial

      4.0

      2.8


      2.1


      22.0

      9.0


      15.0


      Los Angeles

      3.3

      3.7


      3.3


      33.0

      31.0


      25.0


      Orange

      2.7

      3.0


      2.6


      34.0

      33.0


      27.0


      Riverside

      3.9

      4.2


      4.1


      43.0

      38.0


      34.0


      San Bernardino

      4.6

      5.1


      4.4


      46.0

      43.0


      33.0


      San Diego

      2.9

      3.1


      2.8


      25.0

      26.0


      20.0


      Ventura

      3.0

      3.8


      2.6


      46.0

      37.0


      33.0


      Central Coast


      Monterey

      3.2

      4.4


      4.0


      30.5

      21.0


      19.0


      San Luis Obispo

      3.8

      3.4


      3.0


      35.0

      32.0


      24.0


      Santa Barbara

      3.2

      3.5


      3.1


      27.5

      24.0


      22.0


      Santa Cruz

      3.7

      3.7


      3.1


      23.5

      28.0


      19.5


      Central Valley


      Fresno

      3.8

      3.7


      3.6


      24.0

      26.0


      19.0


      Glenn

      3.5

      5.3


      3.6


      18.0

      39.5


      15.0


      Kern

      3.2

      4.1


      3.1


      29.0

      28.0


      23.0


      Kings

      3.9

      3.1


      3.4


      26.5

      32.0


      24.0


      Madera

      4.6

      5.7


      4.7


      46.0

      51.0


      38.0


      Merced

      3.0

      4.0


      3.4


      32.0

      34.0


      19.0


      Placer

      2.9

      3.4


      3.0


      37.0

      41.0


      29.0


      Sacramento

      2.9

      3.0


      2.5


      32.0

      28.0


      23.0


      San Benito

      4.7

      4.3


      3.6


      19.0

      37.0


      32.0


      San Joaquin

      3.4

      4.0


      3.4


      41.0

      39.0


      25.0


      Stanislaus

      3.5

      3.6


      2.9


      30.0

      28.0


      27.0


      Tulare

      3.3

      3.8


      3.2


      33.0

      27.0


      20.0


      Far North


      Butte

      3.3

      3.8


      3.4


      24.0

      32.5


      21.0


      Lassen

      5.6

      6.4


      8.6


      40.0

      49.0


      54.5


      Plumas

      3.7

      4.5


      5.8


      76.0

      45.0


      45.5


      Shasta

      4.4

      5.1


      4.6


      30.0

      28.5


      27.0


      Siskiyou

      6.4

      6.8


      6.2


      46.0

      49.0


      47.0


      Tehama

      6.5

      5.0


      5.9


      72.5

      65.0


      42.0


      Trinity

      9.1

      24.2


      14.4


      64.0

      127.0


      33.0


      Other Calif. Counties


      Amador

      6.6

      8.7


      5.4


      65.0

      86.0


      44.0


      Calaveras

      5.1

      5.3


      5.1


      58.0

      69.0


      59.0


      Del Norte

      5.1

      6.3


      5.2


      75.0

      28.0


      58.5


      El Dorado

      4.2

      4.0


      4.1


      53.5

      42.0


      41.5


      Humboldt

      4.9

      5.9


      6.4


      44.0

      48.0


      39.0


      Lake

      7.8

      9.7


      7.9


      64.5

      92.0


      39.0


      Mariposa

      8.9

      11.3


      7.9


      67.0

      41.5


      41.0


      Mendocino

      8.6

      8.9


      6.6


      117.0

      124.0


      77.0


      Mono

      2.8

      4.0


      2.5


      50.0

      41.0


      40.0


      Nevada

      3.9

      4.3


      4.4


      59.0

      61.5


      45.5


      Sutter

      3.6

      4.2


      4.0


      43.0

      44.0


      29.0


      Tuolumne

      6.0

      7.5


      6.6


      81.5

      75.0


      43.0


      Yolo

      2.7

      3.0


      2.9


      43.5

      29.5


      19.0


      Yuba

      4.6

      4.8


      4.8


      47.0

      43.0


      43.0


      r = revised
      NA = not available

      SOURCE CALIFORNIA ASSOCIATION OF REALTORS® (C.A.R.)

      Modal title

      Also from this source

      The CALIFORNIA ASSOCIATION OF REALTORS® installs its 2027 Leadership Team

      The CALIFORNIA ASSOCIATION OF REALTORS® installs its 2027 Leadership Team

      The CALIFORNIA ASSOCIATION OF REALTORS® (C.A.R.) has installed its 2027 Leadership Team. C.A.R. President Mark Peterson, a Southern California...
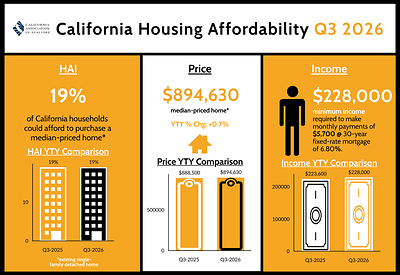
      California housing affordability holds steady in third-quarter 2026 as lower home prices offset higher mortgage rates, C.A.R. reports

      California housing affordability holds steady in third-quarter 2026 as lower home prices offset higher mortgage rates, C.A.R. reports

      California housing affordability held steady in the third quarter of 2026 as lower home prices helped offset higher mortgage rates and kept monthly...

      More Releases From This Source

      Explore

      Residential Real Estate

      Residential Real Estate

      Real Estate

      Real Estate

      Banking & Financial Services

      Banking & Financial Services

      Economic News, Trends, Analysis

      Economic News, Trends, Analysis

      News Releases in Similar Topics

      Contact PR Newswire

      • Call PR Newswire at 888-776-0942
        from 8 AM - 9 PM ET
      • Chat with an Expert
      • General Inquiries
      • Editorial Bureaus
      • Partnerships
      • Media Inquiries
      • Worldwide Offices

      Products

      • Explore Our Platform
      • Plan Campaigns
      • Create with AI
      • Distribute Press Releases
      • Report Results
      • Amplify Content

      About

      • About PR Newswire
      • About Cision
      • Careers
      • Accessibility Statement
      • APAC
      • APAC - Simplified Chinese
      • APAC - Traditional Chinese
      • Brazil
      • Canada
      • Czech
      • Denmark
      • Finland
      • France
      • Germany
      • India
      • Indonesia
      • Israel
      • Italy
      • Japan
      • Korea
      • Mexico
      • Middle East
      • Middle East - Arabic
      • Netherlands
      • Norway
      • Poland
      • Portugal
      • Russia
      • Slovakia
      • Spain
      • Sweden
      • United Kingdom
      • Vietnam

      My Services

      • All New Releases
      • Platform Login
      • Data Privacy

      Do not sell or share my personal information:

      • Submit via [email protected] 
      • Call Privacy toll-free: 877-297-8921

      Contact PR Newswire

      Products

      About

      My Services
      • All News Releases
      • Platform Login
      • ProfNet
      Call PR Newswire at
      888-776-0942
      • Terms of Use
      • Privacy Policy
      • Information Security Policy
      • Site Map
      • RSS
      • Cookies
      Copyright © 2026 Cision US Inc.