California home sales rebound in August as lower rates lift demand, C.A.R. says

- Existing, single-family home sales totaled 264,240 in August on a seasonally adjusted annualized rate, up 0.9 percent from 261,820 in July and down 0.2 percent from 264,640 in August 2024.
- August's statewide median home price was $899,140, up 1.7 percent from $884,050 in July and up 1.2 percent from $888,740 in August 2024.
- Year-to-date statewide home sales were down 0.4 percent.
SACRAMENTO, Calif., Sept. 22, 2025 /PRNewswire/ -- A modest improvement in mortgage rates and stabilizing home prices boosted California home sales in August, the CALIFORNIA ASSOCIATION OF REALTORS® (C.A.R.) said today.
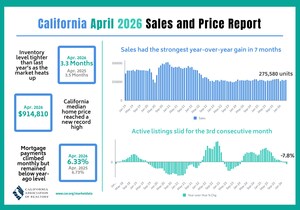
Infographic: https://www.car.org/Global/Infographics/2025-03-Sales-and-Price
Closed escrow sales of existing, single-family detached homes in California totaled a seasonally adjusted annualized rate of 264,240 in August, according to information collected by C.A.R. from more than 90 local REALTOR® associations and MLSs statewide. The statewide annualized sales figure represents what would be the total number of homes sold during 2025 if sales maintained the August pace throughout the year. It is adjusted to account for seasonal factors that typically influence home sales.
August home sales activity edged up 0.9 percent from the 261,820 homes sold in July and slipped 0.2 percent from a year ago, when 264,640 homes were sold on an annualized basis. August's sales level remained slightly below last year's revised level and marked the fifth consecutive month of year-over-year sales declines. It was also the 35th straight month in which the seasonally adjusted sales rate remained below the 300,000 benchmark.
Statewide pending sales in August rose 8.3 percent from July as mortgage rates fell to a 10-month low. On a year-over-year basis, pending sales edged higher by 0.2 percent for the first time in nine months. Rates have continued to ease in recent weeks, reaching their lowest level in a year amid mounting signs of economic weakness.
"Despite a softer-than-expected home buying season this year, a bounce back in pending sales last month is an encouraging sign that sales could improve the rest of the year," said C.A.R. President Heather Ozur, a Palm Springs REALTOR®. "Many prospective homebuyers have been holding out in hopes of lower mortgage rates, and the declining trend in rates observed in the last few weeks could be the nudge that draw them back to the market.
"The statewide median home price rose to $899,140 in August, rebounding after three straight months of year-over-year declines. The price increased 1.7 percent from July — recovering much of the previous month's drop — and was 1.2 percent higher than the same time last year. This monthly gain also surpassed the long-term July-to-August average of 1.2 percent. With prices showing stability in August and mortgage rates falling to their lowest level in a year, the housing market may see improved support in the months ahead.
"Soft sales demand led to a steady decline in California's median home price for three consecutive months through early summer," said C.A.R. Senior Vice President and Chief Economist Jordan Levine. "However, with a slight uptick in the median price in August and a stabilization in the number of reduced-price listings last month, the market appears to have found a short-term balance between supply and demand. "If mortgage rates maintain their current levels or decline further before year-end, positive year-over-year home price growth may continue in the next few months.
"Other key points from C.A.R.'s August 2025 resale housing report include:
- At the regional level, only two of California's major regions posted year-over-year sales gains on a non-seasonally adjusted basis. The Far North edged out a gain of 2.9 percent increase from a year ago, while the Central Coast surpassed last year's sales by 1.6 percent. In contrast, the San Francisco Bay Area experienced the largest regional decline with sales falling 4.1 percent, while Southern California (-3.7 percent) and the Central Valley (-3.5 percent) both experienced moderate sales dips.
- At the county level, 24 of the 53 counties tracked by C.A.R. recorded year-over-year sales gains in August, with nearly half of those counties achieving double-digit growth. Mariposa County (81.8 percent) led the way with the highest sales growth from last year, followed by Lassen (46.7 percent) and Kings (36.1 percent). Twenty-five counties experienced annual sales declines in August, with eight counties recording sales drops of more than 10 percent including Yuba (-35.3 percent), Calaveras (-31.3 percent), and Tehama (-24.0 percent).
- In August, three of California's five major regions recorded year-over-year median home prices gains, while the other two experienced a decline. The Central Coast led the way with a 6.3 percent price increase from August 2024. The San Francisco Bay Area median price climbed 2.8 percent year-over-year, and the Southern California region's median price rose a mild 1.2 percent. The median price in the Far North region dropped 3.1 percent compared to last year, and slipped 1.0 percent in the Central Valley,
- At the county level, 29 of California's 53 counties posted year-over-year median home price gains. Santa Barbara (32.6 percent) recorded the sharpest increase of all counties, followed by Monterey (20.8 percent) and Trinity (10.7 percent). Twenty-one counties registered annual median price declines, with Del Norte (-21.7 percent) dropping the most, while Mendocino (-17.3 percent), and Plumas (-12.3 percent) recorded the second and the third steepest annual price declines in August.
- The Unsold Inventory Index (UII) edged higher in August compared to July, as housing demand remained soft despite showing some slight improvement. The index was 3.9 months in August, a slight increase from 3.7 in July and up from 3.2 months in August 2024. Total active listings were up 23.5 percent from a year earlier, the slowest pace of growth since March 2024 — and slipped from the 69-month high recorded in the prior month. August marked the fourth consecutive month of decelerating inventory growth, suggesting that while supply conditions remain favorable for buyers, momentum on the supply side may continue to ease as the market follows its seasonal pattern and begins to decelerate in the fourth quarter.
- The median number of days it took to sell a California single-family home was 31 days in August, up from 22 days in August 2024.
- C.A.R.'s statewide sales-price-to-list-price ratio* was 98.3 percent in August 2025 and 100 percent in August 2024.
- The statewide median price per square foot** for an existing single-family home was $426, down from $427 in August a year ago.
- The 30-year, fixed-mortgage interest rate averaged 6.59 percent in August, up from 6.50 percent in August 2024, according to C.A.R.'s calculations based on Freddie Mac's weekly mortgage survey data.
Note: The County MLS median price and sales data in the tables are generated from a survey of more than 90 associations of REALTORS® throughout the state and represent statistics of existing single-family detached homes only. County sales data is not adjusted to account for seasonal factors that can influence home sales. Movements in sales prices should not be interpreted as changes in the cost of a standard home. The median price is where half sold for more and half sold for less; medians are more typical than average prices, which are skewed by a relatively small share of transactions at either the lower end or the upper end. Median prices can be influenced by changes in cost, as well as changes in the characteristics and the size of homes sold. The change in median prices should not be construed as actual price changes in specific homes.
*Sales-to-list-price ratio is an indicator that reflects the negotiation power of home buyers and home sellers under current market conditions. The ratio is calculated by dividing the final sales price of a property by its original list price and is expressed as a percentage. A sales-to-list ratio with 100 percent or above suggests that the property sold for more than the list price, and a ratio below 100 percent indicates that the price sold below the asking price.
**Price per square foot is a measure commonly used by real estate agents and brokers to determine how much a square foot of space a buyer will pay for a property. It is calculated as the sale price of the home divided by the number of finished square feet. C.A.R. currently tracks price-per-square foot statistics for 53 counties.
Leading the way…® in California real estate for 120 years, the CALIFORNIA ASSOCIATION OF REALTORS® (www.car.org) is one of the largest state trade organizations in the United States with 185,000 members dedicated to the advancement of professionalism in real estate. C.A.R. is headquartered in Sacramento.
August 2025 County Sales and Price Activity
(and condo sales data not seasonally adjusted)
August 2025 |
Median Sales Price of Existing Single-Family Homes |
Sales |
|||||||||
State/Region/County |
August2025 |
July2025 |
August2024 |
Price MTM% Chg |
Price YTY% Chg |
Sales MTM% Chg |
Sales YTY% Chg |
||||
Calif. Single-family home |
$899,140 |
$884,050 |
$888,740 |
1.7 % |
1.2 % |
0.9 % |
-0.2 % |
||||
Calif. Condo/Townhome |
$649,950 |
$647,000 |
$665,000 |
0.5 % |
-2.3 % |
-0.3 % |
-5.7 % |
||||
Los Angeles Metro Area |
$837,040 |
$845,500 |
$827,000 |
-1.0 % |
1.2 % |
-9.2 % |
-4.7 % |
||||
Central Coast |
$1,100,000 |
$1,115,680 |
$1,035,000 |
-1.4 % |
6.3 % |
-1.8 % |
1.6 % |
||||
Central Valley |
$495,000 |
$500,000 |
$500,000 |
-1.0 % |
-1.0 % |
-6.9 % |
-3.5 % |
||||
Far North |
$385,000 |
$397,000 |
$397,250 |
-3.0 % |
-3.1 % |
-6.1 % |
2.9 % |
||||
Inland Empire |
$600,130 |
$589,020 |
$585,260 |
1.9 % |
2.5 % |
-4.6 % |
-2.8 % |
||||
San Francisco Bay Area |
$1,275,000 |
$1,300,000 |
$1,240,000 |
-1.9 % |
2.8 % |
-8.3 % |
-4.1 % |
||||
Southern California |
$873,480 |
$875,030 |
$863,500 |
-0.2 % |
1.2 % |
-7.3 % |
-3.7 % |
||||
San Francisco Bay Area |
|||||||||||
Alameda |
$1,269,000 |
$1,250,000 |
$1,272,500 |
1.5 % |
-0.3 % |
-10.3 % |
-5.0 % |
||||
Contra Costa |
$850,000 |
$862,500 |
$841,950 |
-1.4 % |
1.0 % |
-4.3 % |
-7.5 % |
||||
Marin |
$1,522,500 |
$1,625,000 |
$1,450,000 |
-6.3 % |
5.0 % |
-21.9 % |
-3.3 % |
||||
Napa |
$975,000 |
$925,000 |
$976,500 |
5.4 % |
-0.2 % |
-15.2 % |
1.5 % |
||||
San Francisco |
$1,500,000 |
$1,637,380 |
$1,528,500 |
-8.4 % |
-1.9 % |
-19.6 % |
-1.3 % |
||||
San Mateo |
$1,988,000 |
$2,100,000 |
$1,900,000 |
-5.3 % |
4.6 % |
-12.8 % |
-1.8 % |
||||
Santa Clara |
$1,900,000 |
$1,900,000 |
$1,851,830 |
0.0 % |
2.6 % |
-1.2 % |
-3.0 % |
||||
Solano |
$620,000 |
$593,680 |
$600,000 |
4.4 % |
3.3 % |
-11.1 % |
-13.4 % |
||||
Sonoma |
$832,500 |
$845,450 |
$809,160 |
-1.5 % |
2.9 % |
-6.0 % |
5.9 % |
||||
Southern California |
|||||||||||
Imperial |
$405,000 |
$415,000 |
$410,640 |
-2.4 % |
-1.4 % |
-31.3 % |
12.2 % |
||||
Los Angeles |
$930,720 |
$911,360 |
$919,890 |
2.1 % |
1.2 % |
-16.0 % |
-12.3 % |
||||
Orange |
$1,385,000 |
$1,400,000 |
$1,400,000 |
-1.1 % |
-1.1 % |
-4.3 % |
1.4 % |
||||
Riverside |
$625,000 |
$630,000 |
$618,940 |
r |
-0.8 % |
1.0 % |
-6.2 % |
-7.0 % |
|||
San Bernardino |
$503,030 |
$486,290 |
$499,000 |
r |
3.4 % |
0.8 % |
-1.1 % |
3.6 % |
|||
San Diego |
$1,025,000 |
$1,040,000 |
$1,010,000 |
-1.4 % |
1.5 % |
1.3 % |
-0.6 % |
||||
Ventura |
$937,500 |
$949,500 |
$965,000 |
-1.3 % |
-2.8 % |
-7.3 % |
16.7 % |
||||
Central Coast |
|||||||||||
Monterey |
$1,087,150 |
$1,022,500 |
$900,000 |
6.3 % |
20.8 % |
0.7 % |
4.3 % |
||||
San Luis Obispo |
$935,400 |
$940,000 |
$942,500 |
-0.5 % |
-0.8 % |
3.4 % |
5.0 % |
||||
Santa Barbara |
$1,408,650 |
$1,095,500 |
$1,062,450 |
28.6 % |
32.6 % |
-2.3 % |
0.0 % |
||||
Santa Cruz |
$1,397,000 |
$1,395,500 |
$1,300,000 |
0.1 % |
7.5 % |
-11.3 % |
-4.5 % |
||||
Central Valley |
|||||||||||
Fresno |
$446,390 |
$440,000 |
$434,940 |
1.5 % |
2.6 % |
-7.4 % |
0.4 % |
||||
Glenn |
$350,000 |
$375,000 |
$325,000 |
-6.7 % |
7.7 % |
11.8 % |
26.7 % |
||||
Kern |
$415,000 |
$390,000 |
$399,500 |
6.4 % |
3.9 % |
-3.3 % |
4.6 % |
||||
Kings |
$380,000 |
$365,000 |
$380,000 |
4.1 % |
0.0 % |
1.0 % |
36.1 % |
||||
Madera |
$445,000 |
$445,000 |
$430,750 |
0.0 % |
3.3 % |
-11.0 % |
-7.9 % |
||||
Merced |
$418,500 |
$440,000 |
$415,000 |
-4.9 % |
0.8 % |
3.7 % |
6.3 % |
||||
Placer |
$675,000 |
$687,480 |
$675,000 |
-1.8 % |
0.0 % |
-12.8 % |
-12.0 % |
||||
Sacramento |
$550,000 |
$559,500 |
$559,000 |
-1.7 % |
-1.6 % |
-8.8 % |
-5.4 % |
||||
San Benito |
$742,500 |
$799,900 |
$812,500 |
-7.2 % |
-8.6 % |
8.6 % |
11.8 % |
||||
San Joaquin |
$535,000 |
$530,000 |
$560,000 |
0.9 % |
-4.5 % |
-2.0 % |
-13.1 % |
||||
Stanislaus |
$499,720 |
$475,000 |
$475,000 |
5.2 % |
5.2 % |
1.8 % |
0.0 % |
||||
Tulare |
$378,700 |
$382,990 |
$380,000 |
-1.1 % |
-0.3 % |
-17.7 % |
-4.8 % |
||||
Far North |
|||||||||||
Butte |
$468,000 |
$456,500 |
$458,000 |
2.5 % |
2.2 % |
-24.6 % |
-12.8 % |
||||
Lassen |
$221,000 |
$311,000 |
$236,000 |
-28.9 % |
-6.4 % |
22.2 % |
46.7 % |
||||
Plumas |
$480,000 |
$434,500 |
$547,420 |
10.5 % |
-12.3 % |
63.3 % |
22.5 % |
||||
Shasta |
$368,000 |
$380,000 |
$383,300 |
-3.2 % |
-4.0 % |
-7.0 % |
6.5 % |
||||
Siskiyou |
$300,000 |
$365,000 |
$305,500 |
-17.8 % |
-1.8 % |
13.9 % |
10.8 % |
||||
Tehama |
$335,000 |
$370,000 |
$380,000 |
-9.5 % |
-11.8 % |
-32.1 % |
-24.0 % |
||||
Trinity |
$310,000 |
$240,500 |
$280,000 |
28.9 % |
10.7 % |
-12.5 % |
0.0 % |
||||
Other Calif. Counties |
|||||||||||
Amador |
$469,500 |
$415,000 |
$431,000 |
13.1 % |
8.9 % |
0.0 % |
-8.3 % |
||||
Calaveras |
$540,000 |
$456,750 |
$505,000 |
18.2 % |
6.9 % |
-16.2 % |
-31.3 % |
||||
Del Norte |
$352,500 |
$369,000 |
$450,000 |
-4.5 % |
-21.7 % |
6.7 % |
6.7 % |
||||
El Dorado |
$679,500 |
$717,500 |
$650,000 |
-5.3 % |
4.5 % |
3.6 % |
-3.4 % |
||||
Humboldt |
$422,500 |
$450,000 |
$434,500 |
-6.1 % |
-2.8 % |
-11.7 % |
-5.4 % |
||||
Lake |
$355,000 |
$364,500 |
$329,950 |
-2.6 % |
7.6 % |
39.6 % |
8.1 % |
||||
Mariposa |
$415,000 |
$450,000 |
$410,000 |
-7.8 % |
1.2 % |
-13.0 % |
81.8 % |
||||
Mendocino |
$469,500 |
$467,000 |
$567,500 |
0.5 % |
-17.3 % |
27.3 % |
3.7 % |
||||
Mono |
$1,175,000 |
$1,064,000 |
$1,160,000 |
10.4 % |
1.3 % |
0.0 % |
11.1 % |
||||
Nevada |
$560,000 |
$549,500 |
$560,000 |
1.9 % |
0.0 % |
-4.5 % |
8.2 % |
||||
Sutter |
$435,000 |
$460,000 |
$416,500 |
-5.4 % |
4.4 % |
8.5 % |
0.0 % |
||||
Tuolumne |
$435,000 |
$455,000 |
$420,950 |
-4.4 % |
3.3 % |
-9.5 % |
-4.3 % |
||||
Yolo |
$599,450 |
$635,000 |
$620,960 |
-5.6 % |
-3.5 % |
0.0 % |
-1.7 % |
||||
Yuba |
$440,000 |
$440,000 |
$448,000 |
0.0 % |
-1.8 % |
-22.5 % |
-35.3 % |
||||
r = revised
NA = not available
August 2025 County Unsold Inventory and Days on Market
(Regional and condo sales data not seasonally adjusted)
August 2025 |
Unsold Inventory Index |
Median Time on Market |
||||||||
State/Region/County |
August2025 |
July2025 |
August2024 |
August2025 |
July2025 |
August2024 |
||||
Calif. Single-family home |
3.9 |
3.7 |
3.2 |
31.0 |
28.0 |
22.0 |
||||
Calif. Condo/Townhome |
4.4 |
4.5 |
3.2 |
37.0 |
34.0 |
25.0 |
||||
Los Angeles Metro Area |
4.1 |
3.9 |
3.3 |
33.0 |
30.0 |
24.0 |
||||
Central Coast |
3.8 |
3.9 |
3.5 |
26.0 |
22.0 |
21.0 |
||||
Central Valley |
3.8 |
3.6 |
3.0 |
31.0 |
27.0 |
22.0 |
||||
Far North |
5.5 |
5.2 |
4.8 |
32.0 |
32.0 |
31.0 |
||||
Inland Empire |
4.6 |
4.5 |
3.8 |
42.0 |
38.0 |
29.0 |
||||
San Francisco Bay Area |
2.9 |
2.7 |
2.5 |
25.0 |
24.0 |
20.0 |
||||
Southern California |
4.0 |
3.8 |
3.2 |
32.0 |
29.0 |
22.0 |
||||
San Francisco Bay Area |
||||||||||
Alameda |
2.6 |
2.4 |
2.4 |
16.0 |
16.0 |
14.0 |
||||
Contra Costa |
3.1 |
3.1 |
2.4 |
21.0 |
18.0 |
16.0 |
||||
Marin |
4.2 |
2.8 |
3.5 |
77.5 |
62.0 |
52.0 |
||||
Napa |
8.4 |
7.0 |
6.4 |
82.0 |
56.0 |
61.5 |
||||
San Francisco |
2.3 |
1.5 |
2.5 |
37.0 |
36.0 |
41.5 |
||||
San Mateo |
2.2 |
1.8 |
2.1 |
13.0 |
13.0 |
12.0 |
||||
Santa Clara |
1.9 |
1.9 |
1.7 |
13.0 |
13.0 |
10.0 |
||||
Solano |
4.2 |
3.6 |
2.9 |
47.0 |
49.0 |
39.5 |
||||
Sonoma |
3.7 |
3.7 |
3.4 |
67.0 |
63.0 |
54.5 |
||||
Southern California |
||||||||||
Imperial |
3.3 |
2.3 |
3.0 |
24.0 |
25.0 |
8.0 |
||||
Los Angeles |
4.3 |
3.7 |
3.1 |
28.0 |
27.0 |
21.0 |
||||
Orange |
3.2 |
3.3 |
2.7 |
32.5 |
28.0 |
22.0 |
||||
Riverside |
4.3 |
4.2 |
3.4 |
r |
46.0 |
40.0 |
30.0 |
r |
||
San Bernardino |
5.1 |
5.2 |
4.6 |
r |
34.0 |
35.0 |
28.0 |
r |
||
San Diego |
3.3 |
3.5 |
2.8 |
27.0 |
24.0 |
17.0 |
||||
Ventura |
3.6 |
3.5 |
3.3 |
41.5 |
41.0 |
32.0 |
||||
Central Coast |
||||||||||
Monterey |
4.2 |
4.2 |
4.1 |
21.0 |
22.5 |
18.0 |
||||
San Luis Obispo |
3.6 |
3.7 |
3.2 |
32.5 |
32.0 |
27.0 |
||||
Santa Barbara |
3.6 |
3.6 |
3.4 |
20.5 |
20.0 |
19.5 |
||||
Santa Cruz |
4.1 |
4.0 |
3.3 |
23.5 |
16.0 |
18.0 |
||||
Central Valley |
||||||||||
Fresno |
3.8 |
3.5 |
3.3 |
27.0 |
17.0 |
21.0 |
||||
Glenn |
2.9 |
3.1 |
2.8 |
39.0 |
40.0 |
24.0 |
||||
Kern |
3.3 |
3.2 |
2.9 |
26.0 |
28.0 |
15.0 |
||||
Kings |
3.1 |
3.2 |
2.2 |
33.5 |
35.0 |
28.0 |
||||
Madera |
6.6 |
6.1 |
5.7 |
55.0 |
38.5 |
28.0 |
||||
Merced |
3.4 |
3.8 |
3.3 |
33.0 |
27.0 |
33.0 |
||||
Placer |
3.9 |
3.5 |
2.9 |
34.5 |
30.0 |
28.0 |
||||
Sacramento |
3.2 |
3.0 |
2.5 |
28.0 |
27.0 |
21.0 |
||||
San Benito |
4.3 |
4.5 |
4.5 |
43.0 |
20.0 |
31.5 |
||||
San Joaquin |
4.5 |
4.5 |
3.0 |
39.0 |
31.0 |
24.0 |
||||
Stanislaus |
3.7 |
3.9 |
3.2 |
25.5 |
25.0 |
16.5 |
||||
Tulare |
4.3 |
3.3 |
3.0 |
32.0 |
33.0 |
24.0 |
||||
Far North |
||||||||||
Butte |
4.5 |
3.2 |
3.1 |
26.0 |
30.0 |
20.0 |
||||
Lassen |
6.3 |
8.2 |
8.5 |
46.5 |
33.0 |
64.0 |
||||
Plumas |
5.1 |
8.8 |
5.4 |
32.0 |
44.5 |
24.0 |
||||
Shasta |
4.9 |
4.6 |
4.3 |
35.0 |
28.0 |
34.0 |
||||
Siskiyou |
7.7 |
8.8 |
7.4 |
38.0 |
30.5 |
40.0 |
||||
Tehama |
7.8 |
5.0 |
6.2 |
42.0 |
54.5 |
42.0 |
||||
Trinity |
18.1 |
15.6 |
14.9 |
45.0 |
34.0 |
65.0 |
||||
Other Calif. Counties |
||||||||||
Amador |
7.3 |
7.6 |
6.3 |
49.0 |
58.0 |
30.0 |
||||
Calaveras |
7.3 |
6.3 |
4.8 |
39.0 |
46.5 |
34.0 |
||||
Del Norte |
6.6 |
7.6 |
7.7 |
49.5 |
61.0 |
29.0 |
||||
El Dorado |
4.9 |
5.5 |
4.3 |
33.5 |
36.0 |
29.5 |
||||
Humboldt |
6.0 |
5.6 |
5.2 |
39.5 |
29.5 |
36.5 |
||||
Lake |
8.0 |
11.2 |
7.2 |
63.0 |
60.0 |
44.0 |
||||
Mariposa |
7.3 |
6.5 |
10.6 |
56.0 |
24.0 |
27.0 |
||||
Mendocino |
8.4 |
10.8 |
7.1 |
93.5 |
95.0 |
68.5 |
||||
Mono |
3.4 |
4.3 |
4.1 |
37.0 |
12.0 |
38.0 |
||||
Nevada |
5.1 |
5.2 |
5.3 |
59.0 |
40.0 |
36.0 |
||||
Sutter |
4.2 |
4.6 |
3.2 |
44.0 |
30.0 |
22.0 |
||||
Tuolumne |
7.7 |
7.6 |
6.0 |
35.0 |
53.5 |
23.0 |
||||
Yolo |
3.2 |
3.8 |
2.7 |
29.0 |
33.5 |
19.0 |
||||
Yuba |
6.3 |
5.0 |
3.5 |
36.0 |
32.0 |
26.0 |
||||
r = revised
NA = not available
SOURCE CALIFORNIA ASSOCIATION OF REALTORS (C.A.R.)


Share this article