Decorative lighting market 2023-2027; A descriptive analysis of the five forces model, market dynamics, and segmentation - Technavio

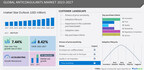
NEW YORK, Jan. 18, 2023 /PRNewswire/ -- According to Technavio, the global decorative lighting market size is estimated to grow by USD 9990.33 million from 2022 to 2027. The market is estimated to grow at a CAGR of 5.34% during the forecast period. APAC will account for 49% of the global market's growth during the forecast period. For more Insights on market size, Request a sample report
The global cloud data warehouse market is fragmented, and the five forces analysis covers–
- Bargaining Power of Buyers
- The threat of New Entrants
- Threat of Rivalry
- Bargaining Power of Suppliers
- Threat of Substitutes
- Interpretation of porter's five models helps to strategize the business, for entire details – buy the report!
The report includes the market's adoption lifecycle, from the innovator's stage to the laggard's stage. It focuses on adoption rates in different regions based on penetration. Furthermore, the report also includes key purchase criteria and drivers of price sensitivity to help companies evaluate and develop their growth strategies.
Segment Overview
Technavio has segmented the market based on distribution channel (offline and online), product (ceiling, wall mounted, and others), and geography (APAC, Europe, North America, South America, and Middle East and Africa).
- The market share growth by the offline segment will be significant during the forecast period. Offline stores allow customers to check the products before making a purchase. The stores offer a large product portfolio and support and information on products. This helps customers understand innovative features, the latest designs, patterns, and technology integrated into the products. All these factors are driving the growth of the segment.
Geography Overview
By geography, the global decorative lighting market is segmented into APAC, Europe, North America, South America, and Middle East and Africa. The report provides actionable insights and estimates the contribution of all regions to the growth of the global decorative lighting market.
- APAC is estimated to account for 49% of the market's growth during the forecast period. Many vendors operating in the region are focusing more on the development of energy-efficient lighting products that are environmentally friendly. Some are developing solar-based decorative lighting products such as solar table lamps, solar wall lights, solar-based balloon string lights, and other outdoor lights. These factors coupled with rising disposable income, growing urbanization, and growth in living standards of households are contributing to the growth of the decorative lighting market in APAC.
Key factor driving market growth
- The growth of the market is driven by evolving lighting product design concepts leading to premiumization.
- Increasing consumer demand for luxury products is encouraging manufacturers to introduce premium products with unique designs.
- Manufacturers, along with interior designers, are introducing innovative and attractive design concepts such as traditional, modern, contemporary, and transitional.
- These products are priced at premium prices and enjoy huge demand from high-net-worth residential users.
- The premiumization of decorative products through distinctive design concepts has led to increased adoption by premium customers, which is driving the growth of the market.
Leading trends influencing the market
- The advent of personalization and customization of decorative lighting products is identified as the key trend in the market.
- Evolving demands from consumers have encouraged vendors to provide personalization and customization options.
- Some vendors allow their customers to select distinct designs, bulbs, colors, and shapes of decorative lighting products such as chandeliers and pendant lights.
- For instance, Hangout Lighting, a US-based company, offers personalization and customization of its decorative lighting products, such as chandeliers and pendant lights. The company offers a range of chandeliers in which the customers can choose cord colors, ceiling plate finish, socket style, and types of bulbs.
- The increasing demand for personalized products is encouraging many vendors to provide customization in their offerings. This trend will positively influence market growth.
Major challenges hindering market growth
- The high use of alternative lighting products is one of the major challenges hindering market growth.
- Traditional lighting products such as normal bulbs and tube lights are economical when compared with decorative lights and they provide the required brightness.
- Normal lighting products are highly adopted by mass consumers due to their low cost.
- The increasing penetration of LED lights and the government's push to encourage their use have further reduced the growth potential in the market in focus.
What are the key data covered in this decorative lighting market report?
- CAGR of the market during the forecast period
- Detailed information on factors that will drive the growth of the decorative lighting market between 2023 and 2027
- Precise estimation of the size of the decorative lighting market size and its contribution to the market in focus on the parent market
- Accurate predictions about upcoming trends and changes in consumer behavior
- Growth of the decorative lighting market industry across APAC, Europe, North America, South America, and Middle East and Africa
- A thorough analysis of the market's competitive landscape and detailed information about vendors
- Comprehensive analysis of factors that will challenge the growth of decorative lighting market vendors
Gain instant access to 17,000+ market research reports.
Technavio's SUBSCRIPTION platform
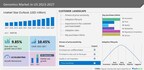
- The outdoor landscape lighting market size in North America is expected to increase by USD 147.51 million from 2021 to 2026, and the market's growth momentum will accelerate at a CAGR of 5.22%. The growing demand for LED lighting for different applications is notably driving the outdoor landscape lighting market growth in North America, although factors such as poor performance of LED lighting products at high temperatures may impede the market growth.
- The LED lighting market is estimated to grow at a CAGR of 7.35% between 2022 and 2027. The size of the market is forecast to increase by USD 34.82 billion. The declining manufacturing cost of LED lights is notably driving the market growth, although factors such as the limited thermal tolerance of LEDs installed in industrial facilities may impede the market growth.
Decorative Lighting Market Scope
Report Coverage |
Details |
Page number |
159 |
Base year |
2022 |
Historic period |
2017-2021 |
Forecast period |
2023-2027 |
Growth momentum & CAGR |
Accelerate at a CAGR of 5.34% |
Market growth 2023-2027 |
USD 9990.33 million |
Market structure |
Fragmented |
YoY growth 2022-2023 (%) |
4.13 |
Regional analysis |
APAC, Europe, North America, South America, and Middle East and Africa |
Performing market contribution |
APAC at 49% |
Key countries |
US, China, Japan, Germany, and UK |
Competitive landscape |
Leading Vendors, Market Positioning of Vendors, Competitive Strategies, and Industry Risks |
Key companies profiled |
AB Fagerhult, Acuity Brands Inc., Amerlux LLC, Bridgelux Inc., Capital Lighting Fixture Co., Crenshaw Lighting, Feit Electric Co. Inc., GE CURRENT A DAINTREE COMPANY, Generation Lighting, Honeywell International Inc., Hubbell Inc., Hudson Valley Lighting Inc., IDEAL INDUSTRIES Inc., Lowes Co. Inc, Maxim Lighting International, OSRAM GmbH, Shimera Project Lighting Pvt. Ltd., Signify NV, The Jaquar Group, and Voylite |
Market dynamics |
Parent market analysis, market growth inducers and obstacles, fast-growing and slow-growing segment analysis, COVID-19 impact and recovery analysis and future consumer dynamics, and market condition analysis for the forecast period. |
Customization purview |
If our report has not included the data that you are looking for, you can reach out to our analysts and get segments customized. |
Customization purview |
If our report has not included the data that you are looking for, you can reach out to our analysts and get segments customized. |
1 Executive Summary
- 1.1 Market overview
- Exhibit 01: Executive Summary – Chart on Market Overview
- Exhibit 02: Executive Summary – Data Table on Market Overview
- Exhibit 03: Executive Summary – Chart on Global Market Characteristics
- Exhibit 04: Executive Summary – Chart on Market by Geography
- Exhibit 05: Executive Summary – Chart on Market Segmentation by Distribution Channel
- Exhibit 06: Executive Summary – Chart on Market Segmentation by Product
- Exhibit 07: Executive Summary – Chart on Incremental Growth
- Exhibit 08: Executive Summary – Data Table on Incremental Growth
- Exhibit 09: Executive Summary – Chart on Vendor Market Positioning
2 Market Landscape
- 2.1 Market ecosystem
- Exhibit 10: Parent market
- Exhibit 11: Market Characteristics
3 Market Sizing
- 3.1 Market definition
- Exhibit 12: Offerings of vendors included in the market definition
- 3.2 Market segment analysis
- Exhibit 13: Market segments
- 3.3 Market size 2022
- 3.4 Market outlook: Forecast for 2022-2027
- Exhibit 14: Chart on Global - Market size and forecast 2022-2027 ($ million)
- Exhibit 15: Data Table on Global - Market size and forecast 2022-2027 ($ million)
- Exhibit 16: Chart on Global Market: Year-over-year growth 2022-2027 (%)
- Exhibit 17: Data Table on Global Market: Year-over-year growth 2022-2027 (%)
4 Historic Market Size
- 4.1 Global decorative lighting market 2017 - 2021
- Exhibit 18: Historic Market Size – Data Table on Global decorative lighting market 2017 - 2021 ($ million)
- 4.2 Distribution channel Segment Analysis 2017 - 2021
- Exhibit 19: Historic Market Size – Distribution channel Segment 2017 - 2021 ($ million)
- 4.3 Product Segment Analysis 2017 - 2021
- Exhibit 20: Historic Market Size – Product Segment 2017 - 2021 ($ million)
- 4.4 Geography Segment Analysis 2017 - 2021
- Exhibit 21: Historic Market Size – Geography Segment 2017 - 2021 ($ million)
- 4.5 Country Segment Analysis 2017 - 2021
- Exhibit 22: Historic Market Size – Country Segment 2017 - 2021 ($ million)
5 Five Forces Analysis
- 5.1 Five forces summary
- Exhibit 23: Five forces analysis - Comparison between 2022 and 2027
- 5.2 Bargaining power of buyers
- Exhibit 24: Chart on Bargaining power of buyers – Impact of key factors 2022 and 2027
- 5.3 Bargaining power of suppliers
- Exhibit 25: Bargaining power of suppliers – Impact of key factors in 2022 and 2027
- 5.4 Threat of new entrants
- Exhibit 26: Threat of new entrants – Impact of key factors in 2022 and 2027
- 5.5 Threat of substitutes
- Exhibit 27: Threat of substitutes – Impact of key factors in 2022 and 2027
- 5.6 Threat of rivalry
- Exhibit 28: Threat of rivalry – Impact of key factors in 2022 and 2027
- 5.7 Market condition
- Exhibit 29: Chart on Market condition - Five forces 2022 and 2027
6 Market Segmentation by Distribution Channel
- 6.1 Market segments
- Exhibit 30: Chart on Distribution Channel - Market share 2022-2027 (%)
- Exhibit 31: Data Table on Distribution Channel - Market share 2022-2027 (%)
- 6.2 Comparison by Distribution Channel
- Exhibit 32: Chart on Comparison by Distribution Channel
- Exhibit 33: Data Table on Comparison by Distribution Channel
- 6.3 Offline - Market size and forecast 2022-2027
- Exhibit 34: Chart on Offline - Market size and forecast 2022-2027 ($ million)
- Exhibit 35: Data Table on Offline - Market size and forecast 2022-2027 ($ million)
- Exhibit 36: Chart on Offline - Year-over-year growth 2022-2027 (%)
- Exhibit 37: Data Table on Offline - Year-over-year growth 2022-2027 (%)
- 6.4 Online - Market size and forecast 2022-2027
- Exhibit 38: Chart on Online - Market size and forecast 2022-2027 ($ million)
- Exhibit 39: Data Table on Online - Market size and forecast 2022-2027 ($ million)
- Exhibit 40: Chart on Online - Year-over-year growth 2022-2027 (%)
- Exhibit 41: Data Table on Online - Year-over-year growth 2022-2027 (%)
- 6.5 Market opportunity by Distribution Channel
- Exhibit 42: Market opportunity by Distribution Channel ($ million)
7 Market Segmentation by Product
- 7.1 Market segments
- Exhibit 43: Chart on Product - Market share 2022-2027 (%)
- Exhibit 44: Data Table on Product - Market share 2022-2027 (%)
- 7.2 Comparison by Product
- Exhibit 45: Chart on Comparison by Product
- Exhibit 46: Data Table on Comparison by Product
- 7.3 Ceiling - Market size and forecast 2022-2027
- Exhibit 47: Chart on Ceiling - Market size and forecast 2022-2027 ($ million)
- Exhibit 48: Data Table on Ceiling - Market size and forecast 2022-2027 ($ million)
- Exhibit 49: Chart on Ceiling - Year-over-year growth 2022-2027 (%)
- Exhibit 50: Data Table on Ceiling - Year-over-year growth 2022-2027 (%)
- 7.4 Wall mounted - Market size and forecast 2022-2027
- Exhibit 51: Chart on Wall mounted - Market size and forecast 2022-2027 ($ million)
- Exhibit 52: Data Table on Wall mounted - Market size and forecast 2022-2027 ($ million)
- Exhibit 53: Chart on Wall mounted - Year-over-year growth 2022-2027 (%)
- Exhibit 54: Data Table on Wall mounted - Year-over-year growth 2022-2027 (%)
- 7.5 Others - Market size and forecast 2022-2027
- Exhibit 55: Chart on Others - Market size and forecast 2022-2027 ($ million)
- Exhibit 56: Data Table on Others - Market size and forecast 2022-2027 ($ million)
- Exhibit 57: Chart on Others - Year-over-year growth 2022-2027 (%)
- Exhibit 58: Data Table on Others - Year-over-year growth 2022-2027 (%)
- 7.6 Market opportunity by Product
- Exhibit 59: Market opportunity by Product ($ million)
8 Customer Landscape
- 8.1 Customer landscape overview
- Exhibit 60: Analysis of price sensitivity, lifecycle, customer purchase basket, adoption rates, and purchase criteria
9 Geographic Landscape
- 9.1 Geographic segmentation
- Exhibit 61: Chart on Market share by geography 2022-2027 (%)
- Exhibit 62: Data Table on Market share by geography 2022-2027 (%)
- 9.2 Geographic comparison
- Exhibit 63: Chart on Geographic comparison
- Exhibit 64: Data Table on Geographic comparison
- 9.3 APAC - Market size and forecast 2022-2027
- Exhibit 65: Chart on APAC - Market size and forecast 2022-2027 ($ million)
- Exhibit 66: Data Table on APAC - Market size and forecast 2022-2027 ($ million)
- Exhibit 67: Chart on APAC - Year-over-year growth 2022-2027 (%)
- Exhibit 68: Data Table on APAC - Year-over-year growth 2022-2027 (%)
- 9.4 Europe - Market size and forecast 2022-2027
- Exhibit 69: Chart on Europe - Market size and forecast 2022-2027 ($ million)
- Exhibit 70: Data Table on Europe - Market size and forecast 2022-2027 ($ million)
- Exhibit 71: Chart on Europe - Year-over-year growth 2022-2027 (%)
- Exhibit 72: Data Table on Europe - Year-over-year growth 2022-2027 (%)
- 9.5 North America - Market size and forecast 2022-2027
- Exhibit 73: Chart on North America - Market size and forecast 2022-2027 ($ million)
- Exhibit 74: Data Table on North America - Market size and forecast 2022-2027 ($ million)
- Exhibit 75: Chart on North America - Year-over-year growth 2022-2027 (%)
- Exhibit 76: Data Table on North America - Year-over-year growth 2022-2027 (%)
- 9.6 South America - Market size and forecast 2022-2027
- Exhibit 77: Chart on South America - Market size and forecast 2022-2027 ($ million)
- Exhibit 78: Data Table on South America - Market size and forecast 2022-2027 ($ million)
- Exhibit 79: Chart on South America - Year-over-year growth 2022-2027 (%)
- Exhibit 80: Data Table on South America - Year-over-year growth 2022-2027 (%)
- 9.7 Middle East and Africa - Market size and forecast 2022-2027
- Exhibit 81: Chart on Middle East and Africa - Market size and forecast 2022-2027 ($ million)
- Exhibit 82: Data Table on Middle East and Africa - Market size and forecast 2022-2027 ($ million)
- Exhibit 83: Chart on Middle East and Africa - Year-over-year growth 2022-2027 (%)
- Exhibit 84: Data Table on Middle East and Africa - Year-over-year growth 2022-2027 (%)
- 9.8 China - Market size and forecast 2022-2027
- Exhibit 85: Chart on China - Market size and forecast 2022-2027 ($ million)
- Exhibit 86: Data Table on China - Market size and forecast 2022-2027 ($ million)
- Exhibit 87: Chart on China - Year-over-year growth 2022-2027 (%)
- Exhibit 88: Data Table on China - Year-over-year growth 2022-2027 (%)
- 9.9 US - Market size and forecast 2022-2027
- Exhibit 89: Chart on US - Market size and forecast 2022-2027 ($ million)
- Exhibit 90: Data Table on US - Market size and forecast 2022-2027 ($ million)
- Exhibit 91: Chart on US - Year-over-year growth 2022-2027 (%)
- Exhibit 92: Data Table on US - Year-over-year growth 2022-2027 (%)
- 9.10 Germany - Market size and forecast 2022-2027
- Exhibit 93: Chart on Germany - Market size and forecast 2022-2027 ($ million)
- Exhibit 94: Data Table on Germany - Market size and forecast 2022-2027 ($ million)
- Exhibit 95: Chart on Germany - Year-over-year growth 2022-2027 (%)
- Exhibit 96: Data Table on Germany - Year-over-year growth 2022-2027 (%)
- 9.11 Japan - Market size and forecast 2022-2027
- Exhibit 97: Chart on Japan - Market size and forecast 2022-2027 ($ million)
- Exhibit 98: Data Table on Japan - Market size and forecast 2022-2027 ($ million)
- Exhibit 99: Chart on Japan - Year-over-year growth 2022-2027 (%)
- Exhibit 100: Data Table on Japan - Year-over-year growth 2022-2027 (%)
- 9.12 UK - Market size and forecast 2022-2027
- Exhibit 101: Chart on UK - Market size and forecast 2022-2027 ($ million)
- Exhibit 102: Data Table on UK - Market size and forecast 2022-2027 ($ million)
- Exhibit 103: Chart on UK - Year-over-year growth 2022-2027 (%)
- Exhibit 104: Data Table on UK - Year-over-year growth 2022-2027 (%)
- 9.13 Market opportunity by geography
- Exhibit 105: Market opportunity by geography ($ million)
10 Drivers, Challenges, and Trends
- 10.1 Market drivers
- 10.2 Market challenges
- 10.3 Impact of drivers and challenges
- Exhibit 106: Impact of drivers and challenges in 2022 and 2027
- 10.4 Market trends
11 Vendor Landscape
- 11.1 Overview
- 11.2 Vendor landscape
- Exhibit 107: Overview on Criticality of inputs and Factors of differentiation
- 11.3 Landscape disruption
- Exhibit 108: Overview on factors of disruption
- 11.4 Industry risks
- Exhibit 109: Impact of key risks on business
12 Vendor Analysis
- 12.1 Vendors covered
- Exhibit 110: Vendors covered
- 12.2 Market positioning of vendors
- Exhibit 111: Matrix on vendor position and classification
- 12.3 AB Fagerhult
- Exhibit 112: AB Fagerhult - Overview
- Exhibit 113: AB Fagerhult - Product / Service
- Exhibit 114: AB Fagerhult - Key offerings
- 12.4 Acuity Brands Inc.
- Exhibit 115: Acuity Brands Inc. - Overview
- Exhibit 116: Acuity Brands Inc. - Business segments
- Exhibit 117: Acuity Brands Inc. - Key news
- Exhibit 118: Acuity Brands Inc. - Key offerings
- Exhibit 119: Acuity Brands Inc. - Segment focus
- 12.5 Amerlux LLC
- Exhibit 120: Amerlux LLC - Overview
- Exhibit 121: Amerlux LLC - Product / Service
- Exhibit 122: Amerlux LLC - Key offerings
- 12.6 Bridgelux Inc.
- Exhibit 123: Bridgelux Inc. - Overview
- Exhibit 124: Bridgelux Inc. - Product / Service
- Exhibit 125: Bridgelux Inc. - Key offerings
- 12.7 Capital Lighting Fixture Co.
- Exhibit 126: Capital Lighting Fixture Co. - Overview
- Exhibit 127: Capital Lighting Fixture Co. - Product / Service
- Exhibit 128: Capital Lighting Fixture Co. - Key offerings
- 12.8 Crenshaw Lighting
- Exhibit 129: Crenshaw Lighting - Overview
- Exhibit 130: Crenshaw Lighting - Product / Service
- Exhibit 131: Crenshaw Lighting - Key offerings
- 12.9 GE CURRENT A DAINTREE COMPANY
- Exhibit 132: GE CURRENT A DAINTREE COMPANY - Overview
- Exhibit 133: GE CURRENT A DAINTREE COMPANY - Product / Service
- Exhibit 134: GE CURRENT A DAINTREE COMPANY - Key offerings
- 12.10 Generation Lighting
- Exhibit 135: Generation Lighting - Overview
- Exhibit 136: Generation Lighting - Product / Service
- Exhibit 137: Generation Lighting - Key offerings
- 12.11 Honeywell International Inc.
- Exhibit 138: Honeywell International Inc. - Overview
- Exhibit 139: Honeywell International Inc. - Business segments
- Exhibit 140: Honeywell International Inc. - Key news
- Exhibit 141: Honeywell International Inc. - Key offerings
- Exhibit 142: Honeywell International Inc. - Segment focus
- 12.12 Hubbell Inc.
- Exhibit 143: Hubbell Inc. - Overview
- Exhibit 144: Hubbell Inc. - Business segments
- Exhibit 145: Hubbell Inc. - Key offerings
- Exhibit 146: Hubbell Inc. - Segment focus
- 12.13 Hudson Valley Lighting Inc.
- Exhibit 147: Hudson Valley Lighting Inc. - Overview
- Exhibit 148: Hudson Valley Lighting Inc. - Product / Service
- Exhibit 149: Hudson Valley Lighting Inc. - Key offerings
- 12.14 IDEAL INDUSTRIES Inc.
- Exhibit 150: IDEAL INDUSTRIES Inc. - Overview
- Exhibit 151: IDEAL INDUSTRIES Inc. - Product / Service
- Exhibit 152: IDEAL INDUSTRIES Inc. - Key offerings
- 12.15 Maxim Lighting International
- Exhibit 153: Maxim Lighting International - Overview
- Exhibit 154: Maxim Lighting International - Product / Service
- Exhibit 155: Maxim Lighting International - Key offerings
- 12.16 OSRAM GmbH
- Exhibit 156: OSRAM GmbH - Overview
- Exhibit 157: OSRAM GmbH - Business segments
- Exhibit 158: OSRAM GmbH - Key offerings
- Exhibit 159: OSRAM GmbH - Segment focus
- 12.17 Signify NV
- Exhibit 160: Signify NV - Overview
- Exhibit 161: Signify NV - Business segments
- Exhibit 162: Signify NV - Key news
- Exhibit 163: Signify NV - Key offerings
- Exhibit 164: Signify NV - Segment focus
13 Appendix
- 13.1 Scope of the report
- 13.2 Inclusions and exclusions checklist
- Exhibit 165: Inclusions checklist
- Exhibit 166: Exclusions checklist
- 13.3 Currency conversion rates for US$
- Exhibit 167: Currency conversion rates for US$
- 13.4 Research methodology
- Exhibit 168: Research methodology
- Exhibit 169: Validation techniques employed for market sizing
- Exhibit 170: Information sources
- 13.5 List of abbreviations
- Exhibit 171: List of abbreviations
About Us
Technavio is a leading global technology research and advisory company. Their research and analysis focuses on emerging market trends and provides actionable insights to help businesses identify market opportunities and develop effective strategies to optimize their market positions. With over 500 specialized analysts, Technavio's report library consists of more than 17,000 reports and counting, covering 800 technologies, spanning across 50 countries. Their client base consists of enterprises of all sizes, including more than 100 Fortune 500 companies. This growing client base relies on Technavio's comprehensive coverage, extensive research, and actionable market insights to identify opportunities in existing and potential markets and assess their competitive positions within changing market scenarios.
Contact
Technavio Research
Jesse Maida
Media & Marketing Executive
US: +1 844 364 1100
UK: +44 203 893 3200
Email: [email protected]
Website: www.technavio.com/
SOURCE Technavio


Share this article