HOME BANCORP, INC. ANNOUNCES 2022 FIRST QUARTER RESULTS AND DECLARES QUARTERLY DIVIDEND
LAFAYETTE, La., April 26, 2022 /PRNewswire/ -- Home Bancorp, Inc. (Nasdaq: "HBCP") (the "Company"), the parent company for Home Bank, N.A. (the "Bank") (www.home24bank.com), reported financial results for the first quarter of 2022. For the quarter, the Company reported net income of $4.4 million, or $0.53 per diluted common share ("diluted EPS"), down $5.8 million from $10.2 million, or $1.23 diluted EPS, for the fourth quarter of 2021. Income pre-tax, pre-provision and pre-PPP income totaled $8.2 million, up $178,000, or 2%, from the prior quarter.
Acquisition of Friendswood Capital Corporation
On March 26, 2022, the Company completed its acquisition of Friendswood Capital Corporation ("Friendswood"), the former holding company of Texan Bank, N. A. ("Texan Bank") of Houston, Texas. Shareholders of Friendswood received $15.34 per share of common stock. This acquisition added approximately $415.8 million in assets, $318.9 million in loans, $368.0 million in deposits and estimated goodwill of $20.9 million.
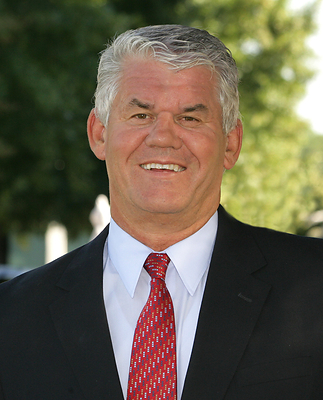
"The Board and Management of Home Bank are very excited to have completed the merger of Texan Bank in the first quarter," said John W. Bordelon, Chairman, President and Chief Executive Officer of the Company and the Bank. "The data conversion of Texan Bank's systems remains on track and will take place the last week of June. We look forward to working with our team in Houston to forge new relationships and provide enhanced technology to all of our Texas customers."
First Quarter 2022 Highlights
- Net interest income totaled $23.5 million, down $1.1 million, or 5% from the prior quarter. Excluding PPP income, net interest income totaled $22.7 million, up $258,000, or 1% from the prior quarter.
- The Company recorded a $3.2 million provision to the allowance for loan losses primarily due to the acquisition of Texan Bank, compared to a $2.6 million reversal to the allowance for loan losses in the prior quarter.
- Loan income from the recognition of deferred PPP lender fees totaled $721,000, down $1.3 million from the prior quarter.
- Loans totaled $2.2 billion at March 31, 2022, up $317.9 million, or 17%, from December 31, 2021 primarily due to the acquisition of Texan Bank. Excluding PPP loans, total organic loans were up $20.7 million, or 5% annualized, from December 31, 2021.
- PPP loans totaled $22.8 million at March 31, 2022, down $20.9 million, or 48%, from December 31, 2021.
- The allowance for loan losses totaled $26.7 million, or 1.24% of total loans, at March 31, 2022. Excluding PPP loans, the ratio of allowance for loan losses to total loans was 1.25%, at such date.
- Preliminary Tier 1 leverage capital and total risk-based capital ratios were 8.62% and 11.83%, respectively, at March 31, 2022, compared to 9.77% and 15.85%, respectively, at December 31, 2021.
Loans
Loans totaled $2.2 billion at March 31, 2022, up $317.9 million, or 17%, from December 31, 2021. The loan growth resulted from the addition of Texan Bank's loan portfolio, which amounted to $318.9 million on March 26, 2022 (the date of acquisition). PPP loans, included in commercial and industrial loans, decreased $20.9 million, or 48%, from December 31, 2021. The following table summarizes the changes in the Company's loan portfolio, net of unearned income, from December 31, 2021 to March 31, 2022.
(dollars in thousands) | 3/31/2022 | 12/31/2021 | Increase (Decrease) | |||||
Real estate loans: | ||||||||
One- to four-family first mortgage | $ 363,377 | $ 350,843 | $ 12,534 | 4 % | ||||
Home equity loans and lines | 58,375 | 60,312 | (1,937) | (3) | ||||
Commercial real estate | 1,046,568 | 801,624 | 244,944 | 31 | ||||
Construction and land | 297,079 | 259,652 | 37,427 | 14 | ||||
Multi-family residential | 98,527 | 90,518 | 8,009 | 9 | ||||
Total real estate loans | 1,863,926 | 1,562,949 | 300,977 | 19 | ||||
Other loans: | ||||||||
Commercial and industrial | 260,843 | 244,123 | 16,720 | 7 | ||||
Consumer | 33,200 | 33,021 | 179 | 1 | ||||
Total other loans | 294,043 | 277,144 | 16,899 | 6 | ||||
Total loans | $ 2,157,969 | $ 1,840,093 | $ 317,876 | 17 % | ||||
Credit Quality and Allowance for Credit Losses
Nonperforming assets ("NPAs") totaled $22.4 million, or 0.67% of total assets, at March 31, 2022, up $7.9 million, or 55%, from $14.5 million, or 0.49% of total assets, at December 31, 2021. The increase in NPAs during the first quarter of 2022 was primarily due to Texan Bank's NPAs, which amounted to $10.2 million on March 26, 2022 (the date of acquisition). During the first quarter of 2022, the Company recorded net loan recoveries of $149,000, compared to net charge-offs of $412,000 during the fourth quarter of 2021.
The Company provisioned $3.2 million for the allowance for loan losses in the first quarter of 2022 primarily due to the acquisition of Texan Bank's loan portfolio. For the three months ended December 31, 2021, we reversed a total of $2.6 million of the allowance for loan losses. At March 31, 2022, the allowance for loan losses totaled $26.7 million, or 1.24% of total loans, compared to $21.1 million, or 1.15% of total loans, at December 31, 2021. Excluding PPP loans, the ratios of the allowance for loan losses to total loans were 1.25% and 1.17% at March 31, 2022 and December 31, 2021, respectively. Changes in expected losses consider various factors including the changing economic activity, potential mitigating effects of governmental stimulus, the duration of the health crisis, customer specific information impacting changes in risk ratings, projected delinquencies and the impact of industry-wide loan modification efforts, among other factors.
Deposits
Total deposits were $2.9 billion at March 31, 2022, up $405.3 million, or 16%, from December 31, 2021. The increase was primarily from the addition of Texan Bank's deposits, which amounted to $368.0 million on March 26, 2022 (the date of acquisition). The following table summarizes the changes in the Company's deposits from December 31, 2021 to March 31, 2022.
(dollars in thousands) | 3/31/2022 | 12/31/2021 | Increase (Decrease) | |||||
Demand deposits | $ 913,137 | $ 766,385 | $ 146,752 | 19 % | ||||
Savings | 315,356 | 285,728 | 29,628 | 10 | ||||
Money market | 484,847 | 371,478 | 113,369 | 31 | ||||
NOW | 806,501 | 792,919 | 13,582 | 2 | ||||
Certificates of deposit | 421,338 | 319,339 | 101,999 | 32 | ||||
Total deposits | $ 2,941,179 | $ 2,535,849 | $ 405,330 | 16 % | ||||
The average rate on interest-bearing deposits decreased two basis points from 0.22% for the fourth quarter of 2021 to 0.20% for the first quarter of 2022. At March 31, 2022, certificates of deposit maturing within the next 12 months totaled $321.7 million.
Net Interest Income
The net interest margin ("NIM") decreased 14 basis points from 3.53% for the fourth quarter of 2021 to 3.39% for the first quarter of 2022 primarily due to a decrease in the average yield on loans. Loan income from the recognition of deferred PPP lender fees totaled $721,000 during the first quarter of 2022, down $1.3 million, or 64%, compared to the fourth quarter of 2021.
The average loan yield was 4.88% for the first quarter of 2022, down 24 basis points from the fourth quarter of 2021. During the first quarter of 2022, recognition of deferred lender fees from PPP loans increased the average loan yield by 9 basis points and increased the NIM by 8 basis points. During the fourth quarter of 2021, PPP loans positively impacted the average loan yield by 29 basis points and the NIM by 24 basis points.
Average PPP loans were $31.3 million for the first quarter of 2022, down $35.9 million, or 53%, from the fourth quarter of 2021. Unrecognized PPP lender fees totaled $580,000 at March 31, 2022.
Average other interest-earning assets were $561.3 million for the first quarter of 2022, down $16.7 million, or 3%, from the fourth quarter of 2021 primarily due to an increase in cash and cash equivalents.
Loan accretion income from acquired loans totaled $457,000 for the first quarter of 2022 and $485,000 for the fourth quarter of 2021.
The following table summarizes the Company's average volume and rate of its interest-earning assets and interest-bearing liabilities for the periods indicated. Taxable equivalent ("TE") yields on investment securities have been calculated using a marginal tax rate of 21%.
Quarter Ended | ||||||||||||
3/31/2022 | 12/31/2021 | |||||||||||
(dollars in thousands) | Average | Interest | Average | Average | Interest | Average | ||||||
Interest-earning assets: | ||||||||||||
Loans receivable | $ 1,862,616 | $ 22,667 | 4.88 % | $ 1,856,814 | $ 24,215 | 5.12 % | ||||||
Investment securities (TE) | 359,736 | 1,618 | 1.82 | 314,686 | 1,309 | 1.69 | ||||||
Other interest-earning assets | 561,262 | 277 | 0.20 | 577,945 | 264 | 0.18 | ||||||
Total interest-earning assets | $ 2,783,614 | $ 24,562 | 3.54 % | $ 2,749,445 | $ 25,788 | 3.69 % | ||||||
Interest-bearing liabilities: | ||||||||||||
Deposits: | ||||||||||||
Savings, checking, and money market | $ 1,461,966 | $ 530 | 0.15 % | $ 1,401,774 | $ 554 | 0.16 % | ||||||
Certificates of deposit | 317,866 | 363 | 0.46 | 327,567 | 420 | 0.51 | ||||||
Total interest-bearing deposits | 1,779,832 | 893 | 0.20 | 1,729,341 | 974 | 0.22 | ||||||
Other borrowings | 5,539 | 53 | 3.89 | 5,539 | 53 | 3.80 | ||||||
FHLB advances | 25,795 | 109 | 1.70 | 26,172 | 111 | 1.70 | ||||||
Total interest-bearing liabilities | $ 1,811,166 | $ 1,055 | 0.24 % | $ 1,761,052 | $ 1,138 | 0.26 % | ||||||
Net interest spread (TE) | 3.30 % | 3.43 % | ||||||||||
Net interest margin (TE) | 3.39 % | 3.53 % | ||||||||||
Noninterest Income
Noninterest income for the first quarter of 2022 totaled $3.4 million, down $144,000, or 4%, from the fourth quarter of 2021.
Service fees and charges were down primarily due to lower deposit account service charges and overdraft fees. Bank card fees and gain on the sale of loans were down due to seasonal factors.
Noninterest Expense
Noninterest expense for the first quarter of 2022 totaled $18.2 million, up $223,000, or 1%, from the fourth quarter of 2021.
Compensation and benefits was up $168,000 from the fourth quarter of 2021 primarily due to annual bonuses paid during the first quarter of 2022 and an increase in health insurance expense.
The Company recorded a $302,000 provision for credit losses on unfunded loan commitments during the first quarter of 2022, compared to $15,000 during the fourth quarter of 2021.
Marketing and advertising expense was down $626,000 from the fourth quarter of 2021 primarily due to lower charitable donations and general advertising activities during the first quarter of 2022.
Noninterest expense for the first quarter of 2022 and the fourth quarter of 2021 include $328,000 and $299,000, respectively, of merger expenses related to the acquisition of Friendswood.
Dividend and Share Repurchases
The Company announced that its Board of Directors declared a quarterly cash dividend on shares of its common stock of $0.23 per share payable on May 20, 2022, to shareholders of record as of May 9, 2022.
The Company repurchased 84,515 shares of its common stock during the first quarter of 2022 at an average price per share of $40.13. An additional 399,553 shares remain eligible for purchase under the 2020 Repurchase Plan. The book value per share and tangible book value per share of the Company's common stock was $39.93 and $29.57, respectively, at March 31, 2022.
Non-GAAP Reconciliation
This news release contains financial information determined by methods other than in accordance with generally accepted accounting principles ("GAAP"). The Company's management uses this non-GAAP financial information in its analysis of the Company's performance. In this news release, information is included which excludes intangible assets and PPP loans. Management believes the presentation of this non-GAAP financial information provides useful information that is helpful to a full understanding of the Company's financial position and operating results. This non-GAAP financial information should not be viewed as a substitute for financial information determined in accordance with GAAP, nor is it necessarily comparable to non-GAAP financial information presented by other companies. A reconciliation on non-GAAP information included herein to GAAP is presented below.
Quarter Ended | ||||||
(dollars in thousands, except per share data) | 3/31/2022 | 12/31/2021 | 3/31/2021 | |||
Reported net income | $ 4,401 | $ 10,238 | $ 11,928 | |||
Add: Core deposit intangible amortization, net tax | 252 | 221 | 237 | |||
Non-GAAP tangible income | $ 4,653 | $ 10,459 | $ 12,165 | |||
Reported loan income | $ 22,667 | $ 24,215 | $ 25,817 | |||
Less: PPP loan income | 800 | 2,201 | 3,893 | |||
Loan income excluding PPP loan income | $ 21,867 | $ 22,014 | $ 21,924 | |||
Provision (reversal) for loan losses | $ 3,215 | $ (2,648) | $ (1,703) | |||
Less: CECL impact for acquisition | 3,802 | — | — | |||
Provision (reversal) for organic loans | $ (587) | $ (2,648) | $ (1,703) | |||
Loan yield | 4.88 % | 5.12 % | 5.21 % | |||
(Positive) negative impact of PPP loans | (0.09) | (0.29) | (0.18) | |||
Loan yield excluding PPP loans | 4.79 % | 4.83 % | 5.03 % | |||
Net interest margin | 3.39 % | 3.53 % | 4.14 % | |||
(Positive) negative impact of PPP loans | (0.08) | (0.24) | (0.26) | |||
Net interest margin excluding PPP loans | 3.31 % | 3.29 % | 3.88 % | |||
Total assets | $ 3,332,228 | $ 2,938,244 | $ 2,707,517 | |||
Less: Intangible assets | 87,569 | 61,949 | 62,813 | |||
Non-GAAP tangible assets | $ 3,244,659 | $ 2,876,295 | $ 2,644,704 | |||
Total shareholders' equity | $ 337,504 | $ 351,903 | $ 328,610 | |||
Less: Intangible assets | 87,569 | 61,949 | 62,813 | |||
Non-GAAP tangible shareholders' equity | $ 249,935 | $ 289,954 | $ 265,797 | |||
Total loans | $ 2,157,969 | $ 1,840,093 | $ 1,979,868 | |||
Less: PPP loans | 19,596 | 43,637 | 235,681 | |||
Less: PPP loans from Texan | 3,163 | — | — | |||
Total loans excluding PPP loans | $ 2,135,210 | $ 1,796,456 | $ 1,744,187 | |||
Less: Texan Bank loan portfolio, excluding PPP loans | 318,044 | — | — | |||
Organic loan portfolio | $ 1,817,166 | $ 1,796,456 | $ 1,744,187 | |||
Quarter Ended | ||||||
3/31/2022 | 12/31/2021 | 3/31/2021 | ||||
Reported net income | $ 4,401 | $ 10,238 | $ 11,928 | |||
Add: Provision (reversal) for loan losses | 3,215 | (2,648) | (1,703) | |||
Add: Provision for credit losses on unfunded commitments | 302 | 15 | — | |||
Add: Income tax expense | 1,041 | 2,577 | 2,964 | |||
Pre-tax, pre-provision income | $ 8,959 | $ 10,182 | $ 13,189 | |||
Less: PPP income | 800 | 2,201 | 3,893 | |||
Pre-tax, pre-provision, pre- PPP income | $ 8,159 | $ 7,981 | $ 9,296 | |||
Allowance for loan losses to total loans | 1.24 % | 1.15 % | 1.51 % | |||
Less: PPP loans | 0.01 | 0.03 | 0.20 | |||
Non-GAAP allowance for loan losses to total loans | 1.25 % | 1.17 % | 1.72 % | |||
Return on average equity | 5.08 % | 11.65 % | 14.80 % | |||
Add: Average intangible assets | 1.39 | 2.83 | 3.90 | |||
Non-GAAP return on average tangible common equity | 6.47 % | 14.48 % | 18.70 % | |||
Common equity ratio | 10.13 % | 11.98 % | 12.14 % | |||
Less: Intangible assets | 2.43 | 1.90 | 2.09 | |||
Non-GAAP tangible common equity ratio | 7.70 % | 10.08 % | 10.05 % | |||
Book value per share | $ 39.93 | $ 41.27 | $ 37.73 | |||
Less: Intangible assets | 10.36 | 7.27 | 7.21 | |||
Non-GAAP tangible book value per share | $ 29.57 | $ 34.00 | $ 30.52 | |||
This news release contains certain forward-looking statements. Forward-looking statements can be identified by the fact that they do not relate strictly to historical or current facts. They often include the words "believe," "expect," "anticipate," "intend," "plan," "estimate" or words of similar meaning, or future or conditional verbs such as "will," "would," "should," "could" or "may."
Forward-looking statements, by their nature, are subject to risks and uncertainties. A number of factors - many of which are beyond our control - could cause actual conditions, events or results to differ significantly from those described in the forward-looking statements. Home Bancorp's Annual Report on Form 10-K for the year ended December 31, 2021 describes some of these factors, including risk elements in the loan portfolio, the level of the allowance for credit losses, the impact of the COVID-19 pandemic, risks of our growth strategy, geographic concentration of our business, dependence on our management team, risks of market rates of interest and of regulation on our business and risks of competition. Forward-looking statements speak only as of the date they are made. We do not undertake to update forward-looking statements to reflect circumstances or events that occur after the date the forward-looking statements are made or to reflect the occurrence of unanticipated events.
HOME BANCORP, INC. AND SUBSIDIARY | ||||||||
CONDENSED STATEMENTS OF FINANCIAL CONDITION | ||||||||
(Unaudited) | ||||||||
(dollars in thousands) | 3/31/2022 | 12/31/2021 | % Change | 3/31/2021 | ||||
Assets | ||||||||
Cash and cash equivalents | $ 548,019 | $ 601,443 | (9) % | $ 282,700 | ||||
Interest-bearing deposits in banks | 349 | 349 | — | 349 | ||||
Investment securities available for sale, at fair value | 415,260 | 327,632 | 27 | 274,965 | ||||
Investment securities held to maturity | 2,094 | 2,102 | — | 2,126 | ||||
Mortgage loans held for sale | 4,187 | 1,104 | 279 | 5,304 | ||||
Loans, net of unearned income | 2,157,969 | 1,840,093 | 17 | 1,979,868 | ||||
Allowance for loan losses | (26,731) | (21,089) | 27 | (29,993) | ||||
Total loans, net of allowance for loan losses | 2,131,238 | 1,819,004 | 17 | 1,949,875 | ||||
Office properties and equipment, net | 43,929 | 43,542 | 1 | 45,138 | ||||
Cash surrender value of bank-owned life insurance | 40,575 | 40,361 | 1 | 40,559 | ||||
Goodwill and core deposit intangibles | 87,569 | 61,949 | 41 | 62,813 | ||||
Accrued interest receivable and other assets | 59,008 | 40,758 | 45 | 43,688 | ||||
Total Assets | $ 3,332,228 | $ 2,938,244 | 13 | $ 2,707,517 | ||||
Liabilities | ||||||||
Deposits | $ 2,941,179 | $ 2,535,849 | 16 % | $ 2,328,365 | ||||
Other Borrowings | 5,539 | 5,539 | — | 5,539 | ||||
Federal Home Loan Bank advances | 25,671 | 26,046 | (1) | 28,106 | ||||
Accrued interest payable and other liabilities | 22,335 | 18,907 | 18 | 16,897 | ||||
Total Liabilities | 2,994,724 | 2,586,341 | 16 | 2,378,907 | ||||
Shareholders' Equity | ||||||||
Common stock | 85 | 85 | — % | 87 | ||||
Additional paid-in capital | 164,830 | 164,982 | — | 165,155 | ||||
Common stock acquired by benefit plans | (2,332) | (2,423) | 4 | (2,695) | ||||
Retained earnings | 188,386 | 188,515 | — | 163,507 | ||||
Accumulated other comprehensive (loss) income | (13,465) | 744 | (1910) | 2,556 | ||||
Total Shareholders' Equity | 337,504 | 351,903 | (4) | 328,610 | ||||
Total Liabilities and Shareholders' Equity | $ 3,332,228 | $ 2,938,244 | 13 | $ 2,707,517 | ||||
HOME BANCORP, INC. AND SUBSIDIARY | ||||||||||
CONDENSED STATEMENTS OF INCOME | ||||||||||
(Unaudited) | ||||||||||
Quarter Ended | ||||||||||
(dollars in thousands, except per share data) | 3/31/2022 | 12/31/2021 | % | 3/31/2021 | % | |||||
Interest Income | ||||||||||
Loans, including fees | $ 22,667 | $ 24,215 | (6) % | $ 25,817 | (12) % | |||||
Investment securities | 1,618 | 1,309 | 24 | 1,012 | 60 | |||||
Other investments and deposits | 277 | 264 | 5 | 99 | 180 | |||||
Total interest income | 24,562 | 25,788 | (5) | 26,928 | (9) | |||||
Interest Expense | ||||||||||
Deposits | 893 | 974 | (8) % | 1,656 | (46) % | |||||
Other borrowings | 53 | 53 | — | 53 | — | |||||
Federal Home Loan Bank advances | 109 | 111 | (2) | 124 | (12) | |||||
Total interest expense | 1,055 | 1,138 | (7) | 1,833 | (42) | |||||
Net interest income | 23,507 | 24,650 | (5) | 25,095 | (6) | |||||
Provision (reversal) for loan losses | 3,215 | (2,648) | 221 | (1,703) | 289 | |||||
Net interest income after provision (reversal) for loan losses | 20,292 | 27,298 | (26) | 26,798 | (24) | |||||
Noninterest Income | ||||||||||
Service fees and charges | 1,169 | 1,224 | (4) % | 1,072 | 9 % | |||||
Bank card fees | 1,454 | 1,519 | (4) | 1,306 | 11 | |||||
Gain on sale of loans, net | 299 | 376 | (20) | 1,168 | (74) | |||||
Income from bank-owned life insurance | 214 | 219 | (2) | 225 | (5) | |||||
Gain (loss) on sale of assets, net | 5 | (44) | 111 | — | — | |||||
Other income | 249 | 240 | 4 | 289 | (14) | |||||
Total noninterest income | 3,390 | 3,534 | (4) | 4,060 | (17) | |||||
Noninterest Expense | ||||||||||
Compensation and benefits | 10,159 | 9,991 | 2 % | 9,664 | 5 % | |||||
Occupancy | 1,803 | 1,824 | (1) | 1,696 | 6 | |||||
Marketing and advertising | 407 | 1,033 | (61) | 171 | 138 | |||||
Data processing and communication | 2,195 | 2,237 | (2) | 1,986 | 11 | |||||
Professional fees | 542 | 493 | 10 | 234 | 132 | |||||
Forms, printing and supplies | 146 | 164 | (11) | 159 | (8) | |||||
Franchise and shares tax | 391 | 396 | (1) | 360 | 9 | |||||
Regulatory fees | 446 | 331 | 35 | 379 | 18 | |||||
Foreclosed assets, net | 402 | 155 | 159 | 123 | 227 | |||||
Amortization of acquisition intangible | 252 | 279 | (10) | 300 | (16) | |||||
Provision for credit losses on unfunded commitments | 302 | 15 | 1913 | — | — | |||||
Other expenses | 1,195 | 1,099 | 9 | 894 | 34 | |||||
Total noninterest expense | 18,240 | 18,017 | 1 | 15,966 | 14 | |||||
Income before income tax expense | 5,442 | 12,815 | (58) | 14,892 | (63) | |||||
Income tax expense | 1,041 | 2,577 | (60) | 2,964 | (65) | |||||
Net income | $ 4,401 | $ 10,238 | (57) | $ 11,928 | (63) | |||||
Earnings per share - basic | $ 0.53 | $ 1.24 | (57) % | $ 1.41 | (62) % | |||||
Earnings per share - diluted | $ 0.53 | $ 1.23 | (57) % | $ 1.41 | (62) % | |||||
Cash dividends declared per common share | $ 0.23 | $ 0.23 | — % | $ 0.22 | 5 % | |||||
HOME BANCORP, INC. AND SUBSIDIARY | ||||||||||
SUMMARY FINANCIAL INFORMATION | ||||||||||
(Unaudited) | ||||||||||
Quarter Ended | ||||||||||
(dollars in thousands, except per share data) | 3/31/2022 | 12/31/2021 | % | 3/31/2021 | % | |||||
EARNINGS DATA | ||||||||||
Total interest income | $ 24,562 | $ 25,788 | (5) % | $ 26,928 | (9) % | |||||
Total interest expense | 1,055 | 1,138 | (7) | 1,833 | (42) | |||||
Net interest income | 23,507 | 24,650 | (5) | 25,095 | (6) | |||||
(Reversal) provision for loan losses | 3,215 | (2,648) | 221 | (1,703) | 289 | |||||
Total noninterest income | 3,390 | 3,534 | (4) | 4,060 | (17) | |||||
Total noninterest expense | 18,240 | 18,017 | 1 | 15,966 | 14 | |||||
Income tax expense | 1,041 | 2,577 | (60) | 2,964 | (65) | |||||
Net income | $ 4,401 | $ 10,238 | (57) | $ 11,928 | (63) | |||||
AVERAGE BALANCE SHEET DATA | ||||||||||
Total assets | $ 2,977,559 | $ 2,941,274 | 1 % | $ 2,620,664 | 14 % | |||||
Total interest-earning assets | 2,783,614 | 2,749,445 | 1 | 2,432,327 | 14 | |||||
Total loans | 1,862,616 | 1,856,814 | — | 1,987,264 | (6) | |||||
PPP loans | 31,326 | 67,198 | (53) | 238,813 | (87) | |||||
Total interest-bearing deposits | 1,779,832 | 1,729,341 | 3 | 1,593,434 | 12 | |||||
Total interest-bearing liabilities | 1,811,166 | 1,761,052 | 3 | 1,627,564 | 11 | |||||
Total deposits | 2,576,378 | 2,537,670 | 2 | 2,241,918 | 15 | |||||
Total shareholders' equity | 351,337 | 348,635 | 1 | 326,829 | 7 | |||||
PER SHARE DATA | ||||||||||
Earnings per share - basic | $ 0.53 | $ 1.24 | (57) % | $ 1.41 | (62) % | |||||
Earnings per share - diluted | 0.53 | 1.23 | (57) | 1.41 | (62) | |||||
Book value at period end | 39.93 | 41.27 | (3) | 37.73 | 6 | |||||
Tangible book value at period end | 29.57 | 34.00 | (13) | 30.52 | (3) | |||||
Shares outstanding at period end | 8,453,014 | 8,526,907 | (1) | 8,709,631 | (3) | |||||
Weighted average shares outstanding | ||||||||||
Basic | 8,270,209 | 8,278,472 | — % | 8,436,624 | (2) % | |||||
Diluted | 8,336,561 | 8,331,749 | — | 8,476,445 | (2) | |||||
SELECTED RATIOS (1) | ||||||||||
Return on average assets | 0.60 % | 1.38 % | (57) % | 1.85 % | (68) % | |||||
Return on average equity | 5.08 | 11.65 | (56) | 14.80 | (66) | |||||
Common equity ratio | 10.13 | 11.98 | (15) | 12.14 | (17) | |||||
Efficiency ratio (2) | 67.81 | 63.93 | 6 | 54.76 | 24 | |||||
Average equity to average assets | 11.80 | 11.85 | — | 12.47 | (5) | |||||
Tier 1 leverage capital ratio (3) | 8.62 | 9.77 | (12) | 9.89 | (13) | |||||
Total risk-based capital ratio (3) | 11.83 | 15.85 | (25) | 15.37 | (23) | |||||
Net interest margin (4) | 3.39 | 3.53 | (4) | 4.14 | (18) | |||||
SELECTED NON-GAAP RATIOS (1) | ||||||||||
Tangible common equity ratio (5) | 7.70 % | 10.08 % | (24) % | 10.05 % | (23) % | |||||
Return on average tangible common equity (6) | 6.47 | 14.48 | (55) | 18.70 | (65) | |||||
(1) | With the exception of end-of-period ratios, all ratios are based on average daily balances during the respective periods. |
(2) | The efficiency ratio represents noninterest expense as a percentage of total revenues. Total revenues is the sum of net interest income and noninterest income. |
(3) | Capital ratios are preliminary end-of-period ratios for the Bank only and are subject to change. |
(4) | Net interest margin represents net interest income as a percentage of average interest-earning assets. Taxable equivalent yields are calculated using a marginal tax rate of 21%. |
(5) | Tangible common equity ratio is common shareholders' equity less intangible assets divided by total assets less intangible assets. See "Non-GAAP Reconciliation" for additional information. |
(6) | Return on average tangible common equity is net income plus amortization of core deposit intangible, net of taxes, divided by average common shareholders' equity less average intangible assets. See "Non-GAAP Reconciliation" for additional information. |
HOME BANCORP, INC. AND SUBSIDIARY | ||||||||||||||||||
SUMMARY CREDIT QUALITY INFORMATION | ||||||||||||||||||
(Unaudited) | ||||||||||||||||||
3/31/2022 | 12/31/2021 | 3/31/2021 | ||||||||||||||||
(dollars in thousands) | Originated | Acquired | Total | Originated | Acquired | Total | Originated | Acquired | Total | |||||||||
CREDIT QUALITY (1) | ||||||||||||||||||
Nonaccrual loans(2) | $ 5,515 | $ 15,598 | $ 21,113 | $ 7,233 | $ 6,036 | $ 13,269 | $ 8,735 | $ 6,958 | $ 15,693 | |||||||||
Accruing loans 90 days or more past due | — | — | — | 6 | — | 6 | — | — | — | |||||||||
Total nonperforming loans | 5,515 | 15,598 | 21,113 | 7,239 | 6,036 | 13,275 | 8,735 | 6,958 | 15,693 | |||||||||
Foreclosed assets and ORE | 536 | 729 | 1,265 | 1,109 | 80 | 1,189 | 1,082 | 499 | 1,581 | |||||||||
Total nonperforming assets | 6,051 | 16,327 | 22,378 | 8,348 | 6,116 | 14,464 | 9,817 | 7,457 | 17,274 | |||||||||
Performing troubled debt restructurings | 3,797 | 1,100 | 4,897 | 3,867 | 1,096 | 4,963 | 2,042 | 971 | 3,013 | |||||||||
Total nonperforming assets and troubled debt restructurings | $ 9,848 | $ 17,427 | $ 27,275 | $ 12,215 | $ 7,212 | $ 19,427 | $ 11,859 | $ 8,428 | $ 20,287 | |||||||||
Nonperforming assets to total assets | 0.67 % | 0.49 % | 0.64 % | |||||||||||||||
Nonperforming loans to total assets | 0.63 | 0.45 | 0.58 | |||||||||||||||
Nonperforming loans to total loans | 0.98 | 0.72 | 0.79 | |||||||||||||||
(1) | It is our policy to cease accruing interest on loans 90 days or more past due, with certain limited exceptions. Nonperforming assets consist of nonperforming loans, foreclosed assets and surplus real estate (ORE). Foreclosed assets consist of assets acquired through foreclosure or acceptance of title in-lieu of foreclosure. ORE consists of closed or unused bank buildings. |
(2) | Nonaccrual loans include originated restructured loans placed on nonaccrual totaling $3.6 million, $3.7 million and $5.0 million at March 31, 2022, December 31, 2021 and March 31, 2021, respectively. Acquired restructured loans placed on nonaccrual totaled $3.0 million, $3.5 million and $3.7 million at March 31, 2022, December 31, 2021 and March 31, 2021, respectively. |
HOME BANCORP, INC. AND SUBSIDIARY | ||||||||||||||||||
SUMMARY CREDIT QUALITY INFORMATION - CONTINUED | ||||||||||||||||||
(Unaudited) | ||||||||||||||||||
3/31/2022 | 12/31/2021 | 3/31/2021 | ||||||||||||||||
Collectively | Individually | Total | Collectively | Individually | Total | Collectively | Individually | Total | ||||||||||
ALLOWANCE FOR CREDIT LOSSES | ||||||||||||||||||
One- to four-family first mortgage | $ 2,056 | $ — | $ 2,056 | $ 1,944 | $ — | $ 1,944 | $ 2,779 | $ 100 | $ 2,879 | |||||||||
Home equity loans and lines | 539 | — | 539 | 508 | — | 508 | 649 | — | 649 | |||||||||
Commercial real estate | 12,878 | 2,324 | 15,202 | 10,207 | 247 | 10,454 | 16,191 | 333 | 16,524 | |||||||||
Construction and land | 4,112 | — | 4,112 | 3,572 | — | 3,572 | 4,448 | — | 4,448 | |||||||||
Multi-family residential | 554 | — | 554 | 457 | — | 457 | 967 | — | 967 | |||||||||
Commercial and industrial | 3,200 | 440 | 3,640 | 3,095 | 425 | 3,520 | 3,521 | 234 | 3,755 | |||||||||
Consumer | 628 | — | 628 | 634 | — | 634 | 771 | — | 771 | |||||||||
Total allowance for credit losses | $ 23,967 | $ 2,764 | $ 26,731 | $ 20,417 | $ 672 | $ 21,089 | $ 29,326 | $ 667 | $ 29,993 | |||||||||
Unfunded lending commitments(3) | 2,117 | — | 2,117 | 1,815 | — | 1,815 | 1,425 | — | 1,425 | |||||||||
Total allowance for credit losses | $ 26,084 | $ 2,764 | $ 28,848 | $ 22,232 | $ 672 | $ 22,904 | $ 30,751 | $ 667 | $ 31,418 | |||||||||
Allowance for loan losses to nonperforming assets | 119.45 | 145.80 | 173.63 | |||||||||||||||
Allowance for loan losses to nonperforming loans | 126.61 | 158.86 | 191.12 | |||||||||||||||
Allowance for loan losses to total loans | 1.24 | 1.15 | 1.51 | |||||||||||||||
Allowance for credit losses to total loans | 1.34 | 1.24 | 1.59 | |||||||||||||||
Year-to-date loan charge-offs | $ 316 | $ 2,305 | $ 1,330 | |||||||||||||||
Year-to-date loan recoveries | 465 | 592 | 63 | |||||||||||||||
Year-to-date net loan recoveries (charge-offs) | $ (149) | $ 1,713 | $ 1,267 | |||||||||||||||
Annualized YTD net loan recoveries (charge-offs) to average loans | (0.03) % | 0.09 % | 0.26 % | |||||||||||||||
(3) | The allowance for unfunded lending commitments is recorded within accrued interest payable and other liabilities on the Consolidated Statements of Financial Condition. |
SOURCE Home Bancorp, Inc.





Share this article