Operating Results For Fourth Quarter And 2014 Announced By Realty Income

SAN DIEGO, Feb. 17, 2015 /PRNewswire/ -- Realty Income Corporation (Realty Income) (NYSE: O), The Monthly Dividend Company®, today announced operating results for the fourth quarter ended December 31, 2014. Access to this document is available at www.realtyincome.com. All per share amounts presented in this press release are on a diluted per common share basis unless stated otherwise.
COMPANY HIGHLIGHTS:
For the quarter ended December 31, 2014 (as compared to the same quarterly period in 2013):
- Revenue increased 14.5% to $247.6 million as compared to $216.2 million
- Net income available to common stockholders per share was $0.32
- FFO available to common stockholders increased 15.3% to $143.7 million
- FFO per share increased 4.9% to $0.64
- AFFO available to common stockholders increased 15.7% to $145.4 million
- AFFO per share increased 4.8% to $0.65
- Same store rents increased 1.7%
- Portfolio occupancy increased to 98.4% from 98.2%
- Invested $158.0 million in 82 new properties and properties under development or expansion
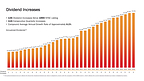
- Increased the monthly dividend in December for the 78th time and for the 69th consecutive quarter
- Dividends paid per common share increased 0.5%
For the year ended December 31, 2014 (as compared to 2013):
- Revenue increased 19.6% to $933.5 million as compared to $780.2 million
- Net income available to common stockholders per share was $1.04
- FFO available to common stockholders increased 21.8% to $562.9 million
- FFO per share increased 7.1% to $2.58
- AFFO available to common stockholders increased 21.3% to $561.7 million
- AFFO per share increased 6.6% to $2.57
- Same store rents increased 1.5%
- Invested $1.4 billion in 506 new properties and properties under development or expansion
- Dividends paid per common share increased 2.1%
- Raised gross proceeds of $1.3 billion in permanent and long-term capital to fund real estate acquisitions
Event subsequent to December 31, 2014:
- Increased the annualized dividends paid per common share by 3.0% from $2.201 to $2.268 in January 2015
CEO Comments on Operating Results
"We are pleased to report excellent operating performance for the fourth quarter and for 2014 with AFFO per share increasing by 4.8% to $0.65 during the quarter, and 6.6% to $2.57 during the year," said John P. Case, Realty Income's Chief Executive Officer. "This earnings growth allowed us to increase dividends paid per share by 2.1% in 2014, and another 3.0% this month. Our company was recognized in January 2015 for its track record of outstanding, long-term dividend growth. Realty Income was added to the exclusive S&P High Yield Dividend Aristocrats® index for increasing our dividend every year for 20 years."
"During the year, we completed $1.4 billion in acquisitions, which makes this our second most acquisitive year in the company's history. These properties had an attractive initial average lease yield of 7.1% and weighted average remaining lease term of 12.8 years. We continued to remain selective in our investment activity, acquiring 5.8% of the $24.3 billion of sourced acquisitions opportunities during the year. We funded the 2014 investments by issuing $1.3 billion in permanent and long-term capital, of which more than half was equity. Additionally, as of February 13, 2015, we have approximately $1.12 billion available on our credit facility to fund future acquisitions. Given the healthy volume of acquisitions opportunities we are currently seeing, we are raising our acquisitions guidance for 2015 from $500 million - $800 million to $700 million - $1 billion."
"Our existing portfolio of over 4,300 properties continues to perform well. In 2014, we experienced one of our most active years for lease rollover. We re-leased 203 properties with expiring leases to either existing or new tenants, recapturing 99.3% of expiring rent. We realized same store rent increases of 1.7% for the fourth quarter and 1.5% for 2014. We also sold 46 properties for $107 million realizing a 6.9% cap rate on the leased properties sold and an 11.6% unlevered internal rate of return on all properties sold. Our proactive approach to portfolio management resulted in occupancy increasing to 98.4% at the end of 2014, the highest it's been since 2007."
Financial Results
Revenue
Revenue for the quarter ended December 31, 2014 increased 14.5% to $247.6 million, as compared to $216.2 million for the same quarter in 2013. Revenue for 2014 increased 19.6% to $933.5 million, as compared to $780.2 million for 2013.
Net Income Available to Common Stockholders
Net income available to common stockholders for the quarter ended December 31, 2014 was $71.0 million, as compared to $53.9 million for the same quarter in 2013. Net income per share for the quarter ended December 31, 2014 was $0.32, as compared to $0.26 for the same quarter in 2013.
Net income available to common stockholders for 2014 was $227.6 million, as compared to $203.6 million for 2013. Net income per share in 2014 was $1.04, as compared to $1.06 for 2013.
Net income available to common stockholders per share for 2014 was impacted by a $6.0 million non-cash redemption charge on the shares of the 6.75% Monthly Income Class E Cumulative Redeemable Preferred Stock, or Class E preferred stock, that were redeemed in October 2014, which represents $0.03 net income per share. This charge is for the excess in redemption value over the carrying value of the Class E preferred stock and represents the original issuance cost that was paid in 2006. Net income available to common stockholders for 2013 was impacted by an unusually large gain on sale of real estate, which represented $0.18 per share.
The calculation to determine net income for a real estate company includes impairments and/or gains on property sales. Impairments and/or gains on property sales vary from quarter to quarter. This variance can significantly impact net income and period to period comparisons.
Funds From Operations (FFO) Available to Common Stockholders
FFO for the quarter ended December 31, 2014 increased 15.3% to $143.7 million, as compared to $124.6 million for the same quarter in 2013. FFO per share for the quarter ended December 31, 2014 increased 4.9% to $0.64, as compared to $0.61 for the same quarter in 2013.
FFO for 2014 increased 21.8% to $562.9 million, as compared to $462.0 million for the same period in 2013. FFO per share in 2014 increased 7.1% to $2.58, as compared to $2.41 for 2013.
FFO per share for 2014 was impacted by a $6.0 million non-cash redemption charge on the Class E preferred shares that were redeemed in October 2014, which represents $0.03 per share.
Adjusted Funds From Operations (AFFO) Available to Common Stockholders
AFFO for the quarter ended December 31, 2014 increased 15.7% to $145.4 million, as compared to $125.7 million for the same quarter in 2013. AFFO per share for the quarter ended December 31, 2014 increased 4.8% to $0.65, as compared to $0.62 for the same quarter in 2013.
AFFO for 2014 increased 21.3% to $561.7 million, as compared to $463.1 million for 2013. AFFO per share for 2014 increased 6.6% to $2.57, as compared to $2.41 for 2013.
The company considers FFO and AFFO to be appropriate supplemental measures of a Real Estate Investment Trust's (REIT's) operating performance. Realty Income defines FFO consistent with the National Association of Real Estate Investment Trust's (NAREIT's) definition, as net income available to common stockholders, plus depreciation and amortization of real estate assets, plus impairments of real estate, reduced by gains on sales of investment properties and extraordinary items. FFO for the quarter and year ended December 31, 2013 has also been normalized to add back merger-related costs for the acquisition of ARCT. AFFO further adjusts FFO for unique revenue and expense items, which the company believes are not as pertinent to the measurement of the company's ongoing operating performance. See the reconciliation of net income available to common stockholders to FFO and AFFO on page six.
Dividend Information
In December 2014, Realty Income announced the 69th consecutive quarterly dividend increase, which is the 78th increase in the amount of the dividend since the company's listing on the New York Stock Exchange in 1994. The annualized dividend amount, as of December 31, 2014, was approximately $2.201 per share. The amount of monthly dividends paid per share increased 2.1% to $2.192 in 2014 compared to $2.147 per share in 2013. In addition, through December 31, 2014, the company has paid 533 consecutive monthly dividends and over $3.2 billion in total dividends since 1969. Realty Income has a dividend reinvestment and stock purchase program that can be accessed at www.realtyincome.com. The program is administered by Wells Fargo Shareowner Services.
Real Estate Portfolio Update
As of December 31, 2014, Realty Income's portfolio of freestanding, single-tenant properties consisted of 4,327 properties located in 49 states and Puerto Rico, leased to 234 commercial tenants doing business in 47 industries. The properties are leased under long-term, net leases with a weighted average remaining lease term of approximately 10.2 years.
Portfolio Management Activities
The company's portfolio of commercial real estate, owned primarily under 10- to 20-year net leases, continues to perform well and provide dependable lease revenue supporting the payment of monthly dividends. As of December 31, 2014, portfolio occupancy was 98.4% with 70 properties available for lease out of a total of 4,327 properties in the portfolio, as compared to 98.2% portfolio occupancy, or 70 properties available for lease, as of December 31, 2013.
Since September 30, 2014, when we reported 74 properties available for lease, we had 54 lease expirations, re-leased 50 properties and sold eight vacant properties. Of the 50 properties re-leased during the fourth quarter of 2014, 40 properties were re-leased to existing tenants without vacancy, four were re-leased to new tenants without vacancy, and six were re-leased to a new tenant after a period of vacancy. The annual new rent on these re-leases was $5.3 million, as compared to the previous rent of $5.4 million on these same properties.
Rent Increases
During the quarter ended December 31, 2014, same store rents on 2,728 properties under lease increased 1.7% to $129.9 million, as compared to $127.7 million for the same quarter in 2013. During 2014, same store rents on 2,728 properties under lease increased 1.5% to $513.4 million, as compared to $505.7 million for 2013.
Property Acquisitions
During the fourth quarter of 2014, Realty Income invested $158.0 million in 82 new properties and properties under development or expansion, located in 26 states. These properties are 100% leased with a weighted average lease term of approximately 14.6 years and an initial average lease yield of 7.1%. The tenants occupying the new properties operate in 19 industries, and the property types consist of 87.3% retail and 12.7% industrial and distribution, based on rental revenue. Approximately 32% of the revenue generated from acquisitions during the fourth quarter of 2014 is from investment grade tenants.
During 2014, Realty Income invested approximately $1.4 billion in 506 new properties and properties under development or expansion. The new properties are located in 42 states and are 100% leased with a weighted average lease term of approximately 12.8 years and an initial average lease yield of 7.1%. The tenants occupying the new properties operate in 32 industries, and the property types consist of 85.7% retail, 6.6% industrial and distribution, 6.4% office, and 1.3% manufacturing, based on rental revenue. Approximately 66% of the revenue generated from the 2014 acquisitions is from investment grade tenants.
Realty Income maintains a $1.5 billion unsecured acquisition credit facility, which is used to fund property acquisitions in the near term. As of December 31, 2014, $1.28 billion was available on the credit facility to fund additional acquisitions.
Property Dispositions
During the quarter ended December 31, 2014, Realty Income sold 18 properties for $53.7 million, with a gain on sales of $25.3 million, as compared to 22 properties sold for $28.0 million, with a gain on sales of $14.3 million, during the same quarter in 2013.
During 2014, Realty Income sold 46 properties for $107.2 million, with a gain on sales of $42.1 million, as compared to 75 properties sold for $134.2 million, with a gain on sales of $64.7 million, during 2013.
Other Recent Activities
2015 Dividend Increase
In January 2015, Realty Income increased the amount of the annualized dividend by 3.0%. The new dividend represents an annualized dividend of $2.268 per share, as compared to the prior annualized dividend amount of $2.201 per share. The new monthly dividend amount of $0.189 was paid on February 17, 2015 to shareholders of record on February 2, 2015.
Redeemed All Outstanding Shares of 6.75% Monthly Income Class E Preferred Stock in October 2014
In October 2014, Realty Income redeemed all 8,800,000 outstanding shares of our Class E preferred stock. The shares were redeemed at $25 per share (par), plus accrued and unpaid dividends to the redemption date of October 24, 2014.
Direct Stock Purchase and Dividend Reinvestment Plan Activities
During the fourth quarter of 2014, Realty Income issued 2,236,294 common shares via its Stock Plan, generating gross proceeds of approximately $101.9 million. For 2014, Realty Income issued 3,527,166 common shares via its Stock Plan, generating gross proceeds of approximately $158.5 million.
FFO and AFFO Commentary
Realty Income's FFO and AFFO per share has historically tended to be stable and fairly predictable because of the long-term leases that are the primary source of the company's revenue. There are, however, several factors that can cause FFO and AFFO per share to vary from levels that have been anticipated by the company. These factors include, but are not limited to, changes in interest rates and occupancy rates, periodically accessing the capital markets, the level and timing of property and entity acquisitions and dispositions, lease rollovers, the general real estate market, and the economy.
2015 Earnings Estimates
FFO per share for 2015 should range from $2.67 to $2.72 per share, an increase of 3.5% to 5.4% over 2014 FFO per share of $2.58. FFO per share for 2015 is based on a net income per share range of $0.97 to $1.02, plus estimated real estate depreciation of $1.77 per share, and reduced by potential estimated gains on sales of investment properties of $0.07 per share (in accordance with NAREIT's definition of FFO).
AFFO per share for 2015 should range from $2.66 to $2.71 per share, an increase of 3.5% to 5.4% over the 2014 AFFO per share of $2.57. AFFO further adjusts FFO for unique revenue and expense items, which are not as pertinent to the measurement of the company's ongoing operating performance.
Conference Call Information
In conjunction with Realty Income's quarterly results, the company will host a conference call on February 18, 2015 at 11:30 a.m. PST to discuss the operating results. To access the conference, dial (888) 505-4375. When prompted, provide the access code: 1871553. Shareholders may also access a telephone replay of the conference call by calling (888) 203-1112 and entering the access code: 1871553. The telephone replay will be available through March 4, 2015. A live webcast will be available in listen-only mode by clicking on the webcast link at www.realtyincome.com. A replay of the conference call webcast will be available approximately two hours after the conclusion of the live broadcast. The webcast replay will be available through March 4, 2015. No access code is required for this replay.
About Realty Income
Realty Income is The Monthly Dividend Company®, a New York Stock Exchange real estate company dedicated to providing shareholders with dependable monthly income. As of December 31, 2014, the company had paid 533 consecutive monthly dividends throughout its 46-year operating history. The monthly income is supported by the cash flows from over 4,300 properties owned under long-term lease agreements with 234 leading regional and national commercial tenants. The company is an active buyer of net-leased properties nationwide. Additional information about the company can be obtained from the corporate website at www.realtyincome.com or www.twitter.com/realtyincome.
Forward-Looking Statements
Statements in this press release that are not strictly historical are "forward-looking" statements. Forward-looking statements involve known and unknown risks, which may cause the company's actual future results to differ materially from expected results. These risks include, among others, general economic conditions, local real estate conditions, tenant financial health, the availability of capital to finance planned growth, continued volatility and uncertainty in the credit markets and broader financial markets, property acquisitions and the timing of these acquisitions, charges for property impairments, and the outcome of any legal proceedings to which the company is a party, as described in the company's filings with the Securities and Exchange Commission. Consequently, forward-looking statements should be regarded solely as reflections of the company's current operating plans and estimates. Actual operating results may differ materially from what is expressed or forecast in this press release. The company undertakes no obligation to publicly release the results of any revisions to these forward-looking statements that may be made to reflect events or circumstances after the date these statements were made.
| CONSOLIDATED STATEMENTS OF INCOME |
|||||||||||||||||||
| (dollars in thousands, except per share amounts) |
|||||||||||||||||||
| Three Months |
Three Months |
Twelve Months |
Twelve Months |
||||||||||||||||
| Ended 12/31/14 |
Ended 12/31/13 |
Ended 12/31/14 |
Ended 12/31/13 |
||||||||||||||||
| REVENUE |
(unaudited) |
||||||||||||||||||
| Rental |
$ |
230,635 |
$ |
204,999 |
$ |
893,457 |
$ |
748,218 |
|||||||||||
| Tenant reimbursements |
16,246 |
9,324 |
37,118 |
24,944 |
|||||||||||||||
| Other |
692 |
1,840 |
2,930 |
7,047 |
|||||||||||||||
| Total revenue |
247,573 |
216,163 |
933,505 |
780,209 |
|||||||||||||||
| EXPENSES |
|||||||||||||||||||
| Depreciation and amortization |
96,537 |
85,293 |
374,661 |
306,769 |
|||||||||||||||
| Interest |
59,120 |
50,775 |
216,366 |
181,442 |
|||||||||||||||
| General and administrative |
15,586 |
16,525 |
51,085 |
56,881 |
|||||||||||||||
| Property (including reimbursable) |
20,397 |
13,059 |
53,871 |
38,851 |
|||||||||||||||
| Income taxes |
1,103 |
579 |
3,461 |
2,350 |
|||||||||||||||
| Provisions for impairment |
1,450 |
- |
4,126 |
290 |
|||||||||||||||
| Merger-related costs |
- |
138 |
- |
13,013 |
|||||||||||||||
| Total expenses |
194,193 |
166,369 |
703,570 |
599,596 |
|||||||||||||||
| Gain on sales of real estate |
24,994 |
- |
39,205 |
- |
|||||||||||||||
| Income from continuing operations |
78,374 |
49,794 |
269,140 |
180,613 |
|||||||||||||||
| Income (loss) from discontinued operations |
(297) |
14,840 |
2,800 |
65,670 |
|||||||||||||||
| Net income |
78,077 |
64,634 |
271,940 |
246,283 |
|||||||||||||||
| Net income attributable to noncontrolling interests |
(289) |
(298) |
(1,305) |
(719) |
|||||||||||||||
| Net income attributable to the Company |
77,788 |
64,336 |
270,635 |
245,564 |
|||||||||||||||
| Preferred stock dividends |
(6,770) |
(10,482) |
(37,062) |
(41,930) |
|||||||||||||||
| Excess of redemption value over carrying value of |
|||||||||||||||||||
| preferred shares redeemed |
- |
- |
(6,015) |
- |
|||||||||||||||
| Net income available to common stockholders |
$ |
71,018 |
$ |
53,854 |
$ |
227,558 |
$ |
203,634 |
|||||||||||
| Funds from operations available to |
|||||||||||||||||||
| common stockholders (FFO) |
$ |
143,706 |
$ |
124,630 |
$ |
562,889 |
$ |
462,030 |
|||||||||||
| Adjusted funds from operations available to |
|||||||||||||||||||
| common stockholders (AFFO) |
$ |
145,394 |
$ |
125,700 |
$ |
561,661 |
$ |
463,139 |
|||||||||||
| Per share information for common stockholders: |
|||||||||||||||||||
| Income from continuing operations, |
|||||||||||||||||||
| basic and diluted |
$ |
0.32 |
$ |
0.19 |
$ |
1.03 |
$ |
0.72 |
|||||||||||
| Net income, basic and diluted |
$ |
0.32 |
$ |
0.26 |
$ |
1.04 |
$ |
1.06 |
|||||||||||
| FFO, basic and diluted |
$ |
0.64 |
$ |
0.61 |
$ |
2.58 |
$ |
2.41 |
|||||||||||
| AFFO: |
|||||||||||||||||||
| Basic |
$ |
0.65 |
$ |
0.62 |
$ |
2.57 |
$ |
2.42 |
|||||||||||
| Diluted |
$ |
0.65 |
$ |
0.62 |
$ |
2.57 |
$ |
2.41 |
|||||||||||
| Cash dividends paid per common share |
$ |
0.549 |
$ |
0.546 |
$ |
2.192 |
$ |
2.147 |
|||||||||||
| FUNDS FROM OPERATIONS (FFO) |
|||||||||||||||||
| (dollars in thousands, except per share amounts) |
| We define FFO, a non-GAAP measure, consistent with the National Association of Real Estate Investment Trust's definition, as net income available to common stockholders, plus depreciation and amortization of real estate assets, plus impairments of real estate assets, reduced by gains on sales of investment properties and extraordinary items. (1) |
| Three Months |
Three Months |
Year |
Year |
||||||||||||||
| Ended 12/31/14 |
Ended 12/31/13 |
Ended 12/31/14 |
Ended 12/31/13 |
||||||||||||||
| Net income available to common stockholders |
$ |
71,018 |
$ |
53,854 |
$ |
227,558 |
$ |
203,634 |
|||||||||
| Depreciation and amortization: |
|||||||||||||||||
| Continuing operations |
96,537 |
85,293 |
374,661 |
306,769 |
|||||||||||||
| Discontinued operations |
- |
36 |
- |
1,626 |
|||||||||||||
| Depreciation of furniture, fixtures and equipment |
(161) |
(86) |
(482) |
(288) |
|||||||||||||
| Provisions for impairment on investment properties: |
|||||||||||||||||
| Continuing operations |
1,450 |
- |
4,126 |
290 |
|||||||||||||
| Discontinued operations |
510 |
- |
510 |
2,738 |
|||||||||||||
| Gain on sale of investment properties: |
|||||||||||||||||
| Continuing operations |
(24,994) |
- |
(39,205) |
- |
|||||||||||||
| Discontinued operations |
(276) |
(14,276) |
(2,883) |
(64,743) |
|||||||||||||
| Merger-related costs (1) |
- |
138 |
- |
13,013 |
|||||||||||||
| FFO adjustments allocable to noncontrolling interests |
(378) |
(329) |
(1,396) |
(1,009) |
|||||||||||||
| FFO available to common stockholders |
$ |
143,706 |
$ |
124,630 |
$ |
562,889 |
$ |
462,030 |
|||||||||
| FFO per common share, basic and diluted |
$ |
0.64 |
$ |
0.61 |
$ |
2.58 |
$ |
2.41 |
|||||||||
| Distributions paid to common stockholders |
$ |
122,521 |
$ |
110,678 |
$ |
479,256 |
$ |
409,222 |
|||||||||
| FFO in excess of distributions paid to |
|||||||||||||||||
| common stockholders |
$ |
21,185 |
$ |
13,952 |
$ |
83,633 |
$ |
52,808 |
|||||||||
| Weighted average number of common shares used for FFO: |
|||||||||||||||||
| Basic |
223,034,266 |
203,303,124 |
218,390,885 |
191,754,857 |
|||||||||||||
| Diluted |
223,262,633 |
203,326,838 |
218,450,863 |
191,781,622 |
|||||||||||||
| (1) |
FFO for the three and twelve months ended December 31, 2013, has been normalized to exclude ARCT merger-related costs. |
||||||||||||||||
| ADJUSTED FUNDS FROM OPERATIONS (AFFO) |
|||||||||||||||||
| (dollars in thousands, except per share amounts) |
| We define AFFO as FFO adjusted for unique revenue and expense items, which the company believes are not as pertinent to the measurement of the company's ongoing operating performance. Most companies in our industry use a similar measurement to AFFO, but they may use the term "CAD" (for Cash Available for Distribution) or "FAD" (for Funds Available for Distribution). |
| Three Months |
Three Months |
Year |
Year |
||||||||||||||
| Ended 12/31/14 |
Ended 12/31/13 |
Ended 12/31/14 |
Ended 12/31/13 |
||||||||||||||
| Net income available to common stockholders |
$ |
71,018 |
$ |
53,854 |
$ |
227,558 |
$ |
203,634 |
|||||||||
| Cumulative adjustments to calculate FFO (1) |
72,688 |
70,776 |
335,331 |
258,396 |
|||||||||||||
| FFO available to common stockholders |
143,706 |
124,630 |
562,889 |
462,030 |
|||||||||||||
| Provisions for impairment on Crest properties |
- |
308 |
- |
308 |
|||||||||||||
| Excess of redemption value over carrying value |
|||||||||||||||||
| of Class E preferred share redemption |
- |
- |
6,015 |
- |
|||||||||||||
| Amortization of share-based compensation |
4,306 |
6,550 |
11,959 |
20,785 |
|||||||||||||
| Amortization of deferred financing costs (2) |
1,328 |
1,219 |
4,804 |
4,436 |
|||||||||||||
| Amortization of net mortgage premiums |
(2,147) |
(2,522) |
(9,208) |
(9,481) |
|||||||||||||
| (Gain) loss on early extinguishment of mortgage debt |
99 |
- |
(3,428) |
- |
|||||||||||||
| (Gain) loss on interest rate swaps |
940 |
(188) |
1,349 |
(878) |
|||||||||||||
| Capitalized leasing costs and commissions |
(167) |
(137) |
(821) |
(1,280) |
|||||||||||||
| Capitalized building improvements |
(1,328) |
(2,468) |
(5,210) |
(7,227) |
|||||||||||||
| Straight-line rent |
(3,108) |
(3,631) |
(14,872) |
(13,742) |
|||||||||||||
| Amortization of above and below-market leases |
1,650 |
1,939 |
8,024 |
8,188 |
|||||||||||||
| Other adjustments (3) |
115 |
- |
160 |
- |
|||||||||||||
| AFFO available to common stockholders |
$ |
145,394 |
$ |
125,700 |
$ |
561,661 |
$ |
463,139 |
|||||||||
| AFFO per common share: |
|||||||||||||||||
| Basic |
$ |
0.65 |
$ |
0.62 |
$ |
2.57 |
$ |
2.42 |
|||||||||
| Diluted |
$ |
0.65 |
$ |
0.62 |
$ |
2.57 |
$ |
2.41 |
|||||||||
| Distributions paid to common stockholders |
$ |
122,521 |
$ |
110,678 |
$ |
479,256 |
$ |
409,222 |
|||||||||
| AFFO in excess of distributions paid to |
|||||||||||||||||
| common stockholders |
$ |
22,873 |
$ |
15,022 |
$ |
82,405 |
$ |
53,917 |
|||||||||
| Weighted average number of common shares used for AFFO: |
|||||||||||||||||
| Basic |
223,034,266 |
203,303,124 |
218,390,885 |
191,754,857 |
|||||||||||||
| Diluted |
223,262,633 |
203,326,838 |
218,450,863 |
191,781,622 |
|||||||||||||
| (1) |
See FFO calculation above for reconciling items. |
||||||||||||||||
| (2) |
Includes the amortization of costs incurred and capitalized when our notes were issued in March 2003, November 2003, March 2005, September 2005, September 2006, September 2007, June 2010, June 2011, October 2012, July 2013, June 2014 and September 2014. Additionally, this includes the amortization of deferred financing costs incurred and capitalized in connection with our assumption of our mortgages payable and the issuance of our term loan. The deferred financing costs are being amortized over the lives of the respective mortgages and term loan. No costs associated with our credit facility agreements or annual fees paid to credit rating agencies have been included. |
||||||||||||||||
| (3) |
Includes adjustments allocable to both non-controlling interests and capital lease obligations. |
||||||||||||||||
| HISTORICAL FUNDS FROM OPERATIONS AND ADJUSTED FUNDS FROM OPERATIONS |
|||||||||||||||
| (dollars in thousands, except per share amounts) |
|||||||||||||||
| For the three months ended December 31, |
2014 |
2013 |
2012 |
2011 |
2010 |
||||||||||
| Net income available to common stockholders |
$ |
71,018 |
$ |
53,854 |
$ |
28,542 |
$ |
34,941 |
$ |
31,814 |
|||||
| Depreciation and amortization |
96,376 |
85,243 |
42,428 |
34,314 |
25,045 |
||||||||||
| Provisions for impairment on investment properties |
1,960 |
- |
4,472 |
27 |
42 |
||||||||||
| Gain on sales of investment properties |
(25,270) |
(14,276) |
(3,863) |
(1,205) |
(4,392) |
||||||||||
| Merger-related costs |
- |
138 |
2,404 |
- |
- |
||||||||||
| FFO adjustments allocable to noncontrolling interests |
(378) |
(329) |
- |
- |
- |
||||||||||
| FFO |
$ |
143,706 |
$ |
124,630 |
$ |
73,983 |
$ |
68,077 |
$ |
52,509 |
|||||
| FFO per diluted share |
$ |
0.64 |
$ |
0.61 |
$ |
0.56 |
$ |
0.51 |
$ |
0.47 |
|||||
| AFFO |
$ |
145,394 |
$ |
125,700 |
$ |
72,892 |
$ |
68,524 |
$ |
53,327 |
|||||
| AFFO per diluted share |
$ |
0.65 |
$ |
0.62 |
$ |
0.55 |
$ |
0.52 |
$ |
0.48 |
|||||
| Cash dividends paid per share |
$ |
0.549 |
$ |
0.546 |
$ |
0.454 |
$ |
0.436 |
$ |
0.432 |
|||||
| Weighted average diluted shares outstanding |
223,262,633 |
203,326,838 |
132,979,552 |
132,609,319 |
112,067,874 |
||||||||||
| For the year ended December 31, |
2014 |
2013 |
2012 |
2011 |
2010 |
||||||||||
| Net income available to common stockholders |
$ |
227,558 |
$ |
203,634 |
$ |
114,538 |
$ |
132,779 |
$ |
106,531 |
|||||
| Depreciation and amortization |
374,179 |
308,107 |
151,058 |
121,941 |
95,858 |
||||||||||
| Provisions for impairment on investment properties |
4,636 |
3,028 |
5,139 |
405 |
213 |
||||||||||
| Gain on sales of investment properties |
(42,088) |
(64,743) |
(9,873) |
(5,733) |
(8,676) |
||||||||||
| Merger-related costs |
- |
13,013 |
7,899 |
- |
- |
||||||||||
| FFO adjustments allocable to noncontrolling interests |
(1,396) |
(1,009) |
- |
- |
- |
||||||||||
| FFO |
$ |
562,889 |
$ |
462,030 |
$ |
268,761 |
$ |
249,392 |
$ |
193,926 |
|||||
| FFO per diluted share |
$ |
2.58 |
$ |
2.41 |
$ |
2.02 |
$ |
1.98 |
$ |
1.83 |
|||||
| AFFO |
$ |
561,661 |
$ |
463,139 |
$ |
274,183 |
$ |
253,372 |
$ |
197,256 |
|||||
| AFFO per diluted share |
$ |
2.57 |
$ |
2.41 |
$ |
2.06 |
$ |
2.01 |
$ |
1.86 |
|||||
| Cash dividends paid per share |
$ |
2.192 |
$ |
2.147 |
$ |
1.772 |
$ |
1.737 |
$ |
1.722 |
|||||
| Weighted average diluted shares outstanding |
218,450,863 |
191,781,622 |
132,884,933 |
126,189,399 |
105,942,721 |
||||||||||
| REALTY INCOME CORPORATION AND SUBSIDIARIES |
||||||
| CONSOLIDATED BALANCE SHEETS |
||||||
| December 31, 2014 and 2013 |
||||||
| (dollars in thousands, except per share data) |
||||||
| 2014 |
2013 |
|||||
| ASSETS |
||||||
| Real estate, at cost: |
||||||
| Land |
$ |
3,046,372 |
$ |
2,791,147 |
||
| Buildings and improvements |
8,107,199 |
7,108,328 |
||||
| Total real estate, at cost |
11,153,571 |
9,899,475 |
||||
| Less accumulated depreciation and amortization |
(1,386,871) |
(1,114,888) |
||||
| Net real estate held for investment |
9,766,700 |
8,784,587 |
||||
| Real estate held for sale, net |
14,840 |
12,022 |
||||
| Net real estate |
9,781,540 |
8,796,609 |
||||
| Cash and cash equivalents |
3,852 |
10,257 |
||||
| Accounts receivable, net |
64,386 |
39,323 |
||||
| Acquired lease intangible assets, net |
1,039,724 |
935,459 |
||||
| Goodwill |
15,470 |
15,660 |
||||
| Other assets, net |
107,650 |
127,133 |
||||
| Total assets |
$ |
11,012,622 |
$ |
9,924,441 |
||
| LIABILITIES AND EQUITY |
||||||
| Distributions payable |
$ |
43,675 |
$ |
41,452 |
||
| Accounts payable and accrued expenses |
123,287 |
102,511 |
||||
| Acquired lease intangible liabilities, net |
220,469 |
148,250 |
||||
| Other liabilities |
53,145 |
44,030 |
||||
| Line of credit payable |
223,000 |
128,000 |
||||
| Term loan |
70,000 |
70,000 |
||||
| Mortgages payable, net |
852,575 |
783,360 |
||||
| Notes payable, net |
3,785,372 |
3,185,480 |
||||
| Total liabilities |
5,371,523 |
4,503,083 |
||||
| Commitments and contingencies |
||||||
| Stockholders' equity: |
||||||
| Preferred stock and paid in capital, par value $0.01 per share, |
||||||
| 69,900,000 shares authorized, 16,350,000 shares issued and |
||||||
| outstanding as of December 31, 2014 and 25,150,000 shares issued |
||||||
| and outstanding as of December 31, 2013 |
395,378 |
609,363 |
||||
| Common stock and paid in capital, par value $0.01 per share, |
||||||
| 370,100,000 shares authorized, 224,881,192 shares issued and |
||||||
| outstanding as of December 31, 2014 and 207,485,073 shares issued |
||||||
| and outstanding at December 31, 2013 |
6,464,987 |
5,767,878 |
||||
| Distributions in excess of net income |
(1,246,964) |
(991,794) |
||||
| Total stockholders' equity |
5,613,401 |
5,385,447 |
||||
| Noncontrolling interests |
27,698 |
35,911 |
||||
| Total equity |
5,641,099 |
5,421,358 |
||||
| Total liabilities and equity |
$ |
11,012,622 |
$ |
9,924,441 |
||
| Realty Income Performance vs. Major Stock Indices |
||||||||||||||||||||||||||||||
| Equity |
NASDAQ |
|||||||||||||||||||||||||||||
| Realty Income |
REIT Index (1) |
DJIA |
S&P 500 |
Composite |
||||||||||||||||||||||||||
| Dividend |
Total |
Dividend |
Total |
Dividend |
Total |
Dividend |
Total |
Dividend |
Total |
|||||||||||||||||||||
| yield |
return (2) |
yield |
return (3) |
yield |
return (3) |
yield |
return (3) |
yield |
return (4) |
|||||||||||||||||||||
| 10/18 to 12/31/1994 |
10.5 |
% |
10.8 |
% |
7.7 |
% |
0.0 |
% |
2.9 |
% |
(1.6%) |
2.9 |
% |
(1.2%) |
0.5 |
% |
(1.7%) |
|||||||||||||
| 1995 |
8.3 |
% |
42.0 |
% |
7.4 |
% |
15.3 |
% |
2.4 |
% |
36.9 |
% |
2.3 |
% |
37.6 |
% |
0.6 |
% |
39.9 |
% |
||||||||||
| 1996 |
7.9 |
% |
15.4 |
% |
6.1 |
% |
35.3 |
% |
2.2 |
% |
28.9 |
% |
2.0 |
% |
23.0 |
% |
0.2 |
% |
22.7 |
% |
||||||||||
| 1997 |
7.5 |
% |
14.5 |
% |
5.5 |
% |
20.3 |
% |
1.8 |
% |
24.9 |
% |
1.6 |
% |
33.4 |
% |
0.5 |
% |
21.6 |
% |
||||||||||
| 1998 |
8.2 |
% |
5.5 |
% |
7.5 |
% |
(17.5%) |
1.7 |
% |
18.1 |
% |
1.3 |
% |
28.6 |
% |
0.3 |
% |
39.6 |
% |
|||||||||||
| 1999 |
10.5 |
% |
(8.7%) |
8.7 |
% |
(4.6%) |
1.3 |
% |
27.2 |
% |
1.1 |
% |
21.0 |
% |
0.2 |
% |
85.6 |
% |
||||||||||||
| 2000 |
8.9 |
% |
31.2 |
% |
7.5 |
% |
26.4 |
% |
1.5 |
% |
(4.7%) |
1.2 |
% |
(9.1%) |
0.3 |
% |
(39.3%) |
|||||||||||||
| 2001 |
7.8 |
% |
27.2 |
% |
7.1 |
% |
13.9 |
% |
1.9 |
% |
(5.5%) |
1.4 |
% |
(11.9%) |
0.3 |
% |
(21.1%) |
|||||||||||||
| 2002 |
6.7 |
% |
26.9 |
% |
7.1 |
% |
3.8 |
% |
2.6 |
% |
(15.0%) |
1.9 |
% |
(22.1%) |
0.5 |
% |
(31.5%) |
|||||||||||||
| 2003 |
6.0 |
% |
21.0 |
% |
5.5 |
% |
37.1 |
% |
2.3 |
% |
28.3 |
% |
1.8 |
% |
28.7 |
% |
0.6 |
% |
50.0 |
% |
||||||||||
| 2004 |
5.2 |
% |
32.7 |
% |
4.7 |
% |
31.6 |
% |
2.2 |
% |
5.6 |
% |
1.8 |
% |
10.9 |
% |
0.6 |
% |
8.6 |
% |
||||||||||
| 2005 |
6.5 |
% |
(9.2%) |
4.6 |
% |
12.2 |
% |
2.6 |
% |
1.7 |
% |
1.9 |
% |
4.9 |
% |
0.9 |
% |
1.4 |
% |
|||||||||||
| 2006 |
5.5 |
% |
34.8 |
% |
3.7 |
% |
35.1 |
% |
2.5 |
% |
19.0 |
% |
1.9 |
% |
15.8 |
% |
0.8 |
% |
9.5 |
% |
||||||||||
| 2007 |
6.1 |
% |
3.2 |
% |
4.9 |
% |
(15.7%) |
2.7 |
% |
8.8 |
% |
2.1 |
% |
5.5 |
% |
0.8 |
% |
9.8 |
% |
|||||||||||
| 2008 |
7.3 |
% |
(8.2%) |
7.6 |
% |
(37.7%) |
3.6 |
% |
(31.8%) |
3.2 |
% |
(37.0%) |
1.3 |
% |
(40.5%) |
|||||||||||||||
| 2009 |
6.6 |
% |
19.3 |
% |
3.7 |
% |
28.0 |
% |
2.6 |
% |
22.6 |
% |
2.0 |
% |
26.5 |
% |
1.0 |
% |
43.9 |
% |
||||||||||
| 2010 |
5.1 |
% |
38.6 |
% |
3.5 |
% |
27.9 |
% |
2.6 |
% |
14.0 |
% |
1.9 |
% |
15.1 |
% |
1.2 |
% |
16.9 |
% |
||||||||||
| 2011 |
5.0 |
% |
7.3 |
% |
3.8 |
% |
8.3 |
% |
2.8 |
% |
8.3 |
% |
2.3 |
% |
2.1 |
% |
1.3 |
% |
(1.8%) |
|||||||||||
| 2012 |
4.5 |
% |
20.1 |
% |
3.5 |
% |
19.7 |
% |
3.0 |
% |
10.2 |
% |
2.5 |
% |
16.0 |
% |
2.6 |
% |
15.9 |
% |
||||||||||
| 2013 |
5.8 |
% |
(1.8%) |
3.9 |
% |
2.9 |
% |
2.3 |
% |
29.6 |
% |
2.0 |
% |
32.4 |
% |
1.4 |
% |
38.3 |
% |
|||||||||||
| 2014 |
4.6 |
% |
33.7 |
% |
3.6 |
% |
28.0 |
% |
2.3 |
% |
10.0 |
% |
2.0 |
% |
13.7 |
% |
1.3 |
% |
13.4 |
% |
||||||||||
| Compounded Average Annual Total Return (5) |
17.1 |
% |
11.4 |
% |
10.3 |
% |
9.7 |
% |
9.4 |
% |
||||||||||||||||||||
| Note: All of these dividend yields are calculated as annualized dividends based on the last dividend paid in applicable time period divided by the closing price as of period end. Dividend yield sources: NAREIT website and Bloomberg, except for the 1994 NASDAQ dividend yield which was sourced from Datastream / Thomson Financial. |
||||||||||||||||||||||||||||||
| (1) |
FTSE NAREIT US Equity REIT Index, as per NAREIT website. |
|||||||||||||||||||||||||||||
| (2) |
Calculated as the difference between the closing stock price as of period end less the closing stock price as of previous period, plus dividends paid in period, divided by closing stock price as of end of previous period. Does not include reinvestment of dividends for the annual percentages. |
|||||||||||||||||||||||||||||
| (3) |
Includes reinvestment of dividends. Source: NAREIT website and Factset. |
|||||||||||||||||||||||||||||
| (4) |
Price only index, does not include dividends. Source: Factset. |
|||||||||||||||||||||||||||||
| (5) |
All of these Compounded Average Annual Total Return rates are calculated in the same manner: from Realty Income's NYSE listing on October 18, 1994 through December 31, 2014, and (except for NASDAQ) assuming reinvestment of dividends. Past performance does not guarantee future performance. Realty Income presents this data for informational purposes only and makes no representation about its future performance or how it will compare in performance to other indices in the future. |
|||||||||||||||||||||||||||||
| Property Type Diversification |
||||||||||||
| The following table sets forth certain property type information regarding Realty Income's property portfolio as of December 31, 2014 (dollars in thousands): |
||||||||||||
| Approximate |
Rental Revenue for |
Percentage of |
||||||||||
| Number of |
Leasable |
the Quarter Ended |
Rental |
|||||||||
| Property Type |
Properties |
Square Feet |
December 31, 2014 |
(1) |
Revenue |
|||||||
| Retail |
4,172 |
47,122,600 |
$ |
180,529 |
78.5 |
% |
||||||
| Industrial and distribution |
82 |
16,137,500 |
23,610 |
10.3 |
||||||||
| Office |
44 |
3,414,900 |
15,081 |
6.5 |
||||||||
| Manufacturing |
14 |
3,875,200 |
5,616 |
2.4 |
||||||||
| Agriculture |
15 |
184,500 |
5,267 |
2.3 |
||||||||
| Totals |
4,327 |
70,734,700 |
$ |
230,103 |
100.0 |
% |
||||||
| (1) |
Includes rental revenue for all properties owned by Realty Income at December 31, 2014. Excludes revenue of $44 from properties owned by Crest and $488 from sold properties that were included in continuing operations. |
|||||||||||
| Tenant Diversification |
|||||||||||
| The largest tenants based on percentage of total portfolio rental revenue at December 31, 2014 include the following: |
|||||||||||
| Tenant |
Number of Properties |
% of Revenue |
|||||||||
| Walgreens |
120 |
5.4 |
% |
||||||||
| FedEx |
38 |
5.1 |
% |
||||||||
| Dollar General |
502 |
4.9 |
% |
||||||||
| LA Fitness |
46 |
4.6 |
% |
||||||||
| Family Dollar |
454 |
4.5 |
% |
||||||||
| BJ's Wholesale Clubs |
15 |
2.8 |
% |
||||||||
| AMC Theatres |
20 |
2.7 |
% |
||||||||
| Diageo |
17 |
2.6 |
% |
||||||||
| Regal Cinemas |
23 |
2.3 |
% |
||||||||
| Northern Tier Energy/Super America |
134 |
2.2 |
% |
||||||||
| CVS Pharmacy |
55 |
2.1 |
% |
||||||||
| Rite Aid |
58 |
1.9 |
% |
||||||||
| TBC Corporation |
149 |
1.9 |
% |
||||||||
| Circle K |
168 |
1.8 |
% |
||||||||
| The Pantry |
144 |
1.6 |
% |
||||||||
| Walmart/Sam's Club |
19 |
1.4 |
% |
||||||||
| NPC International |
202 |
1.4 |
% |
||||||||
| GPM Investments/Fas Mart |
136 |
1.4 |
% |
||||||||
| FreedomRoads/Camping World |
18 |
1.2 |
% |
||||||||
| Smart & Final |
36 |
1.2 |
% |
||||||||
| Industry Diversification |
||||||||||||||||||||||
| The following table sets forth certain information regarding Realty Income's property portfolio classified according to the business of the respective tenants, expressed as a percentage of our total rental revenue: |
||||||||||||||||||||||
| Percentage of Rental Revenue(1) |
||||||||||||||||||||||
| For the |
||||||||||||||||||||||
| Quarter Ended |
For the Years Ended |
|||||||||||||||||||||
| December 31, |
Dec 31, |
Dec 31, |
Dec 31, |
Dec 31, |
Dec 31, |
Dec 31, |
||||||||||||||||
| 2014 |
2014 |
2013 |
2012 |
2011 |
2010 |
2009 |
||||||||||||||||
| Retail industries |
||||||||||||||||||||||
| Apparel stores |
2.2 |
% |
2.0 |
% |
1.9 |
% |
1.7 |
% |
1.4 |
% |
1.2 |
% |
1.1 |
% |
||||||||
| Automotive collision services |
0.8 |
0.8 |
0.8 |
1.1 |
0.9 |
1.0 |
1.1 |
|||||||||||||||
| Automotive parts |
1.4 |
1.3 |
1.2 |
1.0 |
1.2 |
1.4 |
1.5 |
|||||||||||||||
| Automotive service |
1.8 |
1.8 |
2.1 |
3.1 |
3.7 |
4.7 |
4.8 |
|||||||||||||||
| Automotive tire services |
3.1 |
3.2 |
3.6 |
4.7 |
5.6 |
6.4 |
6.9 |
|||||||||||||||
| Book stores |
* |
* |
* |
0.1 |
0.1 |
0.1 |
0.2 |
|||||||||||||||
| Child care |
2.2 |
2.2 |
2.8 |
4.5 |
5.2 |
6.5 |
7.3 |
|||||||||||||||
| Consumer electronics |
0.3 |
0.3 |
0.3 |
0.5 |
0.5 |
0.6 |
0.7 |
|||||||||||||||
| Convenience stores |
9.8 |
10.1 |
11.2 |
16.3 |
18.5 |
17.1 |
16.9 |
|||||||||||||||
| Crafts and novelties |
0.5 |
0.5 |
0.5 |
0.3 |
0.2 |
0.3 |
0.3 |
|||||||||||||||
| Dollar stores |
9.5 |
9.6 |
6.2 |
2.2 |
- |
- |
- |
|||||||||||||||
| Drug stores |
9.5 |
9.5 |
8.1 |
3.5 |
3.8 |
4.1 |
4.3 |
|||||||||||||||
| Education |
0.4 |
0.4 |
0.4 |
0.7 |
0.7 |
0.8 |
0.9 |
|||||||||||||||
| Entertainment |
0.5 |
0.5 |
0.6 |
0.9 |
1.0 |
1.2 |
1.3 |
|||||||||||||||
| Equipment services |
0.1 |
0.1 |
0.1 |
0.1 |
0.2 |
0.2 |
0.2 |
|||||||||||||||
| Financial services |
1.4 |
1.4 |
1.5 |
0.2 |
0.2 |
0.2 |
0.2 |
|||||||||||||||
| General merchandise |
1.4 |
1.2 |
1.1 |
0.6 |
0.6 |
0.8 |
0.8 |
|||||||||||||||
| Grocery stores |
3.1 |
3.0 |
2.9 |
3.7 |
1.6 |
0.9 |
0.7 |
|||||||||||||||
| Health and fitness |
7.0 |
7.0 |
6.3 |
6.8 |
6.4 |
6.9 |
5.9 |
|||||||||||||||
| Health care |
1.0 |
1.1 |
1.1 |
- |
- |
- |
- |
|||||||||||||||
| Home furnishings |
0.7 |
0.7 |
0.9 |
1.0 |
1.1 |
1.3 |
1.3 |
|||||||||||||||
| Home improvement |
2.1 |
1.7 |
1.6 |
1.5 |
1.7 |
2.0 |
2.2 |
|||||||||||||||
| Jewelry |
0.1 |
0.1 |
0.1 |
- |
- |
- |
- |
|||||||||||||||
| Motor vehicle dealerships |
1.5 |
1.6 |
1.6 |
2.1 |
2.2 |
2.6 |
2.7 |
|||||||||||||||
| Office supplies |
0.4 |
0.4 |
0.5 |
0.8 |
0.9 |
0.9 |
1.0 |
|||||||||||||||
| Pet supplies and services |
0.7 |
0.7 |
0.8 |
0.6 |
0.7 |
0.9 |
0.9 |
|||||||||||||||
| Restaurants - casual dining |
4.2 |
4.3 |
5.1 |
7.3 |
10.9 |
13.4 |
13.7 |
|||||||||||||||
| Restaurants - quick service |
3.8 |
3.7 |
4.4 |
5.9 |
6.6 |
7.7 |
8.3 |
|||||||||||||||
| Shoe stores |
0.1 |
0.1 |
0.1 |
0.1 |
0.2 |
0.1 |
- |
|||||||||||||||
| Sporting goods |
1.6 |
1.6 |
1.7 |
2.5 |
2.7 |
2.7 |
2.6 |
|||||||||||||||
| Theaters |
5.3 |
5.3 |
6.2 |
9.4 |
8.8 |
8.9 |
9.2 |
|||||||||||||||
| Transportation services |
0.1 |
0.1 |
0.1 |
0.2 |
0.2 |
0.2 |
0.2 |
|||||||||||||||
| Wholesale clubs |
4.1 |
4.1 |
3.9 |
3.2 |
0.7 |
- |
- |
|||||||||||||||
| Other |
* |
* |
0.1 |
0.1 |
0.1 |
0.3 |
1.1 |
|||||||||||||||
| Retail industries |
80.7 |
% |
80.4 |
% |
79.8 |
% |
86.7 |
% |
88.6 |
% |
95.4 |
% |
98.3 |
% |
||||||||
| Industry Diversification (continued) |
|||||||||||||||||||||||
| Percentage of Rental Revenue(1) |
|||||||||||||||||||||||
| For the |
|||||||||||||||||||||||
| Quarter Ended |
For the Years Ended |
||||||||||||||||||||||
| December 31, |
Dec 31, |
Dec 31, |
Dec 31, |
Dec 31, |
Dec 31, |
Dec 31, |
|||||||||||||||||
| 2014 |
2014 |
2013 |
2012 |
2011 |
2010 |
2009 |
|||||||||||||||||
| Non-retail industries |
|||||||||||||||||||||||
| Aerospace |
1.2 |
1.2 |
1.2 |
0.9 |
0.5 |
- |
- |
||||||||||||||||
| Beverages |
2.7 |
2.8 |
3.3 |
5.1 |
5.6 |
3.0 |
- |
||||||||||||||||
| Consumer appliances |
0.5 |
0.5 |
0.6 |
0.1 |
- |
- |
- |
||||||||||||||||
| Consumer goods |
0.9 |
0.9 |
1.0 |
0.1 |
- |
- |
- |
||||||||||||||||
| Crafts and novelties |
0.1 |
0.1 |
0.1 |
- |
- |
- |
- |
||||||||||||||||
| Diversified industrial |
0.6 |
0.5 |
0.2 |
0.1 |
- |
- |
- |
||||||||||||||||
| Electric utilities |
0.1 |
0.1 |
* |
- |
- |
- |
- |
||||||||||||||||
| Equipment services |
0.5 |
0.5 |
0.4 |
0.3 |
0.2 |
- |
- |
||||||||||||||||
| Financial services |
0.4 |
0.4 |
0.5 |
0.4 |
0.3 |
- |
- |
||||||||||||||||
| Food processing |
1.3 |
1.4 |
1.5 |
1.3 |
0.7 |
- |
- |
||||||||||||||||
| General merchandise |
0.3 |
0.3 |
- |
- |
- |
- |
- |
||||||||||||||||
| Government services |
1.2 |
1.3 |
1.4 |
0.1 |
0.1 |
0.1 |
0.1 |
||||||||||||||||
| Health care |
0.7 |
0.7 |
0.8 |
* |
* |
- |
- |
||||||||||||||||
| Home furnishings |
0.2 |
0.2 |
0.2 |
- |
- |
- |
- |
||||||||||||||||
| Insurance |
0.1 |
0.1 |
0.1 |
* |
- |
- |
- |
||||||||||||||||
| Machinery |
0.2 |
0.2 |
0.2 |
0.1 |
- |
- |
- |
||||||||||||||||
| Other manufacturing |
0.7 |
0.7 |
0.6 |
- |
- |
- |
- |
||||||||||||||||
| Packaging |
0.8 |
0.8 |
0.9 |
0.7 |
0.4 |
- |
- |
||||||||||||||||
| Paper |
0.1 |
0.1 |
0.2 |
0.1 |
0.1 |
- |
- |
||||||||||||||||
| Shoe stores |
0.7 |
0.8 |
0.9 |
- |
- |
- |
- |
||||||||||||||||
| Telecommunications |
0.7 |
0.7 |
0.7 |
0.8 |
0.7 |
- |
- |
||||||||||||||||
| Transportation services |
5.1 |
5.1 |
5.3 |
2.2 |
1.6 |
- |
- |
||||||||||||||||
| Other |
0.2 |
0.2 |
0.1 |
1.0 |
1.2 |
1.5 |
1.6 |
||||||||||||||||
| Non-retail industries |
19.3 |
% |
19.6 |
% |
20.2 |
% |
13.3 |
% |
11.4 |
% |
4.6 |
% |
1.7 |
% |
|||||||||
| Totals |
100.0 |
% |
100.0 |
% |
100.0 |
% |
100.0 |
% |
100.0 |
% |
100.0 |
% |
100.0 |
% |
|||||||||
| * |
Less than 0.1% |
||||||||||||||||||||||
| (1) |
Includes rental revenue for all properties owned by Realty Income at the end of each period presented, including revenue from properties reclassified as discontinued operations. Excludes revenue from properties owned by Crest Net Lease, Inc., or Crest. |
||||||||||||||||||||||
| Lease Expirations |
||||||||||||||||||||||||||||
| The following table sets forth certain information regarding Realty Income's property portfolio regarding the timing of the lease term expirations (excluding rights to extend a lease at the option of the tenant) on our 4,238 net leased, single-tenant properties as of December 31, 2014 (dollars in thousands): |
||||||||||||||||||||||||||||
| Total Portfolio(1) |
Initial Expirations(3) |
Subsequent Expirations(4) |
||||||||||||||||||||||||||
| Rental |
Rental |
Rental |
||||||||||||||||||||||||||
| Revenue |
Revenue |
Revenue |
||||||||||||||||||||||||||
| for the |
for the |
for the |
||||||||||||||||||||||||||
| Number |
Quarter |
% of |
Quarter |
% of |
Quarter |
% of |
||||||||||||||||||||||
| of Leases |
Approx. |
Ended |
Total |
Number |
Ended |
Total |
Number |
Ended |
Total |
|||||||||||||||||||
| Expiring |
Leasable |
Dec 31, |
Rental |
of Leases |
Dec 31, |
Rental |
of Leases |
Dec 31, |
Rental |
|||||||||||||||||||
| Year |
Retail |
Non-Retail |
Sq. Feet |
2014 |
(2) |
Revenue |
Expiring |
2014 |
Revenue |
Expiring |
2014 |
Revenue |
||||||||||||||||
| 2015 |
142 |
- |
784,600 |
$ |
3,058 |
1.4 |
% |
68 |
$ |
1,554 |
0.7 |
% |
74 |
$ |
1,504 |
0.7 |
% |
|||||||||||
| 2016 |
203 |
1 |
1,236,800 |
4,719 |
2.1 |
121 |
2,823 |
1.3 |
83 |
1,896 |
0.8 |
|||||||||||||||||
| 2017 |
207 |
1 |
2,160,200 |
6,667 |
2.9 |
49 |
2,954 |
1.3 |
159 |
3,713 |
1.6 |
|||||||||||||||||
| 2018 |
286 |
10 |
4,024,800 |
11,913 |
5.3 |
169 |
8,347 |
3.7 |
127 |
3,566 |
1.6 |
|||||||||||||||||
| 2019 |
238 |
11 |
3,934,400 |
13,429 |
5.9 |
169 |
11,242 |
4.9 |
80 |
2,187 |
1.0 |
|||||||||||||||||
| 2020 |
133 |
12 |
3,818,800 |
10,473 |
4.6 |
105 |
9,256 |
4.1 |
40 |
1,217 |
0.5 |
|||||||||||||||||
| 2021 |
186 |
13 |
5,493,600 |
14,486 |
6.4 |
188 |
13,907 |
6.1 |
11 |
579 |
0.3 |
|||||||||||||||||
| 2022 |
225 |
18 |
7,441,700 |
15,136 |
6.7 |
221 |
14,480 |
6.4 |
22 |
656 |
0.3 |
|||||||||||||||||
| 2023 |
352 |
20 |
6,475,800 |
21,741 |
9.6 |
359 |
21,073 |
9.3 |
13 |
668 |
0.3 |
|||||||||||||||||
| 2024 |
179 |
10 |
3,280,000 |
9,552 |
4.2 |
184 |
9,390 |
4.1 |
5 |
162 |
0.1 |
|||||||||||||||||
| 2025 |
311 |
10 |
4,256,100 |
17,994 |
7.9 |
300 |
17,393 |
7.6 |
21 |
601 |
0.3 |
|||||||||||||||||
| 2026 |
234 |
4 |
3,214,500 |
12,354 |
5.4 |
234 |
12,252 |
5.4 |
4 |
102 |
* |
|||||||||||||||||
| 2027 |
467 |
3 |
5,238,400 |
18,820 |
8.3 |
468 |
18,781 |
8.3 |
2 |
39 |
* |
|||||||||||||||||
| 2028 |
284 |
5 |
6,037,700 |
16,178 |
7.1 |
287 |
16,122 |
7.1 |
2 |
56 |
* |
|||||||||||||||||
| 2029 |
320 |
3 |
4,973,500 |
12,961 |
5.7 |
317 |
12,789 |
5.6 |
6 |
172 |
0.1 |
|||||||||||||||||
| 2030 - 2043 |
317 |
33 |
6,795,400 |
37,525 |
16.5 |
347 |
37,493 |
16.5 |
3 |
32 |
* |
|||||||||||||||||
| Totals |
4,084 |
154 |
69,166,300 |
$ |
227,006 |
100.0 |
% |
3,586 |
$ |
209,856 |
92.4 |
% |
652 |
$ |
17,150 |
7.6 |
% |
|||||||||||
| * |
Less than 0.1% |
|||||||||||||||||||||||||||
| (1) |
Excludes 19 multi-tenant properties and 70 vacant properties. The lease expirations for properties under construction are based on the estimated date of completion of those properties. |
|||||||||||||||||||||||||||
| (2) |
Excludes revenue of $3,097 from 19 multi-tenant properties and from 70 vacant properties at December 31, 2014, $488 from sold properties included in continuing operations and $44 from properties owned by Crest. |
|||||||||||||||||||||||||||
| (3) |
Represents leases to the initial tenant of the property that are expiring for the first time. |
|||||||||||||||||||||||||||
| (4) |
Represents lease expirations on properties in the portfolio which have previously been renewed, extended or re-tenanted. |
|||||||||||||||||||||||||||
| Geographic Diversification |
|||||||||||
| The following table sets forth certain state-by-state information regarding Realty Income's property portfolio as of December 31, 2014 (dollars in thousands): |
|||||||||||
| Approximate |
Rental Revenue for |
Percentage of |
|||||||||
| Number of |
Percent |
Leasable |
the Quarter Ended |
Rental |
|||||||
| State |
Properties |
Leased |
Square Feet |
December 31, 2014 |
(1) |
Revenue |
|||||
| Alabama |
128 |
98 |
% |
1,039,500 |
$ |
3,485 |
1.5 |
% |
|||
| Alaska |
3 |
100 |
275,900 |
503 |
0.2 |
||||||
| Arizona |
113 |
96 |
1,577,700 |
6,212 |
2.7 |
||||||
| Arkansas |
53 |
98 |
782,600 |
1,660 |
0.7 |
||||||
| California |
164 |
100 |
5,221,500 |
24,029 |
10.4 |
||||||
| Colorado |
72 |
97 |
1,045,400 |
3,929 |
1.7 |
||||||
| Connecticut |
25 |
96 |
536,900 |
2,564 |
1.1 |
||||||
| Delaware |
17 |
100 |
78,300 |
632 |
0.3 |
||||||
| Florida |
321 |
99 |
3,331,400 |
13,522 |
5.9 |
||||||
| Georgia |
237 |
98 |
3,362,200 |
10,085 |
4.4 |
||||||
| Hawaii |
-- |
-- |
-- |
-- |
-- |
||||||
| Idaho |
12 |
100 |
87,000 |
457 |
0.2 |
||||||
| Illinois |
163 |
99 |
4,590,800 |
12,933 |
5.6 |
||||||
| Indiana |
133 |
100 |
1,332,700 |
5,491 |
2.4 |
||||||
| Iowa |
35 |
94 |
2,751,700 |
3,400 |
1.5 |
||||||
| Kansas |
84 |
99 |
1,467,400 |
3,181 |
1.4 |
||||||
| Kentucky |
57 |
96 |
925,900 |
3,166 |
1.4 |
||||||
| Louisiana |
89 |
99 |
1,011,200 |
2,940 |
1.3 |
||||||
| Maine |
10 |
100 |
145,300 |
894 |
0.4 |
||||||
| Maryland |
34 |
100 |
791,100 |
4,404 |
1.9 |
||||||
| Massachusetts |
81 |
98 |
751,100 |
3,486 |
1.5 |
||||||
| Michigan |
114 |
98 |
1,118,000 |
3,673 |
1.6 |
||||||
| Minnesota |
155 |
100 |
1,209,600 |
7,421 |
3.2 |
||||||
| Mississippi |
122 |
98 |
1,566,100 |
3,882 |
1.7 |
||||||
| Missouri |
137 |
97 |
2,776,000 |
8,177 |
3.5 |
||||||
| Montana |
1 |
100 |
5,400 |
13 |
* |
||||||
| Nebraska |
31 |
100 |
708,700 |
1,758 |
0.8 |
||||||
| Nevada |
22 |
95 |
413,000 |
1,289 |
0.6 |
||||||
| New Hampshire |
20 |
100 |
320,100 |
1,511 |
0.7 |
||||||
| New Jersey |
67 |
99 |
577,300 |
3,604 |
1.6 |
||||||
| New Mexico |
31 |
100 |
302,500 |
897 |
0.4 |
||||||
| New York |
86 |
98 |
2,198,700 |
10,938 |
4.7 |
||||||
| North Carolina |
148 |
99 |
1,524,600 |
5,711 |
2.5 |
||||||
| North Dakota |
7 |
100 |
66,000 |
118 |
* |
||||||
| Ohio |
216 |
98 |
5,179,600 |
12,327 |
5.4 |
||||||
| Oklahoma |
123 |
99 |
1,450,600 |
3,660 |
1.6 |
||||||
| Oregon |
25 |
100 |
525,400 |
1,957 |
0.9 |
||||||
| Pennsylvania |
147 |
99 |
1,792,400 |
7,235 |
3.1 |
||||||
| Rhode Island |
4 |
100 |
157,200 |
808 |
0.3 |
||||||
| South Carolina |
132 |
99 |
970,100 |
4,413 |
1.9 |
||||||
| South Dakota |
11 |
100 |
133,500 |
244 |
0.1 |
||||||
| Tennessee |
197 |
96 |
2,584,600 |
6,423 |
2.8 |
||||||
| Texas |
439 |
98 |
8,136,900 |
22,309 |
9.7 |
||||||
| Utah |
15 |
100 |
760,000 |
1,398 |
0.6 |
||||||
| Vermont |
5 |
100 |
98,000 |
480 |
0.2 |
||||||
| Virginia |
141 |
99 |
2,872,700 |
7,139 |
3.1 |
||||||
| Washington |
38 |
97 |
415,300 |
1,768 |
0.8 |
||||||
| West Virginia |
12 |
100 |
261,200 |
984 |
0.4 |
||||||
| Wisconsin |
43 |
98 |
1,456,200 |
2,781 |
1.2 |
||||||
| Wyoming |
3 |
100 |
21,100 |
63 |
* |
||||||
| Puerto Rico |
4 |
100 |
28,300 |
149 |
0.1 |
||||||
| Totals\Average |
4,327 |
98 |
% |
70,734,700 |
$ |
230,103 |
100.0 |
% |
|||
| * |
Less than 0.1% |
||||||||||
| (1) |
Includes rental revenue for all properties owned by Realty Income at December 31, 2014. Excludes revenue of $44 from properties owned by Crest and $488 from sold properties that were included in continuing operations. |
||||||||||
Logo - http://photos.prnewswire.com/prnh/20130507/MM09486LOGO
SOURCE Realty Income Corporation


Share this article