August home sales and price notch higher amid temporary rate reprieve, C.A.R. reports

- Existing, single-family home sales totaled 313,540 in August on a seasonally adjusted annualized rate, up 6.1 percent from July and down 24.4 percent from August 2021.
- August's statewide median home price was, $839,460 up 0.7 percent from July and up 1.4 percent from August 2021.
- Year-to-date statewide home sales were down 14.9 percent in August.
LOS ANGELES, Sept. 16, 2022 /PRNewswire/ -- A brief retreat in mortgage rates that created a slightly more favorable lending environment provided a window of opportunity for California homebuyers and perked up home sales in August for the first time in five months, the CALIFORNIA ASSOCIATION OF REALTORS® (C.A.R.) said today.
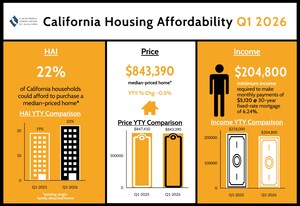
Infographic: https://www.car.org/Global/Infographics/2022-08-Sales-and-Price
Closed escrow sales of existing, single-family detached homes in California totaled a seasonally adjusted annualized rate of 313,540 in August, according to information collected by C.A.R. from more than 90 local REALTOR® associations and MLSs statewide. The statewide annualized sales figure represents what would be the total number of homes sold during 2022 if sales maintained the August pace throughout the year. It is adjusted to account for seasonal factors that typically influence home sales. August's sales pace was up 6.1 percent on a monthly basis from 295,460 in July and down 24.4 percent from a year ago, when 414,860 homes were sold on an annualized basis. August's monthly sales increase was higher than the long-run average of 0.4 percent for a July-August period in the past 43 years and marked the first monthly sales increase in five months.
"California's housing market stabilized briefly as a temporary reprieve on mortgage rates in July and early August brought buyers into the market," said C.A.R. President Otto Catrina, a Bay Area real estate broker and REALTOR®. "Active listings have passed their annual peak, and while homes are taking slightly longer to sell, the share of homes seeing price reductions has also stabilized to near pre-pandemic levels. In fact, price growth in August actually picked up on both a monthly and annual basis, and pending sales suggest a bounce-back for homes priced $2 million and above."
California home prices stabilized in August as the statewide median price increased on both a monthly basis and yearly basis, but at a less-than-2-percent growth pace. The statewide median price edged up 0.7 percent in August to $839,460 from the $833,910 recorded in July and was up 1.4 percent from the $827,940 recorded last August. The year-over-year price gain was the smallest in more than two years. The nominal price increase was attributed partly to a change in the mix of sales in August. With sales in the million-dollar price segment rising 6.8 percent from the prior month, the August statewide median price also pushed up slightly by 0.7 percent from July.
"It's encouraging to see that August's sales pace rebounded above an annualized 300,000 units sold," said C.A.R. Vice President and Chief Economist Jordan Levine. "Although we do not expect a rapid bounce-back because the Fed is expected to continue raising interest rates to get inflation under control, the monthly increase in closed and pending sales suggests that the market may have already priced in most of the rate increases to date. Still, buyers will continue to grapple with rising costs of borrowing, which will keep home sales below the 350,000 annualized pace for the remainder of the year."
Consumer optimism bounced back as interest rates declined in early August, according to C.A.R.'s monthly Consumer Housing Sentiment Index. Conducted in early September, the share of respondents who believed it was a good time to buy a home rose month-over-month for the third straight month to 19 percent, pushing the Housing Sentiment Index to 59, but was significantly lower than the Index of 72 in August 2021. Meanwhile, those who believed it was a good time to sell a home continued to decline to 56 percent, dropping sharply from 72 percent in August 2021. With interest rates moving upward since mid-August, housing sentiment will likely reverse direction next month. In fact, two-thirds (64%) of consumers believed that the overall economic conditions in California would not improve in the next 12 months, and three-quarters (75%) believed that interest rates would rise in the next 12 months.
Other key points from C.A.R.'s August 2022 resale housing report include:
- At the regional level, sales continued to fall sharply from last year, but the declines in August moderated slightly from the prior month. Three of the five major regions continued to drop by more than 25 percent from last year, with the Central Coast region dipping the most at 30.6 percent year-over-year. The San Francisco Bay Area (-29.1 percent) and Southern California (-28.8 percent) also dipped more than 25 percent from last year, but the declines were less severe compared to the drops recorded in July. The Central Valley (-22.1 percent) and the Far North (-10.5 percent) had the smallest sales declines of the five major regions, but both continued to fall year-over-year by double-digits.
- All but four counties tracked by C.A.R. posted sales drops from last August 2022. Of the 47 counties that experienced a year-over-year sales decline, 30 counties suffered a plunge of more than 20 percent. San Benito County recorded the biggest sales drop from last August at -68.2 percent, followed by Sonoma (-40.3 percent), and Monterey (-35.8 percent). Counties that experienced a sales decline decreased an average of -23.4 percent in August. Four counties recorded a sales increase from a year ago, with Plumas gaining the most at 43.3 percent. Siskiyou (11.9 percent), Del Norte (9.1 percent) and Nevada (2.2 percent) were the other three counties that recorded an annual sales increase. For the first eight months of 2022, sales in San Benito had the sharpest decline at -31.2 percent, while Yuba (8.4 percent) continued to post the best sales performance of all counties compared to last year.
- For the first eight months of 2022, sales in San Luis Obispo continued to drop the sharpest at -28.9 percent, while Yuba (17.7 percent) continued to post the best sales performance of all counties compared to last year.
- More than two-thirds of all California counties experienced a year-over-year increase in their median prices, but their growth rates have been decelerating in the past three months. Seven counties continued to record double-digit growth rates in their median prices from a year ago but was fewer than the 31 counties recorded in May. Napa (29.2 percent) had the biggest price gain of all counties, followed by Sutter (14.8 percent) and Kern (14.5 percent). Fifteen counties registered a dipped in their median prices from a year ago, with Tehama dropping the most at -13.8 percent, followed by San Francisco (-11.6 percent) and El Dorado (-7.3 percent).
- Housing supply in California improved from a year ago but tightened slightly from the prior month as housing demand rose in August. The statewide Unsold Inventory Index (UII) increased to 2.9 months in August 2022 from 1.9 months a year ago. Weaker housing demand, however, continued to be the primary factor for the improvement in the index. With both closed sales and pending sales slowing by more than 20 percent, active listings have been staying on the market longer, resulting in a year-over-year surge of 57.1 percent in homes for sale in August.
- Forty-seven of the 51 counties tracked by C.A.R. recorded an increase in active listings on a year-over-year basis in August, a slight increase from July's 46 counties. Three counties had triple-digit year-over-year gains in homes for sale, with Yuba leading the pack again with a surge of 162.4 percent from a year ago, followed by Placer (105.6 percent) and Mendocino (100.0 percent). Despite an overall improvement in housing supply conditions, four counties experienced a dip in active listings from last year. Active listings in Del Norte dropped the most at -56.0 percent, followed by Plumas (-5.9 percent), Sonoma (-2.9 percent), and Lassen (-1.0 percent).
- The median number of days it took to sell a California single-family home was 19 days in August and 9 days in August 2021.
- C.A.R.'s statewide sales-price-to-list-price ratio* was 98.4 percent in August 2022 and was below 100 percent for the first time since June 2020. The statewide sales-price-to-list-price ratio was 102.8 percent in August 2021.
- The statewide average price per square foot** for an existing single-family home was $406, up from $395 in August a year ago.
- The 30-year, fixed-mortgage interest rate averaged 5.22 percent in August, up from 2.84 percent in August 2021, according to Freddie Mac. The five-year, adjustable mortgage interest rate averaged 4.36 percent, compared to 2.42 percent in August 2021.
Note: The County MLS median price and sales data in the tables are generated from a survey of more than 90 associations of REALTORS® throughout the state and represent statistics of existing single-family detached homes only. County sales data is not adjusted to account for seasonal factors that can influence home sales. Movements in sales prices should not be interpreted as changes in the cost of a standard home. The median price is where half sold for more and half sold for less; medians are more typical than average prices, which are skewed by a relatively small share of transactions at either the lower end or the upper end. Median prices can be influenced by changes in cost, as well as changes in the characteristics and the size of homes sold. The change in median prices should not be construed as actual price changes in specific homes.
*Sales-to-list-price ratio is an indicator that reflects the negotiation power of home buyers and home sellers under current market conditions. The ratio is calculated by dividing the final sales price of a property by its last list price and is expressed as a percentage. A sales-to-list ratio with 100 percent or above suggests that the property sold for more than the list price, and a ratio below 100 percent indicates that the price sold below the asking price.
**Price per square foot is a measure commonly used by real estate agents and brokers to determine how much a square foot of space a buyer will pay for a property. It is calculated as the sale price of the home divided by the number of finished square feet. C.A.R. currently tracks price-per-square foot statistics for 50 counties.
Leading the way…® in California real estate for more than 110 years, the CALIFORNIA ASSOCIATION OF REALTORS® (www.car.org) is one of the largest state trade organizations in the United States with more than 217,000 members dedicated to the advancement of professionalism in real estate. C.A.R. is headquartered in Los Angeles.
August 2022 County Sales and Price Activity
(Regional and condo sales data not seasonally adjusted)
August 2022 |
Median Sold Price of Existing Single-Family Homes |
Sales |
|||||||
State/Region/County |
Aug. 2022 |
July 2022 |
Aug. 2021 |
Price |
Price |
Sales |
Sales |
||
Calif. Single-family home |
$839,460 |
$833,910 |
$827,940 |
0.7 % |
1.4 % |
6.1 % |
-24.4 % |
||
Calif. Condo/Townhome |
$625,000 |
$645,000 |
$600,000 |
-3.1 % |
4.2 % |
9.6 % |
-28.6 % |
||
Los Angeles Metro Area |
$765,000 |
$780,000 |
$731,000 |
-1.9 % |
4.7 % |
5.7 % |
-29.1 % |
||
Central Coast |
$950,000 |
$950,000 |
$905,000 |
0.0 % |
5.0 % |
15.9 % |
-30.6 % |
||
Central Valley |
$460,000 |
$480,000 |
$450,000 |
-4.2 % |
2.2 % |
9.9 % |
-22.1 % |
||
Far North |
$380,000 |
$405,000 |
$387,000 |
-6.2 % |
-1.8 % |
-1.3 % |
-10.5 % |
||
Inland Empire |
$565,500 |
$575,000 |
$520,000 |
-1.7 % |
8.7 % |
7.2 % |
-29.4 % |
||
San Francisco Bay Area |
$1,250,000 |
$1,300,000 |
$1,265,000 |
-3.8 % |
-1.2 % |
9.9 % |
-29.1 % |
||
Southern California |
$795,000 |
$808,000 |
$760,000 |
-1.6 % |
4.6 % |
7.8 % |
-28.8 % |
||
San Francisco Bay Area |
|||||||||
Alameda |
$1,230,000 |
$1,340,000 |
$1,300,000 |
-8.2 % |
-5.4 % |
10.4 % |
-29.9 % |
||
Contra Costa |
$870,000 |
$902,500 |
$889,500 |
-3.6 % |
-2.2 % |
4.7 % |
-27.4 % |
||
Marin |
$1,626,000 |
$1,720,000 |
$1,560,000 |
-5.5 % |
4.2 % |
30.5 % |
-6.2 % |
||
Napa |
$1,162,500 |
$1,107,500 |
$900,000 |
5.0 % |
29.2 % |
32.4 % |
-23.1 % |
||
San Francisco |
$1,635,000 |
$1,700,000 |
$1,850,000 |
-3.8 % |
-11.6 % |
3.4 % |
-23.9 % |
||
San Mateo |
$1,950,000 |
$1,965,000 |
$1,925,000 |
-0.8 % |
1.3 % |
-0.7 % |
-30.3 % |
||
Santa Clara |
$1,650,000 |
$1,740,000 |
$1,655,000 |
-5.2 % |
-0.3 % |
22.7 % |
-28.4 % |
||
Solano |
$610,000 |
$598,000 |
$590,000 |
2.0 % |
3.4 % |
7.1 % |
-32.1 % |
||
Sonoma |
$840,000 |
$817,500 |
$770,000 |
2.8 % |
9.1 % |
-1.5 % |
-40.3 % |
||
Southern California |
|||||||||
Los Angeles |
$854,960 |
$846,320 |
$830,070 |
1.0 % |
3.0 % |
1.2 % |
-29.1 % |
||
Orange |
$1,200,000 |
$1,231,000 |
$1,100,000 |
-2.5 % |
9.1 % |
10.1 % |
-30.2 % |
||
Riverside |
$620,000 |
$625,000 |
$570,000 |
-0.8 % |
8.8 % |
5.5 % |
-27.4 % |
||
San Bernardino |
$472,750 |
$490,000 |
$435,000 |
-3.5 % |
8.7 % |
10.3 % |
-32.6 % |
||
San Diego |
$885,000 |
$930,000 |
$835,000 |
-4.8 % |
6.0 % |
16.3 % |
-27.7 % |
||
Ventura |
$884,000 |
$920,000 |
$853,000 |
-3.9 % |
3.6 % |
13.3 % |
-24.0 % |
||
Central Coast |
|||||||||
Monterey |
$842,500 |
$924,000 |
$827,500 |
-8.8 % |
1.8 % |
2.9 % |
-35.8 % |
||
San Luis Obispo |
$868,500 |
$895,500 |
$770,000 |
-3.0 % |
12.8 % |
7.3 % |
-29.1 % |
||
Santa Barbara |
$1,112,500 |
$902,500 |
$1,111,960 |
23.3 % |
0.0 % |
39.2 % |
-24.5 % |
||
Santa Cruz |
$1,300,000 |
$1,250,000 |
$1,255,000 |
4.0 % |
3.6 % |
21.4 % |
-34.0 % |
||
Central Valley |
|||||||||
Fresno |
$405,000 |
$407,000 |
$375,000 |
-0.5 % |
8.0 % |
9.2 % |
-20.7 % |
||
Glenn |
$327,500 |
$360,000 |
$302,500 |
-9.0 % |
8.3 % |
0.0 % |
-7.1 % |
||
Kern |
$373,250 |
$362,900 |
$326,000 |
2.9 % |
14.5 % |
18.7 % |
-12.8 % |
||
Kings |
$321,750 |
$350,000 |
$310,000 |
-8.1 % |
3.8 % |
8.4 % |
-12.6 % |
||
Madera |
$400,000 |
$433,000 |
$377,500 |
-7.6 % |
6.0 % |
-6.8 % |
-4.9 % |
||
Merced |
$385,000 |
$410,000 |
$369,250 |
-6.1 % |
4.3 % |
-4.3 % |
-30.2 % |
||
Placer |
$650,000 |
$712,450 |
$643,750 |
-8.8 % |
1.0 % |
9.5 % |
-28.3 % |
||
Sacramento |
$535,000 |
$550,000 |
$515,000 |
-2.7 % |
3.9 % |
6.6 % |
-26.4 % |
||
San Benito |
$755,000 |
$825,000 |
$774,510 |
-8.5 % |
-2.5 % |
-46.2 % |
-68.2 % |
||
San Joaquin |
$530,000 |
$510,000 |
$514,480 |
3.9 % |
3.0 % |
30.5 % |
-17.5 % |
||
Stanislaus |
$460,000 |
$469,000 |
$435,000 |
-1.9 % |
5.7 % |
17.7 % |
-28.6 % |
||
Tulare |
$350,000 |
$370,000 |
$317,500 |
-5.4 % |
10.2 % |
-1.0 % |
-6.2 % |
||
Far North |
|||||||||
Butte |
$441,000 |
$450,000 |
$435,000 |
-2.0 % |
1.4 % |
-14.5 % |
-16.3 % |
||
Lassen |
$199,000 |
$260,000 |
$204,500 |
-23.5 % |
-2.7 % |
-28.9 % |
-6.9 % |
||
Plumas |
$380,000 |
$462,500 |
$397,500 |
-17.8 % |
-4.4 % |
-10.4 % |
43.3 % |
||
Shasta |
$370,000 |
$389,000 |
$389,900 |
-4.9 % |
-5.1 % |
11.7 % |
-15.6 % |
||
Siskiyou |
$360,000 |
$339,000 |
$327,500 |
6.2 % |
9.9 % |
4.4 % |
11.9 % |
||
Tehama |
$301,000 |
$325,000 |
$349,000 |
-7.4 % |
-13.8 % |
3.4 % |
-18.9 % |
||
Other Calif. Counties |
|||||||||
Amador |
$447,450 |
$395,000 |
$425,000 |
13.3 % |
5.3 % |
33.3 % |
-6.7 % |
||
Calaveras |
$464,950 |
$459,900 |
$485,000 |
1.1 % |
-4.1 % |
22.7 % |
-21.4 % |
||
Del Norte |
$378,960 |
$376,000 |
$357,500 |
0.8 % |
6.0 % |
0.0 % |
9.1 % |
||
El Dorado |
$631,000 |
$650,000 |
$680,890 |
-2.9 % |
-7.3 % |
13.8 % |
-23.2 % |
||
Humboldt |
$465,000 |
$480,000 |
$408,500 |
-3.1 % |
13.8 % |
22.4 % |
-11.8 % |
||
Lake |
$330,000 |
$356,000 |
$335,000 |
-7.3 % |
-1.5 % |
-15.3 % |
-34.4 % |
||
Mariposa |
$450,000 |
$601,000 |
$475,000 |
-25.1 % |
-5.3 % |
46.2 % |
-9.5 % |
||
Mendocino |
$502,500 |
$619,500 |
$533,000 |
-18.9 % |
-5.7 % |
33.3 % |
-13.3 % |
||
Mono |
$797,500 |
$815,000 |
$819,500 |
-2.1 % |
-2.7 % |
7.7 % |
-30.0 % |
||
Nevada |
$580,000 |
$595,000 |
$570,950 |
-2.5 % |
1.6 % |
7.6 % |
2.2 % |
||
Sutter |
$459,000 |
$437,100 |
$400,000 |
5.0 % |
14.8 % |
23.7 % |
-15.1 % |
||
Tuolumne |
$407,500 |
$435,000 |
$389,000 |
-6.3 % |
4.8 % |
-9.3 % |
-32.8 % |
||
Yolo |
$639,000 |
$600,000 |
$595,000 |
6.5 % |
7.4 % |
29.7 % |
-10.9 % |
||
Yuba |
$422,500 |
$440,000 |
$410,000 |
-4.0 % |
3.0 % |
-8.6 % |
-35.7 % |
||
r = revised
August 2022 County Unsold Inventory and Days on Market
(Regional and condo sales data not seasonally adjusted)
August 2022 |
Unsold Inventory Index |
Median Time on Market |
||||||||
State/Region/County |
Aug. 2022 |
July 2022 |
Aug. 2021 |
Aug. 2022 |
July 2022 |
Aug. 2021 |
||||
Calif. Single-family home |
2.9 |
3.2 |
1.9 |
19.0 |
14.0 |
9.0 |
||||
Calif. Condo/Townhome |
2.4 |
2.7 |
1.7 |
17.0 |
13.0 |
10.0 |
||||
Los Angeles Metro Area |
3.1 |
3.3 |
2.0 |
19.0 |
14.0 |
9.0 |
||||
Central Coast |
2.7 |
3.2 |
1.8 |
16.0 |
13.0 |
9.0 |
||||
Central Valley |
2.8 |
3.1 |
1.8 |
16.0 |
12.0 |
7.0 |
||||
Far North |
3.8 |
3.7 |
3.0 |
30.0 |
24.0 |
11.0 |
||||
Inland Empire |
3.4 |
3.6 |
2.2 |
21.0 |
15.0 |
10.0 |
||||
San Francisco Bay Area |
2.2 |
2.5 |
1.5 |
20.0 |
15.0 |
11.0 |
||||
Southern California |
3.0 |
3.3 |
1.9 |
18.0 |
13.0 |
9.0 |
||||
San Francisco Bay Area |
||||||||||
Alameda |
2.1 |
2.4 |
1.3 |
16.0 |
13.0 |
9.0 |
||||
Contra Costa |
2.3 |
2.5 |
1.4 |
18.0 |
13.0 |
8.0 |
||||
Marin |
1.8 |
2.1 |
1.6 |
26.0 |
16.0 |
14.0 |
||||
Napa |
3.4 |
4.3 |
2.7 |
36.0 |
34.5 |
33.0 |
||||
San Francisco |
2.2 |
2.2 |
1.7 |
18.0 |
15.0 |
13.0 |
||||
San Mateo |
2.3 |
2.2 |
1.5 |
14.0 |
12.0 |
9.0 |
||||
Santa Clara |
2.0 |
2.6 |
1.4 |
16.0 |
14.0 |
8.0 |
||||
Solano |
2.8 |
2.9 |
1.3 |
34.0 |
27.0 |
23.0 |
||||
Sonoma |
2.6 |
2.6 |
1.8 |
31.0 |
31.5 |
34.0 |
||||
Southern California |
||||||||||
Los Angeles |
3.1 |
3.3 |
2.0 |
16.0 |
13.0 |
9.0 |
||||
Orange |
2.5 |
3.0 |
1.6 |
17.5 |
13.0 |
8.0 |
||||
Riverside |
3.2 |
3.4 |
2.0 |
22.0 |
17.0 |
10.0 |
||||
San Bernardino |
3.7 |
4.0 |
2.4 |
19.0 |
13.0 |
10.0 |
||||
San Diego |
2.5 |
3.1 |
1.7 |
15.0 |
10.0 |
8.0 |
||||
Ventura |
2.3 |
2.8 |
1.9 |
28.0 |
23.0 |
20.0 |
||||
Central Coast |
||||||||||
Monterey |
3.1 |
3.2 |
2.1 |
20.0 |
14.0 |
9.0 |
||||
San Luis Obispo |
2.5 |
2.8 |
1.7 |
12.5 |
9.0 |
8.0 |
||||
Santa Barbara |
2.6 |
3.7 |
1.8 |
14.0 |
14.5 |
9.0 |
||||
Santa Cruz |
2.5 |
3.1 |
1.6 |
18.0 |
14.0 |
12.0 |
||||
Central Valley |
||||||||||
Fresno |
2.9 |
3.1 |
1.8 |
13.0 |
8.0 |
7.0 |
||||
Glenn |
4.2 |
4.4 |
3.1 |
52.0 |
7.0 |
7.5 |
||||
Kern |
2.4 |
2.9 |
1.8 |
18.0 |
12.0 |
8.0 |
||||
Kings |
2.3 |
2.5 |
1.8 |
12.5 |
13.0 |
6.0 |
||||
Madera |
3.7 |
3.4 |
3.2 |
17.0 |
14.5 |
11.0 |
||||
Merced |
3.5 |
3.4 |
2.0 |
16.5 |
15.0 |
10.0 |
||||
Placer |
3.0 |
3.3 |
1.5 |
21.0 |
14.0 |
7.0 |
||||
Sacramento |
2.6 |
2.7 |
1.7 |
16.0 |
11.0 |
7.0 |
||||
San Benito |
7.7 |
4.1 |
2.0 |
30.0 |
22.0 |
11.0 |
||||
San Joaquin |
2.9 |
3.8 |
2.2 |
19.0 |
14.0 |
8.0 |
||||
Stanislaus |
2.9 |
3.3 |
1.8 |
16.0 |
12.0 |
7.0 |
||||
Tulare |
2.7 |
2.6 |
2.1 |
12.0 |
12.0 |
7.0 |
||||
Far North |
||||||||||
Butte |
3.4 |
3.0 |
2.2 |
19.0 |
12.5 |
8.0 |
||||
Lassen |
4.6 |
2.9 |
4.3 |
70.0 |
70.5 |
102.0 |
||||
Plumas |
4.1 |
3.7 |
6.4 |
64.0 |
58.5 |
59.0 |
||||
Shasta |
3.3 |
3.8 |
2.4 |
21.5 |
14.0 |
8.0 |
||||
Siskiyou |
4.5 |
5.0 |
4.8 |
51.0 |
31.0 |
13.0 |
||||
Tehama |
6.4 |
6.4 |
4.1 |
53.5 |
59.0 |
40.0 |
||||
Other Calif. Counties |
||||||||||
Amador |
4.8 |
6.0 |
2.9 |
28.5 |
18.0 |
10.5 |
||||
Calaveras |
3.3 |
4.1 |
2.6 |
57.5 |
53.5 |
52.0 |
||||
Del Norte |
3.2 |
3.8 |
4.7 |
58.0 |
83.0 |
68.5 |
||||
El Dorado |
3.3 |
3.9 |
2.0 |
32.0 |
25.5 |
12.0 |
||||
Humboldt |
3.6 |
4.7 |
2.4 |
18.5 |
11.0 |
11.0 |
||||
Lake |
6.7 |
5.4 |
3.9 |
39.0 |
15.0 |
13.0 |
||||
Mariposa |
3.8 |
5.7 |
3.4 |
13.0 |
10.0 |
27.0 |
||||
Mendocino |
6.4 |
7.6 |
3.7 |
74.5 |
69.0 |
50.0 |
||||
Mono |
4.6 |
6.2 |
2.7 |
55.0 |
62.0 |
71.0 |
||||
Nevada |
3.4 |
3.7 |
2.6 |
35.0 |
23.0 |
12.0 |
||||
Sutter |
2.6 |
3.4 |
1.7 |
23.0 |
10.0 |
8.0 |
||||
Tuolumne |
4.3 |
3.9 |
2.7 |
69.5 |
55.0 |
10.5 |
||||
Yolo |
2.3 |
3.2 |
1.8 |
16.0 |
10.0 |
9.0 |
||||
Yuba |
4.1 |
3.6 |
1.6 |
26.0 |
18.0 |
7.0 |
||||
r = revised
SOURCE CALIFORNIA ASSOCIATION OF REALTORS® (C.A.R.)


Share this article