BEIJING, May 18, 2021 /PRNewswire/ -- Baidu, Inc. (NASDAQ: BIDU and HKEX: 9888) ("Baidu" or the "Company"), a leading AI company with strong Internet foundation, today announced its unaudited financial results for the first quarter ended March 31, 2021.
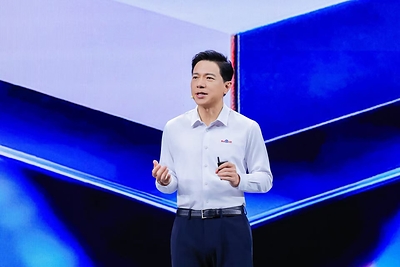
"We are delighted to bring innovation across many sectors, including marketing cloud, enterprise cloud, smart transportation, autonomous driving, smart assistant and AI chip, through our decade-long investment in AI," said Robin Li, co-founder and CEO of Baidu. "With AI powering the next stage of technology growth, many Baidu alumni have rejoined us, and our employees are energized from working on intelligent computing that can improve daily life and make the complex world simpler."
"Baidu Core delivered a strong first quarter with revenue growing 34% year over year, powered by non-advertising revenue growing 70% year over year," said Herman Yu, CFO of Baidu. "We will continue to invest heavily in sales, R&D and operations to support the rapid growth of our AI-powered business."
First Quarter 2021 Financial Highlights[1]
Baidu, Inc. | ||||||||||
(In millions except per | Q1 | Q4 | Q1 | |||||||
ADS, unaudited | 2020 | 2020 | 2021 | YOY | QOQ | |||||
RMB | RMB | RMB | US$ | |||||||
Total revenues | 22,545 | 30,263 | 28,134 | 4,294 | 25% | (7%) | ||||
Operating (loss) income | (437) | 4,977 | 2,789 | 426 | - | (44%) | ||||
Operating income (non-GAAP) [2] | 1,437 | 7,055 | 4,362 | 666 | 204% | (38%) | ||||
Net income to Baidu | 41 | 5,174 | 25,653 | 3,915 | 62468% | 396% | ||||
Net income to Baidu (non-GAAP) [2] | 3,082 | 6,868 | 4,297 | 656 | 39% | (37%) | ||||
Diluted earnings per ADS | 0.02 | 15.05 | 73.76 | 11.26 | 368700% | 390% | ||||
Diluted earnings per ADS (non-GAAP) [2] | 8.84 | 20.08 | 12.38 | 1.89 | 40% | (38%) | ||||
Adjusted EBITDA[2] | 2,852 | 8,564 | 5,900 | 901 | 107% | (31%) | ||||
Adjusted EBITDA margin | 13% | 28% | 21% | 21% | ||||||
Baidu Core | ||||||||||
Q1 | Q4 | Q1 | ||||||||
(In millions, unaudited) | 2020 | 2020 | 2021 | YOY | QOQ | |||||
RMB | RMB | RMB | US$ | |||||||
Total revenues | 15,268 | 23,111 | 20,483 | 3,126 | 34% | (11%) | ||||
Operating income | 1,848 | 6,320 | 3,847 | 587 | 108% | (39%) | ||||
Operating income (non-GAAP) [2] | 3,348 | 8,031 | 5,064 | 773 | 51% | (37%) | ||||
Net income to Baidu Core | 1,698 | 6,036 | 26,354 | 4,022 | 1452% | 337% | ||||
Net income to Baidu Core (non-GAAP) [2] | 4,519 | 7,533 | 4,870 | 743 | 8% | (35%) | ||||
Adjusted EBITDA [2] | 4,641 | 9,422 | 6,487 | 990 | 40% | (31%) | ||||
Adjusted EBITDA margin | 30% | 41% | 32% | 32% | ||||||
[1] Unless otherwise noted, RMB to USD was converted at an exchange rate of RMB6.5518 as of March 31, 2021, as set forth in the H.10 statistical release of the Board of Governors of the Federal Reserve System. Translations are provided solely for the convenience of the reader. |
[2] Non-GAAP measures are defined in the Non-GAAP Financial Measures section (see also "Reconciliations of Non-GAAP Financial Measures to the Nearest Comparable GAAP Measures" for more details). |
Other Highlights
Corporate
- Baidu ranks Top 3 in cloud services and No.1 in the utilization of renewable energy for data centers, according to Greenpeace, a global environmental organization, based on its April 2021 report Clean Cloud: Tracking Renewable Energy Use in China's Tech Industry.
- Baidu released its annual ESG Report in February 2021, which details Baidu's ESG policies and sustainability initiatives (http://esg.baidu.com/en/esg_download.html).
- On March 23, 2021, Baidu listed on the HKEX (9888) through a global offering of 95,000,000 Class A ordinary shares, receiving $3.1 billion in net proceeds.
- Baidu returned US$300 million to shareholders under the 2020 Share Repurchase Program this year, bringing the cumulative repurchase to $2.2 billion since 2020.
AI Cloud
- Baidu EasyDL, a simple to use machine learning service, was rated No.1 in terms of usage in China, per IDC in December 2020, topping the list for the second time.
- Baidu deep learning framework PaddlePaddle, upgraded to v2.0 in March 2021, was ranked among the Top 3 globally in terms of usage based on pull request, according to Github.
- A leading retail bank in China implemented Baidu's AI PaaS, which has led to five follow-on purchases, including application to automate customer service and consumer loan approval, and the recent purchase of private cloud services.
- Baidu partnered with the online arm of China's largest TV network CCTV to implement Baidu AI PaaS with capabilities to automate video clip creation and tagging from live broadcasting and use smart assistant to quickly locate desired video content. During an important annual event, Baidu enabled CCTV.com to simultaneously interview congressional meeting participants with AI reporters, powered by Baidu Brain, and timely share these interviews on the Internet.
- Chongqing, which implemented Apollo V2X last year, marking Baidu's entry into western China, signed with Apollo to make its smart transportation infrastructure 5G enabled, to support robotaxi ride hailing operation.
- Chengdu (Sichuan), a leader in science and technology development, signed with Apollo to implement V2X vehicle-to-road infrastructure.
Intelligent Driving
- Apollo has accumulated 6.2 million miles of L4 autonomous driving testing on the road and 600 million miles of simulated testing since its founding in 2013.
- Apollo received permit to test autonomous driving at night and under special weather conditions on public roads in Beijing. Apollo also received permits to pilot fully autonomous driving in Beijing, Cangzhou (Hebei), and Changsha (Hunan).
- Apollo Go, China's first fully autonomous ride-hailing, is now available at the Shougang Park, a Beijing 2022 Winter Olympics site.
- Apollo Go begins to charge for robotaxi ride hailing in Cangzhou, based on the distance traveled starting with a minimum fare, similarly to regular ride hailing.
- The total addressable market for robotaxi ride hailing will reach US$224 billion in China by 2025, according to China Insights Consultancy, a market research and consulting company.
- Jidu Auto, an intelligent EV company established in partnership with Zhejiang Geely Holding Group, appointed Yiping Xia as its CEO. Mr. Xia previously served as CTO at Mobike and held positions at Fiat Chrysler and Ford.
- Guangzhou Automobile Group joins Apollo's network of over 10 leading automakers to install Apollo Self Driving (ASD) services in its new vehicles.
- Guidehouse Insights (previously Navigant Research) has rated Baidu in the "leader" category for the second consecutive year, the only Chinese company honored among the four AI companies selected globally for this category. Apollo's open platform, to empower Jidu and other automakers as well as Apollo Go robotaxi, puts Apollo in a unique position to be well funded and widely adopted.
- DuerOS for Auto, powering infotainment, has been installed in over 1.5 million new vehicles, recorded Q1 2021 installation more than doubled from the prior year.
Other Growth Initiatives
- DuerOS monthly voice queries reached 6.6 billion with first-party voice queries reaching 3.9 billion in March 2021.
- Xiaodu ranked No.1 in smart display shipments globally and No.1 in smart speaker shipments in China for 2020, according to IDC, Strategy Analytics and Canalys.
- Xiaodu S12 smart pad for the education market was introduced in March with an MSRP of 1,699.
- Baidu Kunlun completed its first round of funding at a post-money valuation of $2 billion in April 2021. Kunlun chips are designed to optimize AI workload and improve cloud cost structure.
Mobile Ecosystem
- Baidu has strengthened its strong Internet foundation with Baidu App monthly active users (MAUs) reaching 558 million and daily logged in users reaching over 75% in March 2021.
- Baidu's AI building blocks are helping creators, service providers and merchants better engage with users and perform user life-time management:
- BJH publisher accounts grew 40% year over year to reached 4.2 million.
- Smart Mini Program MAUs reached 416 million, and the number of SMPs grew 74% from a year ago; and
- Revenue from Managed Page accounted for 35% of Baidu Core's online marketing revenue, up from 21% a year ago.
iQIYI
iQIYI subscribers reached 105.3 million as of March 31, 2021, serving as a strong foundation to support its over 50 in-house studios and produce entertainment blockbuster originals. iQIYI's net loss narrowed to RMB1.3 billion in Q1 21, compared to RMB 2.9 billion from a year ago.
First Quarter 2021 Results
Total revenues were RMB 28.1 billion ($4.29 billion), increasing 25% year over year.
- Revenue from Baidu Core was RMB 20.5 billion ($3.13 billion), increasing 34% year over year. Online marketing revenue was RMB 16.3 billion ($2.48 billion), up 27% year over year. Non-marketing revenue was RMB 4.2 billion ($646 million), up 70% year over year, driven by cloud and other services.
- Revenue from iQIYI was RMB 8.0 billion ($1.22 billion), increasing 4% year over year.
Cost of revenues was RMB 15.0 billion ($2.29 billion), increasing 2% year over year, primarily due to an increase in traffic acquisition costs and cost of goods sold, offset by a decrease in content costs and the amortization/impairment of intangible assets.
Selling, general and administrative expenses were RMB 5.2 billion ($800 million), increasing 36% year over year, primarily due to an increase in channel spending and promotional expenses.
Research and development expense was RMB 5.1 billion ($778 million), increasing 15% year over year, primarily related to personnel-related expenses.
Operating income was RMB 2.8 billion ($426 million). Baidu Core operating income was RMB 3.8 billion ($587 million), and Baidu Core operating margin was 19%. Non-GAAP operating income was RMB 4.4 billion ($666 million). Non-GAAP Baidu Core operating income was RMB 5.1 billion ($773 million), and non-GAAP Baidu Core operating margin was 25%.
Total other income, net was RMB 23.8 billion ($3.63 billion), which included a fair value gain of RMB 23.7 billion from long-term investments, mainly including a gain from the investment in Kuaishou Technology.
Income tax expense was RMB 1.5 billion ($234 million), compared to RMB 198 million last year, primarily due to the increase in profit.
Net income attributable to Baidu was RMB 25.7 billion ($3.92 billion), and diluted earnings per ADS was RMB 73.76 ($11.26). Net income attributable to Baidu Core was RMB 26.4 billion ($4.02 billion). Non-GAAP net income attributable to Baidu was RMB 4.3 billion ($656 million), and non-GAAP diluted earnings per ADS was RMB 12.38 ($1.89). Non-GAAP net income attributable to Baidu Core was RMB 4.9 billion ($743 million).
Adjusted EBITDA was RMB 5.9 billion ($901 million). Adjusted EBITDA for Baidu Core was RMB 6.5 billion ($990 million) and adjusted EBITDA margin for Baidu Core was 32%.
As of March 31, 2021, cash, cash equivalents, restricted cash and short-term investments were RMB 172.9 billion ($26.40 billion), and cash, cash equivalents, restricted cash and short-term investments excluding iQIYI were RMB 159.6 billion ($24.37 billion). Free cash flow was RMB 2.6 billion ($400 million), and free cash flow excluding iQIYI was RMB 4.0 billion ($615 million).
Financial Guidance
For the second quarter of 2021, Baidu expects revenues to be between RMB 29.7 billion ($4.5 billion) and RMB 32.5 billion ($5.0 billion), representing a growth rate of 14% to 25% year over year, which assumes that Baidu Core revenue will grow between 20% and 33% year over year. This guidance does not include potential contribution from an acquisition of YY Live.
The above forecast reflects Baidu's current and preliminary view, which is subject to substantial uncertainties.
Conference Call Information
Baidu's management will hold an earnings conference call at 8:00 AM on May 18, 2021, U.S. Eastern Time (8:00 PM on May 18, 2021, Beijing Time).
Please register in advance of the conference call using the link provided below. Upon registering, you will be provided with participant dial-in numbers, Direct Event passcode and unique registrant ID by email.
For pre-registration, please click http://apac.directeventreg.com/registration/event/4696103. It will automatically direct you to the registration page of "Baidu Q1 2021 Earnings Conference Call", where you may fill in your details for RSVP. If it requires you to enter a participant conference ID, please enter "4696103".
In the 10 minutes prior to the call start time, you may use the conference access information (including dial-in number(s), Direct Event passcode and unique registrant ID) provided in the confirmation email that you have received following your pre-registration.
Additionally, a live and archived webcast of this conference call will be available at http://ir.baidu.com.
A replay of the conference call may be accessed by phone at the following number until May 26 2021:
International: | +61 2 8199 0299 |
Conference ID: | 4696103 |
About Baidu
Founded in 2000, Baidu's mission is to make the complicated world simpler through technology. Baidu is a leading AI company with strong Internet foundation, trading on the NASDAQ under "BIDU" and HKEX under "9888". One Baidu ADS represents eight Class A ordinary shares.
Contacts
Investors Relations, Baidu, Inc.
Tel: +86-10-5992-8888
Email: [email protected]
Safe Harbor Statement
This announcement contains forward-looking statements. These statements are made under the "safe harbor" provisions of the U.S. Private Securities Litigation Reform Act of 1995. These forward-looking statements can be identified by terminology such as "will," "expects," "anticipates," "future," "intends," "plans," "believes," "estimates," "confident" and similar statements. Among other things, the outlook for the second quarter of 2021, quotations from management in this announcement, as well as Baidu's and other parties' strategic and operational plans, contain forward-looking statements. Baidu may also make written or oral forward-looking statements in its periodic reports to the U.S. Securities and Exchange Commission, in announcements made on the website of The Stock Exchange of Hong Kong Limited (the "Hong Kong Stock Exchange"), in its annual report to shareholders, in press releases and other written materials and in oral statements made by its officers, directors or employees to third parties. Statements that are not historical facts, including but not limited to statements about Baidu's beliefs and expectations, are forward-looking statements. Forward-looking statements involve inherent risks and uncertainties. A number of factors could cause actual results to differ materially from those contained in any forward-looking statement, including but not limited to the following: Baidu's growth strategies; its future business development, including development of new products and services; its ability to attract and retain users and customers; competition in the Chinese Internet search and newsfeed market; competition for online marketing customers; changes in the Company's revenues and certain cost or expense items as a percentage of its revenues; the outcome of ongoing, or any future, litigation or arbitration, including those relating to intellectual property rights; the expected growth of the Chinese-language Internet search and newsfeed market and the number of Internet and broadband users in China; Chinese governmental policies relating to the Internet and Internet search providers, and general economic conditions in China and elsewhere. Further information regarding these and other risks is included in the Company's annual report on Form 20-F and other documents filed with the Securities and Exchange Commission, and announcements on the website of the Hong Kong Stock Exchange. Baidu does not undertake any obligation to update any forward-looking statement, except as required under applicable law. All information provided in this press release and in the attachments is as of the date of the press release, and Baidu undertakes no duty to update such information, except as required under applicable law.
Non-GAAP Financial Measures
To supplement Baidu's consolidated financial results presented in accordance with GAAP, Baidu uses the following non-GAAP financial measures: non-GAAP operating income (loss), non-GAAP operating margin, non-GAAP net income (loss) attributable to Baidu, non-GAAP net margin, non-GAAP diluted earnings per ADS, adjusted EBITDA, adjusted EBITDA margin and free cash flow. The presentation of these non-GAAP financial measures is not intended to be considered in isolation or as a substitute for the financial information prepared and presented in accordance with GAAP.
Baidu believes that these non-GAAP financial measures provide meaningful supplemental information regarding its performance and liquidity by excluding certain items that may not be indicative of its recurring core business operating results, such as operating performance excluding non-cash charges or non-operating in nature. The Company believes that both management and investors benefit from referring to these non-GAAP financial measures in assessing its performance and when planning and forecasting future periods. These non-GAAP financial measures also facilitate management's internal comparisons to Baidu's historical performance and liquidity. The Company believes these non-GAAP financial measures are useful to investors in allowing for greater transparency with respect to supplemental information used by management in its financial and operational decision making. A limitation of using these non-GAAP financial measures is that these non-GAAP measures exclude certain items that have been and will continue to be for the foreseeable future a significant component in the Company's results of operations. These non-GAAP financial measures presented here may not be comparable to similarly titled measures presented by other companies. Other companies may calculate similarly titled measures differently, limiting their usefulness as comparative measures to the Company's data.
Non-GAAP operating income represents operating income excluding share-based compensation expenses and amortization and impairment of intangible assets resulting from business combinations.
Non-GAAP net income attributable to Baidu represents net income attributable to Baidu excluding share-based compensation expenses, amortization and impairment of intangible assets resulting from business combinations, disposal gain or loss, impairment of long-term investments, fair value change of long-term investments, adjusted for related income tax effects. Baidu's share of equity method investments for these non-GAAP reconciling items, amortization and impairment of intangible assets not on the investees' books, accretion of their redeemable non-controlling interests, and the gain or loss associated with the issuance of shares by the investees at a price higher or lower than the carrying value per shares, adjusted for related income tax effects, are also excluded.
Non-GAAP diluted earnings per ADS represents diluted earnings per ADS calculated by dividing non-GAAP net income attributable to Baidu, which is adjusted for accretion for the redeemable non-controlling interests, by the weighted average number of ordinary shares expressed in ADS. Adjusted EBITDA represents operating income excluding depreciation, amortization and impairment of intangible assets resulting from business combinations, and share-based compensation expenses.
For more information on non-GAAP financial measures, please see the tables captioned "Reconciliations of non-GAAP financial measures to the nearest comparable GAAP measures."
Baidu, Inc. | |||||||||
Condensed Consolidated Statements of Income (Loss) | |||||||||
(In millions except for per share (or ADS) information, unaudited) | |||||||||
Three Months Ended | |||||||||
March 31, | December 31, | March 31, | March 31, | ||||||
2020 | 2020 | 2021 | 2021 | ||||||
RMB | RMB | RMB | US$(2) | ||||||
Revenues: | |||||||||
Online marketing services | 14,243 | 20,708 | 18,094 | 2,762 | |||||
Others | 8,302 | 9,555 | 10,040 | 1,532 | |||||
Total revenues | 22,545 | 30,263 | 28,134 | 4,294 | |||||
Costs and expenses: | |||||||||
Cost of revenues(1) | 14,687 | 14,522 | 15,002 | 2,290 | |||||
Selling, general and administrative(1) | 3,852 | 5,094 | 5,245 | 800 | |||||
Research and development(1) | 4,443 | 5,670 | 5,098 | 778 | |||||
Total costs and expenses | 22,982 | 25,286 | 25,345 | 3,868 | |||||
Operating (loss) income | (437) | 4,977 | 2,789 | 426 | |||||
Other income (loss): | |||||||||
Interest income | 1,441 | 1,308 | 1,233 | 187 | |||||
Interest expense | (751) | (777) | (823) | (126) | |||||
Foreign exchange (loss) income, net | (98) | (346) | 156 | 24 | |||||
Share of income (loss) from | 181 | (151) | (151) | (23) | |||||
Others, net | (1,816) | 499 | 23,362 | 3,566 | |||||
Total other (loss) income, net | (1,043) | 533 | 23,777 | 3,628 | |||||
(Loss) income before income taxes | (1,480) | 5,510 | 26,566 | 4,054 | |||||
Income tax expense | 198 | 1,026 | 1,534 | 234 | |||||
Net (loss) income | (1,678) | 4,484 | 25,032 | 3,820 | |||||
Net loss attributable to noncontrolling interests | (1,719) | (690) | (621) | (95) | |||||
Net income attributable to Baidu | 41 | 5,174 | 25,653 | 3,915 | |||||
Earnings per ADS (1 ADS representing 8 Class A ordinary shares): | |||||||||
-Basic | 0.05 | 15.28 | 76.10 | 11.62 | |||||
-Diluted | 0.02 | 15.05 | 73.76 | 11.26 | |||||
Earnings per share for Class A and Class B ordinary shares: | |||||||||
-Basic | 0.01 | 1.91 | 9.51 | 1.45 | |||||
-Diluted | - | 1.88 | 9.22 | 1.41 | |||||
Weighted average number of Class A and Class B ordinary shares outstanding (in millions): | |||||||||
-Basic | 2,766 | 2,696 | 2,692 | 2,692 | |||||
-Diluted | 2,781 | 2,736 | 2,777 | 2,777 | |||||
(1) Includes share-based compensation expenses as follows: | |||||||||
Cost of revenues | 81 | 91 | 79 | 12 | |||||
Selling, general and administrative | 464 | 480 | 471 | 72 | |||||
Research and development | 945 | 1,408 | 949 | 146 | |||||
Total share-based compensation expenses | 1,490 | 1,979 | 1,499 | 230 | |||||
(2) All translations from RMB to U.S. dollars are made at a rate of RMB 6.5518 to US$1.00, the exchange rate in effect as of March 31, | |||||||||
Baidu, Inc. | ||||||
Condensed Consolidated Balance Sheets | ||||||
(In millions, unaudited) | ||||||
December 31, | March 31, | March 31, | ||||
2020 | 2021 | 2021 | ||||
RMB | RMB | US$ | ||||
ASSETS | ||||||
Current assets: | ||||||
Cash and cash equivalents | 35,782 | 41,544 | 6,340 | |||
Restricted cash | 758 | 10,607 | 1,618 | |||
Short-term investments, net | 126,402 | 120,794 | 18,437 | |||
Accounts receivable, net | 8,668 | 8,492 | 1,296 | |||
Amounts due from related parties | 726 | 741 | 113 | |||
Other current assets, net | 11,006 | 9,451 | 1,443 | |||
Total current assets | 183,342 | 191,629 | 29,247 | |||
Non-current assets: | ||||||
Fixed assets, net | 17,508 | 17,681 | 2,699 | |||
Licensed copyrights, net | 6,435 | 6,516 | 995 | |||
Produced content, net | 6,556 | 7,281 | 1,111 | |||
Intangible assets, net | 2,022 | 1,921 | 293 | |||
Goodwill | 22,248 | 22,248 | 3,396 | |||
Long-term investments, net | 76,233 | 101,771 | 15,533 | |||
Amounts due from related parties | 3,438 | 3,440 | 525 | |||
Deferred tax assets, net | 1,674 | 1,379 | 210 | |||
Operating lease right-of-use assets | 9,804 | 9,655 | 1,474 | |||
Other non-current assets | 3,448 | 15,827 | 2,417 | |||
Total non-current assets | 149,366 | 187,719 | 28,653 | |||
Total assets | 332,708 | 379,348 | 57,900 | |||
LIABILITIES AND EQUITY | ||||||
Current liabilities: | ||||||
Short-term loans | 3,016 | 2,230 | 340 | |||
Accounts payable and accrued liabilities | 36,716 | 35,902 | 5,480 | |||
Customer deposits and deferred revenue | 12,626 | 12,504 | 1,908 | |||
Deferred income | 158 | 144 | 22 | |||
Long-term loans, current portion | 7,427 | 7,457 | 1,138 | |||
Convertible senior notes, current portion | 4,752 | 4,808 | 734 | |||
Notes payable, current portion | - | - | - | |||
Amounts due to related parties | 1,324 | 1,468 | 224 | |||
Operating lease liabilities | 2,366 | 2,377 | 363 | |||
Total current liabilities | 68,385 | 66,890 | 10,209 | |||
Non-current liabilities: | ||||||
Deferred income | 97 | 104 | 16 | |||
Deferred revenue | 686 | 685 | 105 | |||
Amounts due to related parties | 3,543 | 3,524 | 538 | |||
Long-term loans | - | - | - | |||
Notes payable | 48,408 | 48,601 | 7,418 | |||
Convertible senior notes | 11,927 | 12,670 | 1,934 | |||
Deferred tax liabilities | 3,067 | 3,171 | 484 | |||
Operating lease liabilities | 4,693 | 4,535 | 692 | |||
Other non-current liabilities | 59 | 53 | 8 | |||
Total non-current liabilities | 72,480 | 73,343 | 11,195 | |||
Total liabilities | 140,865 | 140,233 | 21,404 | |||
Redeemable noncontrolling interests | 3,102 | 3,340 | 510 | |||
Equity | ||||||
Total Baidu shareholders' equity | 182,696 | 229,814 | 35,076 | |||
Noncontrolling interests | 6,045 | 5,961 | 910 | |||
Total equity | 188,741 | 235,775 | 35,986 | |||
Total liabilities, redeemable noncontrolling | 332,708 | 379,348 | 57,900 | |||
Baidu, Inc. | ||||||||||||||||||||||||
Selected Information | ||||||||||||||||||||||||
(In millions, unaudited) | ||||||||||||||||||||||||
Three months ended | Three months ended | Three months ended | Three months ended | |||||||||||||||||||||
Baidu | iQIYI | Elim & | Baidu, | Baidu | iQIYI | Elim & | Baidu, | Baidu | iQIYI | Elim & adj(2) | Baidu, Inc. | Baidu Core | iQIYI | Elim & adj(2) | Baidu, Inc. | |||||||||
Total revenues | 15,268 | 7,650 | (373) | 22,545 | 23,111 | 7,458 | (306) | 30,263 | 20,483 | 7,968 | (317) | 28,134 | 3,126 | 1,216 | (48) | 4,294 | ||||||||
YOY | 34% | 4% | 25% | |||||||||||||||||||||
QOQ | (11%) | 7% | (7%) | |||||||||||||||||||||
Costs and expenses: | ||||||||||||||||||||||||
Cost of revenues (1) | 7,088 | 7,903 | (304) | 14,687 | 7,997 | 6,785 | (260) | 14,522 | 8,162 | 7,109 | (269) | 15,002 | 1,246 | 1,085 | (41) | 2,290 | ||||||||
Selling, general and administrative (1) | 2,560 | 1,311 | (19) | 3,852 | 3,787 | 1,317 | (10) | 5,094 | 4,048 | 1,201 | (4) | 5,245 | 618 | 183 | (1) | 800 | ||||||||
Research and development (1) | 3,772 | 678 | (7) | 4,443 | 5,007 | 663 | - | 5,670 | 4,426 | 672 | - | 5,098 | 675 | 103 | - | 778 | ||||||||
Total costs and expenses | 13,420 | 9,892 | (330) | 22,982 | 16,791 | 8,765 | (270) | 25,286 | 16,636 | 8,982 | (273) | 25,345 | 2,539 | 1,371 | (42) | 3,868 | ||||||||
YOY | ||||||||||||||||||||||||
Cost of revenues | 15% | (10%) | 2% | |||||||||||||||||||||
Selling, general and administrative | 58% | (8%) | 36% | |||||||||||||||||||||
Research and development | 17% | (1%) | 15% | |||||||||||||||||||||
Cost and expenses | 24% | (9%) | 10% | |||||||||||||||||||||
Operating income (loss) | 1,848 | (2,242) | (43) | (437) | 6,320 | (1,307) | (36) | 4,977 | 3,847 | (1,014) | (44) | 2,789 | 587 | (155) | (6) | 426 | ||||||||
YOY | 108% | (55%) | - | |||||||||||||||||||||
QOQ | (39%) | (22%) | (44%) | |||||||||||||||||||||
Operating margin | 12% | (29%) | (2%) | 27% | (18%) | 16% | 19% | (13%) | 10% | |||||||||||||||
Add: total other (loss) income,net | (414) | (629) | - | (1,043) | 774 | (241) | - | 533 | 23,999 | (222) | - | 23,777 | 3,662 | (34) | - | 3,628 | ||||||||
Less: income tax expense | 193 | 5 | - | 198 | 1,042 | (16) | - | 1,026 | 1,513 | 21 | - | 1,534 | 231 | 3 | - | 234 | ||||||||
Less: net (loss) income attributable to NCI | (457) | (1) | (1,261) | (3) | (1,719) | 16 | 16 | (722) | (3) | (690) | (21) | 10 | (610) | (3) | (621) | (4) | 2 | (93) | (3) | (95) | ||||
Net income (loss) attributable to Baidu | 1,698 | (2,875) | 1,218 | 41 | 6,036 | (1,548) | 686 | 5,174 | 26,354 | (1,267) | 566 | 25,653 | 4,022 | (194) | 87 | 3,915 | ||||||||
YOY | 1452% | (56%) | 62468% | |||||||||||||||||||||
QOQ | 337% | (18%) | 396% | |||||||||||||||||||||
Net margin | 11% | (38%) | 0% | 26% | (21%) | 17% | 129% | (16%) | 91% | |||||||||||||||
Non-GAAP financial measures: | ||||||||||||||||||||||||
Operating income (loss) (non-GAAP) | 3,348 | (1,868) | 1,437 | 8,031 | (940) | 7,055 | 5,064 | (658) | 4,362 | 773 | (101) | 666 | ||||||||||||
YOY | 51% | (65%) | 204% | |||||||||||||||||||||
QOQ | (37%) | (30%) | (38%) | |||||||||||||||||||||
Operating margin (non-GAAP) | 22% | (24%) | 6% | 35% | (13%) | 23% | 25% | (8%) | 16% | |||||||||||||||
Net income (loss) attributable to Baidu (non-GAAP) | 4,519 | (2,482) | 3,082 | 7,533 | (1,177) | 6,868 | 4,870 | (1,021) | 4,297 | 743 | (156) | 656 | ||||||||||||
YOY | 8% | (59%) | 39% | |||||||||||||||||||||
QOQ | (35%) | (13%) | (37%) | |||||||||||||||||||||
Net margin (non-GAAP) | 30% | (32%) | 14% | 33% | (16%) | 23% | 24% | (13%) | 15% | |||||||||||||||
Adjusted EBITDA | 4,641 | (1,746) | 2,852 | 9,422 | (822) | 8,564 | 6,487 | (543) | 5,900 | 990 | (83) | 901 | ||||||||||||
YOY | 40% | (69%) | 107% | |||||||||||||||||||||
QOQ | (31%) | (34%) | (31%) | |||||||||||||||||||||
Adjusted EBITDA margin | 30% | (23%) | 13% | 41% | (11%) | 28% | 32% | (7%) | 21% | |||||||||||||||
(1) Includes share-based compensation as follows: | ||||||||||||||||||||||||
Cost of revenues | 34 | 47 | 81 | 46 | 45 | 91 | 33 | 46 | 79 | 5 | 7 | 12 | ||||||||||||
Selling, general and administrative | 273 | 191 | 464 | 255 | 225 | 480 | 256 | 215 | 471 | 39 | 33 | 72 | ||||||||||||
Research and development | 877 | 68 | 945 | 1,329 | 79 | 1,408 | 866 | 83 | 949 | 133 | 13 | 146 | ||||||||||||
Total share-based compensation | 1,184 | 306 | 1,490 | 1,630 | 349 | 1,979 | 1,155 | 344 | 1,499 | 177 | 53 | 230 | ||||||||||||
(2) Relates to intersegment eliminations and adjustments | ||||||||||||||||||||||||
(3) Relates to the net loss attributable to iQIYI noncontrolling interests | ||||||||||||||||||||||||
Baidu, Inc. | ||||||||||||||||
Condensed Consolidated Statements of Cash Flows | ||||||||||||||||
(In millions,unaudited) | ||||||||||||||||
Three months ended | Three months ended | Three months ended | Three months ended | |||||||||||||
March 31, 2020 (RMB) | December 31, 2020 (RMB) | March 31, 2021 (RMB) | March 31, 2021 (US$) | |||||||||||||
Baidu | iQIYI | Baidu, | Baidu | iQIYI | Baidu, | Baidu | iQIYI | Baidu, | Baidu | iQIYI | Baidu, | |||||
Net cash provided by (used in) operating activities | 2,801 | (604) | 2,197 | 7,546 | (1,519) | 6,027 | 5,467 | (1,350) | 4,117 | 834 | (206) | 628 | ||||
Net cash (used in) provided by investing activities | (11,084) | (1,610) | (12,694) | (1,196) | 281 | (915) | (4,579) | (2,778) | (7,357) | (699) | (424) | (1,123) | ||||
Net cash (used in) provided by financing activities | (1,296) | (79) | (1,375) | 4,185 | 8,392 | 12,577 | 18,018 | 611 | 18,629 | 2,749 | 93 | 2,842 | ||||
Effect of exchange rate changes on cash, cash | 139 | 64 | 203 | (209) | (32) | (241) | 251 | (29) | 222 | 38 | (4) | 34 | ||||
Net (decrease) increase in cash, cash | (9,440) | (2,229) | (11,669) | 10,326 | 7,122 | 17,448 | 19,157 | (3,546) | 15,611 | 2,922 | (541) | 2,381 | ||||
Cash, cash equivalents and restricted cash | ||||||||||||||||
At beginning of period | 27,529 | 6,910 | 34,439 | 15,273 | 3,819 | 19,092 | 25,599 | 10,941 | 36,540 | 3,907 | 1,670 | 5,577 | ||||
At end of period | 18,089 | 4,681 | 22,770 | 25,599 | 10,941 | 36,540 | 44,756 | 7,395 | 52,151 | 6,829 | 1,129 | 7,958 | ||||
Net cash provided by (used in) operating | 2,801 | (604) | 2,197 | 7,546 | (1,519) | 6,027 | 5,467 | (1,350) | 4,117 | 834 | (206) | 628 | ||||
Less: Capital expenditures | (478) | (67) | (545) | (2,151) | (27) | (2,178) | (1,438) | (61) | (1,499) | (219) | (9) | (228) | ||||
Free cash flow | 2,323 | (671) | 1,652 | 5,395 | (1,546) | 3,849 | 4,029 | (1,411) | 2,618 | 615 | (215) | 400 | ||||
Note: Baidu excl. iQIYI represents Baidu, Inc. minus iQIYI's consolidated cash flows. | ||||||||||||||||
Baidu, Inc. | ||||||||||||||||
Reconciliations of Non-GAAP Financial Measures to the Nearest Comparable GAAP Measures | ||||||||||||||||
(In millions except for per ADS information, unaudited) | ||||||||||||||||
Three months ended | Three months ended | Three months ended | Three months ended | |||||||||||||
March 31, 2020 (RMB) | December 31, 2020 (RMB) | March 31, 2021 (RMB) | March 31, 2021 (US$) | |||||||||||||
Baidu | iQIYI | Baidu, | Baidu | iQIYI | Baidu, | Baidu | iQIYI | Baidu, | Baidu | iQIYI | Baidu, | |||||
Operating income (loss) | 1,848 | (2,242) | (437) | 6,320 | (1,307) | 4,977 | 3,847 | (1,014) | 2,789 | 587 | (155) | 426 | ||||
Add: Share-based compensation expenses | 1,184 | 306 | 1,490 | 1,630 | 349 | 1,979 | 1,155 | 344 | 1,499 | 177 | 53 | 230 | ||||
Add: Amortization and impairment of intangible assets(1) | 316 | 68 | 384 | 81 | 18 | 99 | 62 | 12 | 74 | 9 | 1 | 10 | ||||
Operating income (loss) (non-GAAP) | 3,348 | (1,868) | 1,437 | 8,031 | (940) | 7,055 | 5,064 | (658) | 4,362 | 773 | (101) | 666 | ||||
Add: Depreciation of fixed assets | 1,293 | 122 | 1,415 | 1,391 | 118 | 1,509 | 1,423 | 115 | 1,538 | 217 | 18 | 235 | ||||
Adjusted EBITDA | 4,641 | (1,746) | 2,852 | 9,422 | (822) | 8,564 | 6,487 | (543) | 5,900 | 990 | (83) | 901 | ||||
Net income (loss) attributable to Baidu | 1,698 | (2,875) | 41 | 6,036 | (1,548) | 5,174 | 26,354 | (1,267) | 25,653 | 4,022 | (194) | 3,915 | ||||
Add: Share-based compensation expenses | 1,177 | 306 | 1,348 | 1,618 | 349 | 1,802 | 1,146 | 344 | 1,325 | 175 | 53 | 203 | ||||
Add: Amortization and impairment of intangible assets(1) | 223 | 68 | 267 | 67 | 18 | 78 | 55 | 12 | 61 | 8 | 1 | 9 | ||||
Add: Disposal loss (gain) | (252) | - | (252) | (28) | - | (28) | - | - | - | - | - | - | ||||
Add: Impairment of long-term investments | 1,615 | 25 | 1,630 | 147 | - | 147 | - | - | - | - | - | - | ||||
Add: Fair value loss (gain) of long-term investments | (89) | - | (89) | (380) | (1) | (380) | (23,545) | (88) | (23,590) | (3,594) | (13) | (3,601) | ||||
Add: Reconciling items on equity method investments(2) | 450 | 10 | 456 | 250 | 9 | 256 | 593 | (20) | 583 | 91 | (3) | 89 | ||||
Add: Tax effects on non-GAAP adjustments(3) | (303) | (16) | (319) | (177) | (4) | (181) | 267 | (2) | 265 | 41 | - | 41 | ||||
Net income (loss) attributable to Baidu (non-GAAP) | 4,519 | (2,482) | 3,082 | 7,533 | (1,177) | 6,868 | 4,870 | (1,021) | 4,297 | 743 | (156) | 656 | ||||
Diluted earnings per ADS | 0.02 | 15.05 | 73.76 | 11.26 | ||||||||||||
Add: Accretion of the redeemable noncontrolling interests | 0.07 | 0.08 | 0.14 | 0.02 | ||||||||||||
Add: Non-GAAP adjustments to earnings per ADS | 8.75 | 4.95 | (61.52) | (9.39) | ||||||||||||
Diluted earnings per ADS (non-GAAP) | 8.84 | 20.08 | 12.38 | 1.89 | ||||||||||||
(1) This represents amortization and impairment of intangible assets resulting from business combinations. | ||||||||||||||||
(2) This represents Baidu's share of equity method investments for other non-GAAP reconciling items, amortization and impairment of intangible assets not on the investee's books, accretion of their | ||||||||||||||||
(3) Tax impact of non-GAAP adjustments is separately presented from 2020Q4, with comparative periods retrospectively adjusted. | ||||||||||||||||
SOURCE Baidu, Inc.





Share this article