California home sales and prices ease but strong buying interest continues to provide support to the market as sales record eighth straight year-over-year gain, C.A.R. reports
- Existing, single-family home sales totaled 462,720 in February on a seasonally adjusted annualized rate, down 4.5 percent from January and up 9.7 percent from February 2020.
- February's statewide median home price was $699,000, down 0.1 percent from January and up 20.6 percent from February 2020.
- Year-to-date statewide home sales were up 15.9 percent in February.

LOS ANGELES, March 16, 2021 /PRNewswire/ -- California home sales moderated in February as mortgage rates spiked in recent weeks, while tight housing supply continued to constrain demand, especially in more affordable markets, the CALIFORNIA ASSOCIATION OF REALTORS® (C.A.R.) said today.
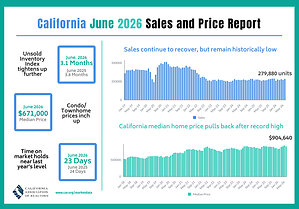
- Infographic: https://www.car.org/marketing/clients/infographics/February%202021%20Sales%20and%20Price
Closed escrow sales of existing, single-family detached homes in California totaled a seasonally adjusted annualized rate of 462,720 in February, according to information collected by C.A.R. from more than 90 local REALTOR® associations and MLSs statewide. The statewide annualized sales figure represents what would be the total number of homes sold during 2021 if sales maintained the February pace throughout the year. It is adjusted to account for seasonal factors that typically influence home sales.
February home sales decreased 4.5 percent from 484,760 in January and were up 9.7 percent from a year ago, when 421,670 homes were sold on an annualized basis. While still solid, the nearly 10 percent sales increase was the smallest gain in the past seven months.
"The housing market has been cruising at a robust pace since the second half of 2020 but has encountered some speedbumps recently as rates began to rise," said C.A.R. President Dave Walsh, vice president and manager of the Compass San Jose office. "While higher rates may slow growth in home sales temporarily, the major roadblock in the long run is a shortage of homes for sale. With inventory dropping more than a half from a year ago, the market will soften in the second half of 2021 if we don't see enough homes come on the market to meet demand."
California's median home price was essentially unchanged from January but registered another 20 percent gain from a year ago, recording the first back-to-back 20 percent yearly increase since February 2014. The statewide median home price dipped 0.1 percent on a month-to-month basis to $699,000 in February, down from January's $699,920. Low rates, robust demand and a shortage of homes for sale continued to push up home prices on a year-over-year basis, gaining 20.6 percent from the $579,770 recorded last February. The double-digit increase from last year was the seventh in a row and the second largest since February 2014.
"The upward movement in rates has called into question whether the market will sustain its momentum going into the spring homebuying season," said C.A.R. Vice President and Chief Economist Jordan Levine. "While rates are off their record lows, they are still relatively low by historical standards. Recent increases in mortgage rates will likely slow the pace of price growth in the coming months but will also motivate those who truly want to buy to enter the market before rates start moving further up."
Other key points from C.A.R.'s February 2021 resale housing report include:
- At the regional level, all major regions, except for the Central Valley, experienced a surge in sales from a year ago. The Central Coast region posted the highest year-over-year sales gain, with a growth rate of 22.4 percent. The Far North (17.3 percent), the San Francisco Bay Area (16.1 percent), and Southern California (10.5 percent) regions also experienced double-digit year-over-year increases in sales from a year ago. The Central Valley was the only region with a sales decline of 0.3 percent, as six out of 12 counties in the region recorded a sales dip in February.
- Resort markets continue to perform well in February, as home sales stayed robust for the first two months of the year. While the growth tempered from the triple-digit year-over-year pace experienced in January, sales growth in the resort markets was relatively strong when compared to the rest of California. South Lake Tahoe (56.7 percent), Lake Arrowhead (44.1 percent), and Big Bear (36.1 percent) all experienced sales increases of more than 35 percent from a year ago. And while sales compared to a year ago were flat in February for Mammoth Lakes, aggregated sales for the first two months of 2021 were up 40 percent from the same period last year.
- Three-quarters of all counties – 38 of 51 – tracked by C.A.R. had a year-over-year increase in closed sales, with Tehama having the strongest sales growth from last year at 96.0 percent, followed by Lassen (81.8 percent) and Mendocino (69.0 percent). For counties with a sales increase from last year, the average gain was 26.6 percent in February, compared to 22.7 percent in January. Thirteen counties experienced sales declines with Merced dropping the most from a year ago by 33.9 percent, followed by Siskiyou (-33.3 percent) and Merced (-28.2 percent).
- All major regions recorded double-digit increases in the median price increased from last year with the San Francisco Bay Area growing the strongest at 26.5 percent. The year-over-year increase in the Bay Area's median price was the largest since September 2013, and it helped to set a new record high in the median price for the Bay Area. The Central Valley region had the second highest price growth rate of all regions with its median price increasing19.1 percent year-over-year in February, followed by Southern California (16.4 percent), the Central Coast (15.9 percent) and the Far North (11.7 percent).
- All 51 counties tracked by C.A.R. reported a gain in median price on a year-over-year basis, with forty-six of them increasing more than 10 percent. Mono had the largest price growth of 105.0 percent in February, followed by Santa Barbara (51.9 percent) and Siskiyou (47.3 percent). Seventeen counties set a new record high median price in February. Of the five counties that had a single-digit median price growth in February, Plumas had the smallest gain of 2.6 percent, followed by Lassen (4.6 percent) and Solano (8.5 percent).
- The Unsold Inventory Index (UII) inched up from 1.9 months in January to 2.0 months in February but dropped sharply from a year ago, when there was 3.6 months of housing inventory. The index indicates the number of months it would take to sell the supply of homes on the market at the current rate of sales.
- Active listings fell 52.5 percent in February from last year and continued to drop more than 40 percent on a year-over-year basis for the eighth consecutive month. On a month-to-month basis, for-sale properties inched up slightly by 0.4 percent in February and should climb further in the coming months as the market prepares for the spring homebuying season and the pandemic situation continues to improve.
- The available supply of homes for sale continued to tighten up across the state, with all major regions at record low levels not seen in the past 10 years. Three of the five regions, in fact, declined 55 percent or more in active listings from last year. The Central Coast region had the biggest year-over-year drop of 55.6 percent in February, followed by Southern California (-55.4 percent) and the Central Valley (-55.0 percent). The Far North (-46.3 percent) and the San Francisco Bay Area (-29.2 percent) had relatively smaller declines in their regional housing supply, but their inventory levels remained significantly below last year's level.
- The median number of days it took to sell a California single-family home was 10 days in February, down from 23 days in February 2020.
- C.A.R.'s statewide sales-price-to-list-price ratio* was 101 percent in February 2021 and 99.1 percent in February 2020.
- The statewide average price per square foot** for an existing single-family home remained elevated and improved solidly on an annual basis. At $338, February's price per square foot was the highest since July 2007. The price per square foot was $283 in February a year ago.
- The 30-year, fixed-mortgage interest rate averaged 2.81 percent in February, down from 3.47 percent in February 2020, according to Freddie Mac. The five-year, adjustable mortgage interest rate was an average of 2.83 percent, compared to 3.26 percent in February 2020.
Note: The County MLS median price and sales data in the tables are generated from a survey of more than 90 associations of REALTORS® throughout the state and represent statistics of existing single-family detached homes only. County sales data are not adjusted to account for seasonal factors that can influence home sales. Movements in sales prices should not be interpreted as changes in the cost of a standard home. The median price is where half sold for more and half sold for less; medians are more typical than average prices, which are skewed by a relatively small share of transactions at either the lower end or the upper end. Median prices can be influenced by changes in cost, as well as changes in the characteristics and the size of homes sold. The change in median prices should not be construed as actual price changes in specific homes.
*Sales-to-list-price ratio is an indicator that reflects the negotiation power of home buyers and home sellers under current market conditions. The ratio is calculated by dividing the final sales price of a property by its last list price and is expressed as a percentage. A sales-to-list ratio with 100 percent or above suggests that the property sold for more than the list price, and a ratio below 100 percent indicates that the price sold below the asking price.
**Price per square foot is a measure commonly used by real estate agents and brokers to determine how much a square foot of space a buyer will pay for a property. It is calculated as the sale price of the home divided by the number of finished square feet. C.A.R. currently tracks price-per-square foot statistics for 50 counties.
Leading the way…® in California real estate for more than 110 years, the CALIFORNIA ASSOCIATION OF REALTORS® (www.car.org) is one of the largest state trade organizations in the United States with more than 200,000 members dedicated to the advancement of professionalism in real estate. C.A.R. is headquartered in Los Angeles.
February 2021 County Sales and Price Activity |
|||||||||
(Regional and condo sales data not seasonally adjusted) |
|||||||||
February 2021 |
Median Sold Price of Existing Single-Family Homes |
Sales |
|||||||
State/Region/County |
Feb. 2021 |
Jan. 2021 |
Feb. 2020 |
Price MTM% Chg |
Price YTY% Chg |
Sales MTM% Chg |
Sales YTY% Chg |
||
Calif. Single-family home |
$699,000 |
$699,920 |
r |
$579,770 |
-0.1% |
20.6% |
-4.5% |
9.7% |
|
Calif. Condo/Townhome |
$530,000 |
$515,000 |
$480,000 |
2.9% |
10.4% |
2.7% |
17.6% |
||
Los Angeles Metro Area |
$649,000 |
$630,000 |
$550,000 |
3.0% |
18.0% |
-4.6% |
10.0% |
||
Central Coast |
$828,500 |
$829,900 |
$715,000 |
-0.2% |
15.9% |
2.1% |
22.4% |
||
Central Valley |
$405,000 |
$387,250 |
r |
$340,000 |
4.6% |
19.1% |
-6.0% |
-0.3% |
|
Far North |
$335,000 |
$335,000 |
$300,000 |
0.0% |
11.7% |
8.0% |
17.3% |
||
Inland Empire |
$470,000 |
$457,000 |
$395,000 |
2.8% |
19.0% |
-4.2% |
8.1% |
||
San Francisco Bay Area |
$1,151,500 |
$1,050,000 |
r |
$910,000 |
9.7% |
26.5% |
-4.1% |
16.1% |
|
Southern California |
$675,000 |
$650,000 |
$580,000 |
3.8% |
16.4% |
-2.7% |
10.5% |
||
San Francisco Bay Area |
|||||||||
Alameda |
$1,100,000 |
$1,060,000 |
$945,000 |
3.8% |
16.4% |
-12.4% |
32.6% |
||
Contra Costa |
$817,500 |
$765,000 |
$635,250 |
6.9% |
28.7% |
-3.2% |
18.5% |
||
Marin |
$1,540,000 |
$1,350,000 |
$1,347,500 |
14.1% |
14.3% |
7.4% |
18.6% |
||
Napa |
$931,500 |
$835,000 |
$659,500 |
11.6% |
41.2% |
7.9% |
61.9% |
||
San Francisco |
$1,786,400 |
$1,672,500 |
r |
$1,610,000 |
6.8% |
11.0% |
18.4% |
21.6% |
|
San Mateo |
$1,900,000 |
$1,605,000 |
$1,575,000 |
18.4% |
20.6% |
2.1% |
12.3% |
||
Santa Clara |
$1,486,250 |
$1,375,000 |
$1,350,000 |
8.1% |
10.1% |
-1.9% |
23.5% |
||
Solano |
$509,750 |
$510,000 |
$470,000 |
0.0% |
8.5% |
-21.9% |
-28.2% |
||
Sonoma |
$740,000 |
$715,000 |
$640,000 |
3.5% |
15.6% |
3.9% |
8.5% |
||
Southern California |
|||||||||
Los Angeles |
$664,120 |
$697,660 |
$580,690 |
-4.8% |
14.4% |
-9.7% |
13.9% |
||
Orange |
$995,000 |
$971,000 |
$880,000 |
2.5% |
13.1% |
4.6% |
7.3% |
||
Riverside |
$519,500 |
$495,500 |
$428,000 |
4.8% |
21.4% |
-0.9% |
7.1% |
||
San Bernardino |
$389,900 |
$390,000 |
$329,000 |
0.0% |
18.5% |
-9.5% |
10.0% |
||
San Diego |
$765,000 |
$730,000 |
$670,000 |
4.8% |
14.2% |
6.1% |
12.8% |
||
Ventura |
$750,000 |
$776,000 |
$649,500 |
-3.4% |
15.5% |
4.3% |
7.3% |
||
Central Coast |
|||||||||
Monterey |
$820,000 |
$860,000 |
$700,000 |
-4.7% |
17.1% |
7.8% |
25.2% |
||
San Luis Obispo |
$700,000 |
$698,000 |
$640,000 |
0.3% |
9.4% |
9.9% |
23.2% |
||
Santa Barbara |
$1,174,080 |
$920,000 |
$772,750 |
27.6% |
51.9% |
-5.0% |
16.7% |
||
Santa Cruz |
$1,058,000 |
$1,110,000 |
$897,500 |
-4.7% |
17.9% |
-8.1% |
26.7% |
||
Central Valley |
|||||||||
Fresno |
$350,000 |
$325,000 |
$289,950 |
7.7% |
20.7% |
-12.8% |
-0.2% |
||
Glenn |
$319,500 |
$247,500 |
$288,250 |
29.1% |
10.8% |
6.7% |
33.3% |
||
Kern |
$295,000 |
$302,000 |
$259,000 |
-2.3% |
13.9% |
-7.4% |
14.2% |
||
Kings |
$280,000 |
$278,750 |
$255,000 |
0.4% |
9.8% |
-32.6% |
-12.7% |
||
Madera |
$354,500 |
$325,000 |
$285,000 |
9.1% |
24.4% |
-3.0% |
-8.6% |
||
Merced |
$318,750 |
$307,000 |
$285,950 |
3.8% |
11.5% |
-10.6% |
-33.9% |
||
Placer |
$599,500 |
$581,000 |
r |
$509,000 |
3.2% |
17.8% |
-0.3% |
16.1% |
|
Sacramento |
$463,000 |
$450,000 |
r |
$398,500 |
2.9% |
16.2% |
0.2% |
0.3% |
|
San Benito |
$700,000 |
$695,000 |
$595,000 |
0.7% |
17.6% |
-29.2% |
36.0% |
||
San Joaquin |
$436,300 |
$425,000 |
r |
$390,000 |
2.7% |
11.9% |
-12.4% |
-13.2% |
|
Stanislaus |
$405,000 |
$385,000 |
r |
$339,000 |
5.2% |
19.5% |
-6.0% |
-11.9% |
|
Tulare |
$288,500 |
$306,920 |
$252,000 |
-6.0% |
14.5% |
4.2% |
12.3% |
||
Far North |
|||||||||
Butte |
$397,000 |
$420,000 |
$338,750 |
-5.5% |
17.2% |
-2.8% |
-10.2% |
||
Lassen |
$208,250 |
$249,500 |
$199,000 |
-16.5% |
4.6% |
-4.8% |
81.8% |
||
Plumas |
$329,500 |
$315,000 |
$321,500 |
4.6% |
2.5% |
31.8% |
31.8% |
||
Shasta |
$329,950 |
$329,000 |
$291,500 |
0.3% |
13.2% |
16.6% |
28.9% |
||
Siskiyou |
$322,500 |
$257,000 |
$219,000 |
25.5% |
47.3% |
-45.5% |
-33.3% |
||
Tehama |
$299,000 |
$250,000 |
$265,000 |
19.6% |
12.8% |
58.1% |
96.0% |
||
Other Calif. Counties |
|||||||||
Amador |
$406,280 |
$386,250 |
$328,000 |
5.2% |
23.9% |
-10.0% |
31.7% |
||
Calaveras |
$441,500 |
$398,500 |
$355,000 |
10.8% |
24.4% |
-13.6% |
4.1% |
||
Del Norte |
$359,000 |
$399,000 |
$297,000 |
-10.0% |
20.9% |
11.8% |
58.3% |
||
El Dorado |
$577,500 |
$600,000 |
r |
$465,000 |
-3.8% |
24.2% |
7.5% |
10.4% |
|
Humboldt |
$360,000 |
$366,000 |
$310,390 |
-1.6% |
16.0% |
-14.3% |
-4.5% |
||
Lake |
$326,500 |
$300,000 |
$235,000 |
8.8% |
38.9% |
62.3% |
30.3% |
||
Mariposa |
$397,500 |
$400,000 |
$327,500 |
-0.6% |
21.4% |
9.1% |
33.3% |
||
Mendocino |
$525,000 |
$517,500 |
$467,000 |
1.4% |
12.4% |
6.5% |
69.0% |
||
Mono |
$1,435,000 |
$1,112,500 |
$700,000 |
29.0% |
105.0% |
16.7% |
-6.7% |
||
Nevada |
$519,500 |
$525,000 |
r |
$420,000 |
-1.0% |
23.7% |
2.9% |
36.7% |
|
Sutter |
$395,000 |
$350,000 |
$318,500 |
12.9% |
24.0% |
0.0% |
-16.1% |
||
Tuolumne |
$375,000 |
$350,500 |
$297,500 |
7.0% |
26.1% |
15.7% |
22.7% |
||
Yolo |
$520,000 |
$485,000 |
r |
$447,500 |
7.2% |
16.2% |
15.2% |
15.2% |
|
Yuba |
$370,000 |
$395,000 |
$315,000 |
-6.3% |
17.5% |
11.4% |
-25.8% |
||
r = revised |
|
NA = not available |
February 2021 County Unsold Inventory and Days on Market |
||||||||||
(Regional and condo sales data not seasonally adjusted) |
||||||||||
February 2021 |
Unsold Inventory Index |
Median Time on Market |
||||||||
State/Region/County |
Feb. 2021 |
Jan. 2021 |
Feb. 2020 |
Feb. 2021 |
Jan. 2021 |
Feb. 2020 |
||||
Calif. Single-family home |
2.0 |
1.9 |
r |
3.6 |
10.0 |
11.0 |
r |
23.0 |
||
Calif. Condo/Townhome |
2.1 |
2.2 |
r |
3.0 |
13.0 |
18.0 |
r |
21.0 |
||
Los Angeles Metro Area |
2.0 |
1.9 |
3.8 |
11.0 |
12.0 |
29.0 |
||||
Central Coast |
2.4 |
2.4 |
4.8 |
13.0 |
13.0 |
31.0 |
||||
Central Valley |
1.9 |
1.7 |
r |
3.1 |
7.0 |
9.0 |
r |
18.5 |
||
Far North |
2.8 |
3.0 |
5.1 |
37.0 |
25.0 |
51.0 |
||||
Inland Empire |
2.0 |
1.9 |
4.1 |
15.0 |
14.0 |
41.0 |
||||
San Francisco Bay Area |
2.1 |
1.7 |
3.0 |
10.0 |
13.0 |
r |
14.0 |
|||
Southern California |
2.0 |
1.9 |
3.7 |
10.0 |
11.0 |
25.0 |
||||
San Francisco Bay Area |
||||||||||
Alameda |
1.7 |
1.3 |
2.5 |
8.0 |
9.0 |
12.0 |
||||
Contra Costa |
1.7 |
1.4 |
2.7 |
7.5 |
8.0 |
12.0 |
||||
Marin |
2.1 |
2.1 |
4.3 |
22.0 |
38.0 |
42.5 |
||||
Napa |
3.8 |
3.7 |
9.6 |
38.0 |
46.0 |
39.0 |
||||
San Francisco |
2.1 |
2.2 |
3.0 |
12.0 |
14.5 |
r |
15.0 |
|||
San Mateo |
2.4 |
2.2 |
2.6 |
9.0 |
13.0 |
11.0 |
||||
Santa Clara |
2.2 |
1.7 |
2.7 |
8.0 |
9.0 |
8.0 |
||||
Solano |
1.6 |
1.2 |
3.0 |
29.0 |
29.0 |
39.0 |
||||
Sonoma |
3.0 |
2.9 |
4.4 |
38.0 |
41.0 |
51.5 |
||||
Southern California |
||||||||||
Los Angeles |
2.1 |
1.8 |
3.6 |
10.0 |
11.0 |
22.0 |
||||
Orange |
2.0 |
2.0 |
3.4 |
9.0 |
10.0 |
17.0 |
||||
Riverside |
2.0 |
2.0 |
4.1 |
14.0 |
15.0 |
39.0 |
||||
San Bernardino |
2.0 |
1.6 |
4.1 |
15.0 |
13.0 |
45.0 |
||||
San Diego |
1.8 |
1.8 |
3.0 |
7.0 |
7.0 |
12.0 |
||||
Ventura |
1.8 |
1.6 |
5.1 |
24.0 |
29.0 |
49.0 |
||||
Central Coast |
||||||||||
Monterey |
2.8 |
3.0 |
5.1 |
14.0 |
10.0 |
28.0 |
||||
San Luis Obispo |
2.1 |
2.4 |
4.8 |
12.0 |
16.0 |
37.5 |
||||
Santa Barbara |
2.4 |
2.3 |
4.8 |
13.0 |
14.0 |
28.5 |
||||
Santa Cruz |
2.5 |
1.9 |
4.1 |
14.5 |
11.0 |
26.5 |
||||
Central Valley |
||||||||||
Fresno |
2.0 |
1.7 |
3.5 |
7.0 |
8.0 |
26.0 |
||||
Glenn |
2.4 |
2.1 |
5.3 |
12.5 |
8.0 |
75.5 |
||||
Kern |
2.2 |
2.0 |
3.2 |
9.0 |
12.0 |
22.0 |
||||
Kings |
2.7 |
1.4 |
3.2 |
6.0 |
7.0 |
17.0 |
||||
Madera |
2.4 |
2.6 |
4.9 |
10.0 |
18.0 |
40.0 |
||||
Merced |
2.3 |
1.9 |
3.3 |
10.0 |
13.0 |
32.0 |
||||
Placer |
1.8 |
1.6 |
3.4 |
6.0 |
12.0 |
r |
16.0 |
|||
Sacramento |
1.6 |
1.4 |
2.3 |
6.0 |
7.0 |
r |
10.0 |
|||
San Benito |
3.3 |
2.0 |
6.5 |
11.0 |
19.0 |
55.0 |
||||
San Joaquin |
1.9 |
1.4 |
3.2 |
7.0 |
8.0 |
r |
26.5 |
|||
Stanislaus |
1.8 |
1.7 |
2.6 |
7.0 |
9.0 |
r |
17.0 |
|||
Tulare |
2.0 |
2.3 |
4.1 |
11.5 |
12.0 |
21.0 |
||||
Far North |
||||||||||
Butte |
2.4 |
2.2 |
3.0 |
13.5 |
16.0 |
24.5 |
||||
Lassen |
3.3 |
3.3 |
10.7 |
106.0 |
100.0 |
133.0 |
||||
Plumas |
4.7 |
5.9 |
9.6 |
96.0 |
157.0 |
191.0 |
||||
Shasta |
2.5 |
2.9 |
4.8 |
27.0 |
20.0 |
50.0 |
||||
Siskiyou |
4.8 |
2.4 |
6.5 |
44.0 |
22.5 |
89.0 |
||||
Tehama |
2.7 |
4.8 |
9.0 |
77.0 |
47.0 |
81.0 |
||||
Other Calif. Counties |
||||||||||
Amador |
2.1 |
2.2 |
7.8 |
12.0 |
29.0 |
r |
49.0 |
|||
Calaveras |
2.0 |
2.0 |
5.7 |
57.0 |
62.5 |
108.0 |
||||
Del Norte |
3.8 |
4.7 |
11.8 |
167.0 |
151.0 |
168.0 |
||||
El Dorado |
2.1 |
2.1 |
4.5 |
13.0 |
27.0 |
r |
44.0 |
|||
Humboldt |
2.4 |
2.3 |
4.5 |
10.0 |
10.0 |
38.5 |
||||
Lake |
2.4 |
4.2 |
6.1 |
35.5 |
38.0 |
61.5 |
||||
Mariposa |
1.9 |
2.4 |
5.4 |
11.5 |
22.0 |
107.0 |
||||
Mendocino |
3.2 |
3.7 |
10.3 |
61.0 |
55.0 |
102.0 |
||||
Mono |
2.9 |
3.8 |
5.8 |
62.5 |
84.5 |
119.0 |
||||
Nevada |
2.4 |
2.6 |
6.4 |
35.5 |
22.0 |
r |
42.0 |
|||
Sutter |
1.8 |
1.5 |
2.6 |
10.0 |
7.0 |
26.5 |
||||
Tuolumne |
2.4 |
2.8 |
5.6 |
17.5 |
32.5 |
85.0 |
||||
Yolo |
1.6 |
1.8 |
3.4 |
7.5 |
12.0 |
r |
17.5 |
|||
Yuba |
2.2 |
2.3 |
3.5 |
12.0 |
15.0 |
23.0 |
||||
r = revised |
|
NA = not available |
SOURCE CALIFORNIA ASSOCIATION OF REALTORS® (C.A.R.)


Share this article