California home sales rebound in June, reversing three straight months of declines; Altadena, Pacific Palisades year-to-date home sales, median price plummet six months post January wildfires

- Existing, single-family home sales totaled 264,260 in June on a seasonally adjusted annualized rate, up 4.0 percent from 254,190 in May and down 0.3 percent from 264,960 in June 2024.
- June's statewide median home price was $899,560, down 0.1 percent from May and down 0.1 percent from $900,720 in June 2024.
- Year-to-date statewide home sales were up 0.2 percent.
SACRAMENTO, Calif., July 17, 2025 /PRNewswire/ -- Amid stabilizing home prices and a greater availability of homes for sale, California's housing market rebounded in June, but remained below year-ago levels, the CALIFORNIA ASSOCIATION OF REALTORS® (C.A.R.) said today.
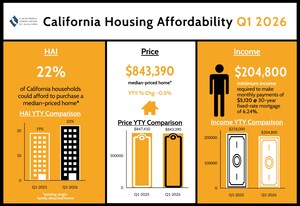
Infographic:
Closed escrow sales of existing, single-family detached homes in California totaled a seasonally adjusted annualized rate of 264,260 in June, according to information collected by C.A.R. from more than 90 local REALTOR® associations and MLSs statewide. The statewide annualized sales figure represents what would be the total number of homes sold during 2025 if sales maintained the June pace throughout the year. It is adjusted to account for seasonal factors that typically influence home sales.
June home sales activity rose 4.0 percent from the 254,190 homes sold in May and was down 0.3 percent from a year ago, when 264,960 homes were sold on an annualized basis. June's rebound reversed three consecutive months of sales declines and was only one of two months of sales increases for the first half of 2025. The year-over-year decline marked the third straight decrease and was the first time since late 2023 that annual sales fell for three consecutive months. Year-to-date sales were barely above a year ago and could fall behind last year's level in July if market activity remains stagnant.
Statewide pending sales in June slipped from last year's level for the seventh consecutive month, posting the largest year-over-year drop since January 2025. With mortgage rates rising steadily in the past couple of weeks, housing demand will likely remain soft for the month of July.
"With more properties on the market and price growth flattening, conditions have become more favorable for prospective buyers who have been waiting on the sidelines to re-enter the market and take advantage of increased negotiating power," said C.A.R. President Heather Ozur, a Palm Springs REALTOR®. "While sales could remain soft at the start of the third quarter, recent improvements in housing sentiment suggest that the market could see a bounce-back in the second half of the year."
California's median home price fell for the second straight month in June, slipping below the $900,000 mark for the first time in three months. The June median price of $899,560 was down 0.1 percent from May and also down 0.1 percent from $900,720 in June 2024. June's 0.1 percent decline was not in line with the historical average gain of 0.8 percent, suggesting non-seasonal factors such as market uncertainty and elevated mortgage rates had a negative lingering effect on housing demand and home prices.
"While the California housing market has not yet fully transitioned to a buyers' market, it is exhibiting increasing signs of being more balanced. Inventory levels continue to normalize, with active listings posting year-over-year gains and the time on market has lengthened compared to the prior year, indicating a deceleration in the pace of sales activity," said C.A.R. Senior Vice President and Chief Economist Jordan Levine. "Additionally, the proportion of homes closing above asking price has declined, reflecting a reduction in the intensity of bidding competition. As a result, sellers are demonstrating greater willingness to negotiate on pricing, concessions, and other terms, which creates more advantageous conditions for those considering a home purchase."
Altadena/Pacific Palisades market update 6-months post wildfires
In the six months since the January Southern California wildfires, not surprisingly, the city of Altadena experienced a steep decline in home sales on a year-to-date basis, dropping by 54.8 percent compared to 2024. Pacific Palisades saw an even more pronounced contraction in market activity, with closed sales plummeting by 83.8 percent over the same period. This slowdown reflects both the lingering disruption from last year's wildfires and broader buyer hesitancy amid uncertainty about rebuilding timelines, insurance costs, and long-term property values.
The median price of a home in Altadena decreased significantly for the first six months of the year, falling by 39.1 percent from $1,425,000 in 2024 to $867,500 in 2025. Pacific Palisades also saw substantial price erosion, with its median home price declining by 23.7 percent from $3,310,000 in 2024 to $2,525,000 in 2025. These price corrections highlight the impact of reduced demand, increased inventory of damaged or partially restored properties, and elevated risk perceptions among potential buyers in fire-affected neighborhoods.
Six months after wildfires destroyed or seriously damaged thousands of homes in Altadena and Pacific Palisades, many property owners in the areas are selling their burned lots rather than undertaking a time-consuming rebuilding process. As of July 12, roughly 172 properties/land lots were sold in Altadena in the first six months after the fires were first reported, compared to six in the same time frame in 2024. There were approximately 348 properties/land lots listed for sale so far this year in Altadena, a significant jump from only one lot listed for sale in the same period a year ago. In Pacific Palisades, roughly 94 properties/land lots were sold after the devasting fires, compared to only one in the first six months of 2024. There were about 312 properties/land lots listed for sale in Pacific Palisades, a surge from one lot listed for sale in the first half of last year.
Other key points from C.A.R.'s June 2025 resale housing report include:
- At the regional level, non-seasonally adjusted home sales in all but one of California's major regions posted year-over-year sales increases in June, as homebuying interest saw a modest rebound. The Far North recorded the strongest sales growth at 13.7 percent, as five of its seven counties achieved double-digit sales gains. The Central Coast followed at 11.4 percent. Southern California (1.9 percent) and the San Francisco Bay Area (1.0 percent) posted modest growth, while the Central Valley was the only region to post a sales decline, slipping 0.8 percent.
- Thirty-nine of the 53 counties tracked by C.A.R. reported annual sales gains in June, with 21 counties exceeding 10 percent growth. Kings County led with an 87.3 percent increase, followed by Glenn (62.5 percent) and Humboldt (45.5 percent). Conversely, 12 counties posted year-over-year sales declines, including Merced (-28.1 percent), Lake (-18.8 percent) and Amador (-15.6 percent).
- June's unsold inventory index (UII) held steady compared with May, as a pickup in demand was offset by a dip in new listings. The UII measures the number of months needed to sell the supply of homes on the market at the current sales rate. The index was 3.8 months in June, unchanged from May and up from 3.0 months in June 2024. Total active listings increased more than 40 percent year-over-year, reaching a 68-month high and marking the 17th straight month of annual supply gains.
- New active listings declined year-over-year in June for the first time in six months, falling 5.0 percent from June 2024 and 10.2 percent from May. Total active listings, on the other hand, continued to rise both monthly and annually, which may suggest that more supply and demand balancing could be forthcoming in the months ahead.
- The median number of days it took to sell a California single-family home was 24 days in June, up from 18 days in June 2024.
- C.A.R.'s statewide sales-price-to-list-price ratio* was 99.3 percent in June 2025 and 100 percent in June 2024.
- The statewide median price per square foot** for an existing single-family home was $437, down from $440 in June a year ago.
- The 30-year, fixed-mortgage interest rate averaged 6.82 percent in June, down from 6.92 percent in June 2024, according to C.A.R.'s calculations based on Freddie Mac's weekly mortgage survey data.
Note: The County MLS median price and sales data in the tables are generated from a survey of more than 90 associations of REALTORS® throughout the state and represent statistics of existing single-family detached homes only. County sales data is not adjusted to account for seasonal factors that can influence home sales. Movements in sales prices should not be interpreted as changes in the cost of a standard home. The median price is where half sold for more and half sold for less; medians are more typical than average prices, which are skewed by a relatively small share of transactions at either the lower end or the upper end. Median prices can be influenced by changes in cost, as well as changes in the characteristics and the size of homes sold. The change in median prices should not be construed as actual price changes in specific homes.
*Sales-to-list-price ratio is an indicator that reflects the negotiation power of home buyers and home sellers under current market conditions. The ratio is calculated by dividing the final sales price of a property by its original list price and is expressed as a percentage. A sales-to-list ratio with 100 percent or above suggests that the property sold for more than the list price, and a ratio below 100 percent indicates that the price sold below the asking price.
**Price per square foot is a measure commonly used by real estate agents and brokers to determine how much a square foot of space a buyer will pay for a property. It is calculated as the sale price of the home divided by the number of finished square feet. C.A.R. currently tracks price-per-square foot statistics for 53 counties.
Leading the way…® in California real estate for 120 years, the CALIFORNIA ASSOCIATION OF REALTORS® (www.car.org) is one of the largest state trade organizations in the United States with 200,000 members dedicated to the advancement of professionalism in real estate. C.A.R. is headquartered in Sacramento.
June 2025 County Sales and Price Activity
(and condo sales data not seasonally adjusted)
June 2025 |
Median Sold Price of Existing Single-Family Homes |
Sales |
|||||||
State/Region/County |
June 2025 |
May 2025 |
June 2024 |
Price MTM% Chg |
Price YTY% Chg |
Sales MTM% Chg |
Sales YTY% Chg |
||
Calif. Single-family homes |
$899,560 |
$900,170 |
$900,720 |
-0.1 % |
-0.1 % |
4.0 % |
-0.3 % |
||
Calif. Condo/ Townhomes |
$670,000 |
$675,000 |
$697,550 |
-0.7 % |
-3.9 % |
-1.4 % |
3.9 % |
||
Los Angeles Metro Area |
$847,970 |
$855,000 |
$835,000 |
-0.8 % |
1.6 % |
-2.0 % |
2.2 % |
||
Central Coast |
$1,039,000 |
$1,125,000 |
$1,072,000 |
-7.6 % |
-3.1 % |
11.0 % |
11.4 % |
||
Central Valley |
$499,000 |
$510,000 |
$503,000 |
-2.2 % |
-0.8 % |
-3.6 % |
-0.8 % |
||
Far North |
$385,000 |
$385,000 |
$409,000 |
0.0 % |
-5.9 % |
-2.3 % |
13.7 % |
||
Inland Empire |
$605,000 |
$610,000 |
$600,000 |
-0.8 % |
0.8 % |
1.4 % |
3.5 % |
||
San Francisco Bay Area |
$1,400,000 |
$1,400,000 |
$1,400,000 |
0.0 % |
0.0 % |
1.6 % |
1.0 % |
||
Southern California |
$876,840 |
$888,000 |
$875,000 |
-1.3 % |
0.2 % |
-2.5 % |
1.9 % |
||
San Francisco Bay Area |
|||||||||
Alameda |
$1,321,000 |
$1,365,000 |
$1,369,210 |
-3.2 % |
-3.5 % |
4.9 % |
3.6 % |
||
Contra Costa |
$940,000 |
$924,950 |
$903,000 |
1.6 % |
4.1 % |
-5.7 % |
-8.5 % |
||
Marin |
$1,650,000 |
$1,885,000 |
$1,800,000 |
-12.5 % |
-8.3 % |
-10.0 % |
7.8 % |
||
Napa |
$1,100,000 |
$920,000 |
$952,500 |
19.6 % |
15.5 % |
-26.0 % |
-13.6 % |
||
San Francisco |
$1,705,000 |
$1,801,000 |
$1,650,000 |
-5.3 % |
3.3 % |
1.4 % |
12.2 % |
||
San Mateo |
$2,150,000 |
$2,200,000 |
$2,110,000 |
-2.3 % |
1.9 % |
-3.7 % |
3.3 % |
||
Santa Clara |
$2,107,500 |
$2,171,120 |
r |
$1,955,000 |
-2.9 % |
7.8 % |
7.7 % |
2.1 % |
|
Solano |
$571,520 |
$590,000 |
$601,250 |
-3.1 % |
-4.9 % |
-4.9 % |
-10.4 % |
||
Sonoma |
$850,000 |
$860,000 |
$835,000 |
-1.2 % |
1.8 % |
22.7 % |
15.9 % |
||
Southern California |
|||||||||
Imperial |
$400,000 |
$377,450 |
$385,000 |
6.0 % |
3.9 % |
-10.4 % |
0.0 % |
||
Los Angeles |
$903,650 |
$835,480 |
$889,180 |
8.2 % |
1.6 % |
-5.4 % |
1.1 % |
||
Orange |
$1,470,000 |
$1,419,500 |
$1,450,000 |
3.6 % |
1.4 % |
-1.2 % |
0.1 % |
||
Riverside |
$635,000 |
$638,000 |
$638,000 |
r |
-0.5 % |
-0.5 % |
0.0 % |
2.0 % |
|
San Bernardino |
$482,460 |
$497,940 |
$490,420 |
r |
-3.1 % |
-1.6 % |
2.8 % |
6.0 % |
|
San Diego |
$1,025,000 |
$1,050,000 |
$1,054,180 |
-2.4 % |
-2.8 % |
-3.9 % |
0.7 % |
||
Ventura |
$975,000 |
$985,000 |
$964,500 |
-1.0 % |
1.1 % |
-0.6 % |
9.1 % |
||
Central Coast |
|||||||||
Monterey |
$968,000 |
$901,000 |
$1,039,000 |
7.4 % |
-6.8 % |
9.6 % |
16.4 % |
||
San Luis Obispo |
$880,000 |
$952,000 |
$890,000 |
-7.6 % |
-1.1 % |
32.1 % |
14.7 % |
||
Santa Barbara |
$1,222,500 |
$1,485,000 |
$1,355,500 |
-17.7 % |
-9.8 % |
-3.4 % |
1.2 % |
||
Santa Cruz |
$1,330,000 |
$1,350,000 |
$1,413,000 |
-1.5 % |
-5.9 % |
4.9 % |
15.2 % |
||
Central Valley |
|||||||||
Fresno |
$438,370 |
$440,000 |
$428,890 |
-0.4 % |
2.2 % |
5.8 % |
-5.0 % |
||
Glenn |
$385,000 |
$350,000 |
$350,000 |
10.0 % |
10.0 % |
18.2 % |
62.5 % |
||
Kern |
$409,000 |
$420,000 |
$375,000 |
-2.6 % |
9.1 % |
9.2 % |
-5.1 % |
||
Kings |
$365,000 |
$368,760 |
$391,400 |
-1.0 % |
-6.7 % |
-10.4 % |
87.3 % |
||
Madera |
$426,000 |
$455,000 |
$415,070 |
-6.4 % |
2.6 % |
-4.7 % |
4.3 % |
||
Merced |
$446,310 |
$425,000 |
$421,000 |
5.0 % |
6.0 % |
-22.5 % |
-28.1 % |
||
Placer |
$705,000 |
$665,000 |
$685,000 |
6.0 % |
2.9 % |
-14.7 % |
-11.0 % |
||
Sacramento |
$549,450 |
$550,000 |
$560,000 |
-0.1 % |
-1.9 % |
-6.2 % |
1.0 % |
||
San Benito |
$877,720 |
$854,000 |
$854,000 |
2.8 % |
2.8 % |
33.3 % |
37.9 % |
||
San Joaquin |
$578,500 |
$560,000 |
$550,000 |
3.3 % |
5.2 % |
-8.5 % |
0.2 % |
||
Stanislaus |
$495,000 |
$505,000 |
$495,000 |
-2.0 % |
0.0 % |
-7.0 % |
-6.1 % |
||
Tulare |
$389,000 |
$385,000 |
$375,000 |
1.0 % |
3.7 % |
9.8 % |
16.6 % |
||
Far North |
|||||||||
Butte |
$487,000 |
$488,750 |
$475,900 |
-0.4 % |
2.3 % |
-13.6 % |
17.3 % |
||
Lassen |
$286,500 |
$263,000 |
$267,500 |
8.9 % |
7.1 % |
-5.3 % |
28.6 % |
||
Plumas |
$328,750 |
$402,000 |
$465,000 |
-18.2 % |
-29.3 % |
24.1 % |
28.6 % |
||
Shasta |
$382,500 |
$380,000 |
$396,950 |
0.7 % |
-3.6 % |
-4.2 % |
5.7 % |
||
Siskiyou |
$315,000 |
$299,500 |
$362,120 |
5.2 % |
-13.0 % |
8.8 % |
42.3 % |
||
Tehama |
$380,700 |
$390,000 |
$375,000 |
-2.4 % |
1.5 % |
19.2 % |
3.3 % |
||
Trinity |
$311,000 |
$315,000 |
$322,100 |
-1.3 % |
-3.4 % |
0.0 % |
37.5 % |
||
Other Calif. Counties |
|||||||||
Amador |
$412,500 |
$440,000 |
$450,000 |
-6.3 % |
-8.3 % |
-11.6 % |
-15.6 % |
||
Calaveras |
$465,000 |
$499,000 |
$495,000 |
-6.8 % |
-6.1 % |
36.9 % |
34.8 % |
||
Del Norte |
$405,000 |
$505,000 |
$350,000 |
-19.8 % |
15.7 % |
14.3 % |
6.7 % |
||
El Dorado |
$730,000 |
$699,000 |
$709,000 |
4.4 % |
3.0 % |
0.8 % |
28.9 % |
||
Humboldt |
$422,500 |
$465,920 |
r |
$490,620 |
-9.3 % |
-13.9 % |
25.5 % |
45.5 % |
|
Lake |
$301,380 |
$362,500 |
$352,500 |
-16.9 % |
-14.5 % |
-3.7 % |
-18.8 % |
||
Mariposa |
$394,500 |
$485,000 |
$374,500 |
-18.7 % |
5.3 % |
-5.9 % |
0.0 % |
||
Mendocino |
$550,000 |
$525,000 |
$521,690 |
4.8 % |
5.4 % |
-9.6 % |
-2.1 % |
||
Mono |
$815,000 |
$747,500 |
$1,240,000 |
9.0 % |
-34.3 % |
50.0 % |
28.6 % |
||
Nevada |
$573,500 |
$559,500 |
$625,000 |
2.5 % |
-8.2 % |
15.5 % |
20.4 % |
||
Sutter |
$450,000 |
$469,950 |
$500,000 |
-4.2 % |
-10.0 % |
25.0 % |
22.2 % |
||
Tuolumne |
$420,000 |
$418,000 |
$439,500 |
0.5 % |
-4.4 % |
16.1 % |
33.3 % |
||
Yolo |
$680,000 |
$687,400 |
$649,500 |
-1.1 % |
4.7 % |
0.0 % |
1.8 % |
||
Yuba |
$430,000 |
$470,000 |
$446,750 |
-8.5 % |
-3.7 % |
-16.9 % |
-7.8 % |
||
r = revised
NA = not available
June 2025 County Unsold Inventory and Days on Market
(Regional and condo sales data not seasonally adjusted)
June 2025 |
Unsold Inventory Index |
Median Time on Market |
||||||||
State/Region/County |
Jun-25 |
May-25 |
Jun-24 |
Jun-25 |
May-25 |
Jun-24 |
||||
Calif. Single-family homes |
3.8 |
3.8 |
3.0 |
24.0 |
22.0 |
r |
18.0 |
|||
Calif. Condo/ Townhomes |
4.4 |
4.4 |
3.2 |
31.0 |
27.0 |
20.0 |
||||
Los Angeles Metro Area |
4.0 |
4.0 |
3.2 |
29.0 |
27.0 |
21.0 |
||||
Central Coast |
3.8 |
4.1 |
3.5 |
20.0 |
20.0 |
16.0 |
||||
Central Valley |
3.7 |
3.5 |
2.8 |
23.0 |
21.0 |
17.0 |
||||
Far North |
5.6 |
5.3 |
5.4 |
24.0 |
25.0 |
24.0 |
||||
Inland Empire |
4.4 |
4.5 |
3.7 |
36.0 |
33.0 |
26.5 |
||||
San Francisco Bay Area |
2.7 |
2.9 |
2.0 |
20.0 |
16.0 |
14.0 |
||||
Southern California |
3.9 |
3.9 |
3.1 |
27.0 |
25.0 |
20.0 |
||||
San Francisco Bay Area |
||||||||||
Alameda |
2.4 |
2.7 |
1.8 |
15.0 |
13.0 |
12.0 |
||||
Contra Costa |
3.2 |
3.1 |
1.8 |
17.0 |
14.0 |
12.5 |
||||
Marin |
2.7 |
2.9 |
2.3 |
49.0 |
39.5 |
39.0 |
||||
Napa |
9.9 |
7.3 |
5.6 |
79.0 |
52.0 |
52.0 |
||||
San Francisco |
1.6 |
2.0 |
1.8 |
33.0 |
29.5 |
34.0 |
||||
San Mateo |
2.0 |
2.1 |
1.7 |
12.0 |
11.0 |
11.0 |
||||
Santa Clara |
1.8 |
2.1 |
1.5 |
10.5 |
9.0 |
8.0 |
||||
Solano |
3.6 |
3.3 |
2.7 |
44.0 |
40.0 |
35.0 |
||||
Sonoma |
3.7 |
4.7 |
3.4 |
60.0 |
56.0 |
45.0 |
||||
Southern California |
||||||||||
Imperial |
3.7 |
3.1 |
2.1 |
43.0 |
25.0 |
13.0 |
||||
Los Angeles |
4.0 |
3.9 |
3.1 |
24.0 |
23.0 |
19.0 |
||||
Orange |
3.4 |
3.3 |
2.5 |
26.0 |
23.0 |
18.0 |
||||
Riverside |
4.0 |
4.3 |
3.3 |
41.0 |
38.0 |
29.0 |
r |
|||
San Bernardino |
5.4 |
5.3 |
4.5 |
r |
33.0 |
29.0 |
23.0 |
r |
||
San Diego |
3.6 |
3.4 |
2.7 |
21.0 |
18.0 |
14.0 |
||||
Ventura |
3.7 |
3.7 |
2.8 |
38.0 |
33.0 |
27.0 |
||||
Central Coast |
||||||||||
Monterey |
3.9 |
4.2 |
4.3 |
29.0 |
18.0 |
10.5 |
||||
San Luis Obispo |
3.6 |
4.5 |
3.1 |
29.0 |
28.0 |
22.0 |
||||
Santa Barbara |
3.7 |
3.5 |
3.3 |
15.0 |
15.0 |
13.0 |
||||
Santa Cruz |
4.4 |
4.5 |
3.4 |
15.0 |
14.0 |
15.0 |
||||
Central Valley |
||||||||||
Fresno |
3.8 |
4.0 |
2.9 |
18.0 |
16.0 |
15.0 |
||||
Glenn |
4.3 |
5.5 |
5.8 |
46.0 |
34.0 |
23.0 |
||||
Kern |
3.2 |
3.5 |
2.3 |
21.0 |
24.0 |
17.0 |
||||
Kings |
3.0 |
2.7 |
3.4 |
19.0 |
21.0 |
16.0 |
||||
Madera |
5.6 |
5.5 |
5.2 |
31.0 |
29.5 |
32.5 |
||||
Merced |
4.4 |
3.2 |
2.4 |
22.0 |
27.0 |
20.0 |
||||
Placer |
4.0 |
3.3 |
2.6 |
28.0 |
23.0 |
24.0 |
||||
Sacramento |
3.3 |
3.0 |
2.5 |
22.0 |
20.0 |
17.0 |
||||
San Benito |
4.0 |
5.1 |
5.0 |
27.0 |
37.5 |
25.0 |
||||
San Joaquin |
4.1 |
3.7 |
2.9 |
28.0 |
23.0 |
15.0 |
||||
Stanislaus |
3.6 |
3.2 |
2.8 |
22.0 |
19.0 |
15.0 |
||||
Tulare |
3.7 |
3.9 |
3.2 |
24.0 |
23.0 |
14.0 |
||||
Far North |
||||||||||
Butte |
4.3 |
3.5 |
4.2 |
24.0 |
16.0 |
20.0 |
||||
Lassen |
8.3 |
7.6 |
9.4 |
25.5 |
27.0 |
45.0 |
||||
Plumas |
7.8 |
8.9 |
7.2 |
35.5 |
26.0 |
15.0 |
||||
Shasta |
4.8 |
4.5 |
4.1 |
21.0 |
26.5 |
23.0 |
||||
Siskiyou |
8.5 |
9.0 |
11.5 |
19.0 |
17.5 |
29.0 |
||||
Tehama |
4.7 |
5.8 |
4.8 |
39.0 |
85.5 |
42.0 |
||||
Trinity |
11.4 |
10.4 |
14.6 |
19.0 |
161.0 |
232.0 |
||||
Other Calif. Counties |
||||||||||
Amador |
9.2 |
7.4 |
6.7 |
49.5 |
45.0 |
37.0 |
||||
Calaveras |
5.1 |
6.6 |
6.1 |
23.0 |
31.0 |
13.0 |
||||
Del Norte |
7.3 |
8.0 |
7.4 |
50.5 |
28.0 |
31.0 |
||||
El Dorado |
4.9 |
4.8 |
5.3 |
24.0 |
23.0 |
22.0 |
||||
Humboldt |
5.3 |
6.5 |
6.9 |
17.5 |
23.5 |
26.5 |
||||
Lake |
10.3 |
9.7 |
6.5 |
53.5 |
43.0 |
47.0 |
||||
Mariposa |
8.7 |
7.9 |
6.4 |
61.0 |
45.0 |
18.0 |
||||
Mendocino |
9.9 |
8.4 |
7.9 |
74.0 |
58.5 |
58.0 |
||||
Mono |
5.7 |
4.7 |
4.4 |
6.0 |
83.0 |
66.0 |
||||
Nevada |
5.5 |
6.1 |
5.2 |
25.0 |
27.0 |
28.0 |
||||
Sutter |
3.8 |
4.4 |
3.5 |
31.0 |
35.0 |
16.0 |
||||
Tuolumne |
7.7 |
8.3 |
7.3 |
38.5 |
31.5 |
16.5 |
||||
Yolo |
3.3 |
3.6 |
2.5 |
28.0 |
27.5 |
20.0 |
||||
Yuba |
5.6 |
4.4 |
4.5 |
40.0 |
35.0 |
26.5 |
||||
r = revised
NA = not available
SOURCE CALIFORNIA ASSOCIATION OF REALTORS® (C.A.R.)


Share this article