California home sales retreat in June, but 2019 housing market outlook revised upward, C.A.R. reports
- Existing, single-family home sales totaled 389,690 in June on a seasonally adjusted annualized rate, down 4.2 percent from May and down 5.1 percent from June 2018.
- June's statewide median home price was $611,420, virtually unchanged from May and up 1.4 percent from June 2018.
- Year-to-date statewide home sales were down 5.9 percent in June.
- C.A.R.'s 2019 California housing market forecast was revised upward to 385,460 single-family home sales and a median price of $593,000.

LOS ANGELES, July 17, 2019 /PRNewswire/ -- After rebounding in May, California home sales fell below the benchmark 400,000 level in June as sales declined from both the previous month and year, the CALIFORNIA ASSOCIATION OF REALTORS® (C.A.R.) said today.
Closed escrow sales of existing, single-family detached homes in California totaled a seasonally adjusted annualized rate of 389,690 units in June, according to information collected by C.A.R. from more than 90 local REALTOR® associations and MLSs statewide. The statewide annualized sales figure represents what would be the total number of homes sold during 2019 if sales maintained the June pace throughout the year. It is adjusted to account for seasonal factors that typically influence home sales.
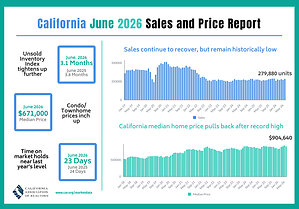
June's sales figure was down 4.2 percent from the 406,960 level in May and down 5.1 percent from home sales in June 2018 of 410,800. Sales fell below the 400,000 benchmark again after rebounding in May. Sales have been under the benchmark for 10 of the past 11 months.
"With softer price growth and interest rates at the lowest levels in nearly three years, monthly mortgage payments on a median-priced home have fallen for four straight months. This allows homebuyers to save hundreds of dollars a month on the same home or to potentially consider a slightly more expensive home for the same monthly cost," said C.A.R. President Jared Martin. "Combined with the long-term benefits of homeownership on personal wealth and quality of life, 2019 is a good time to purchase a home for the long haul."
While the median price set another record in June, the increase was tempered. June's median price was $611,420, essentially unchanged from $611,190 in May and up 1.4 percent from $602,770 in June 2018.
"With low rates supporting sales and elevating home prices in the last few months, the market outlook has shown some improvement since the first quarter," said C.A.R. Senior Vice President and Chief Economist Leslie Appleton-Young. "As such, we have revised our 2019 forecast upward for home sales to reach 385,460 and for the median price to hit $593,000, from the previous forecast of 375,100 and $568,800, respectively."
Other key points from C.A.R.'s June 2019 resale housing report include:
- At the regional level, sales fell from a year ago in all major regions on a non-seasonally adjusted annual basis, with the Central Valley recording the largest drop at 9.4 percent. Sales fell 8.8 percent in the San Francisco Bay Area and 8.4 percent in the Los Angeles Metro region. The Central Coast region experienced a 6.4 percent decline, while the Inland Empire recorded a 5.2 percent decrease.
- In the San Francisco Bay Area, only Napa County recorded a non-seasonally adjusted annual sales increase at 19.2 percent, while sales were essentially flat in Sonoma County. The seven remaining counties experienced declines ranging from the low single-digits in Marin to a 21 percent dip in San Francisco.
- Home sales in Southern California were down 9.1 percent, with every county outside of Ventura (0.6 percent) posting declines. Los Angeles (-12.6 percent), San Diego (-12.5 percent), Orange (-7.6 percent) and San Bernardino (-7.2 percent), and Riverside (-4.0 percent) counties all recorded sales declines.
- At the regional level, median home prices were up from a year ago in all major regions except for the San Francisco Bay Area, which saw an 8.1 percent decline. Only San Francisco County recorded a solid 8.8 percent year-over-year price increase, while elsewhere in the nine-county region, prices followed the statewide trend of cooling price growth.
- In Southern California, only Ventura County experienced a year-over-year price decline. Other counties in the region recorded annual price growth ranging from 0.8 percent in Orange County to 5.7 percent in San Bernardino.
- Median prices improved from the prior year in all Central Valley region counties, even as the region posted the weakest sales.
- Active listings, which have been decelerating since December 2018, grew 2.4 percent from a year ago — the smallest increase since April 2018.
- The number of homes available for sale has moderated significantly, suggesting that market is getting back toward being more balanced between supply and demand — but inventory remains relatively tight from a historical perspective. The Unsold Inventory Index (UII), which is a ratio of inventory over sales, was 3.4 months in June, up from 3.2 months in May and up from 3.0 months in June 2018. The index measures the number of months it would take to sell the supply of homes on the market at the current sales rate.
- The median number of days it took to sell a California single-family home increased in June. Time on market inched up from 18 days in May to 19 days in June. It took a median number of 15 days to sell a home in June 2018.
- C.A.R.'s statewide sales-price-to-list-price ratio* was 99.2 percent in June 2019 compared to 100 percent in June 2018.
- The average statewide price per square foot** for an existing, single-family home statewide reached $292 in June 2019 and was $290 in June 2018.
- The 30-year, fixed-mortgage interest rate averaged 3.8 percent in June, down from 4.57 percent in June 2018, according to Freddie Mac. The five-year, adjustable mortgage interest rate was an average of 3.48 percent, compared to 3.82 percent in June 2018.
Note: The County MLS median price and sales data in the tables are generated from a survey of more than 90 associations of REALTORS® throughout the state and represent statistics of existing single-family detached homes only. County sales data are not adjusted to account for seasonal factors that can influence home sales. Movements in sales prices should not be interpreted as changes in the cost of a standard home. The median price is where half sold for more and half sold for less; medians are more typical than average prices, which are skewed by a relatively small share of transactions at either the lower-end or the upper-end. Median prices can be influenced by changes in cost, as well as changes in the characteristics and the size of homes sold. The change in median prices should not be construed as actual price changes in specific homes.
*Sales-to-list-price ratio is an indicator that reflects the negotiation power of home buyers and home sellers under current market conditions. The ratio is calculated by dividing the final sales price of a property by its last list price and is expressed as a percentage. A sales-to-list ratio with 100 percent or above suggests that the property sold for more than the list price, and a ratio below 100 percent indicates that the price sold below the asking price.
**Price per square foot is a measure commonly used by real estate agents and brokers to determine how much a square foot of space a buyer will pay for a property. It is calculated as the sale price of the home divided by the number of finished square feet. C.A.R. currently tracks price-per-square foot statistics for 50 counties.
Leading the way…® in California real estate for more than 110 years, the CALIFORNIA ASSOCIATION OF REALTORS® (www.car.org) is one of the largest state trade organizations in the United States with more than 200,000 members dedicated to the advancement of professionalism in real estate. C.A.R. is headquartered in Los Angeles.
June 2019 County Sales and Price Activity |
|||||||||
(Regional and condo sales data not seasonally adjusted) |
|||||||||
June 2019 |
Median Sold Price of Existing Single-Family Homes |
Sales |
|||||||
State/Region/County |
June 2019 |
May 2019 |
June 2018 |
Price |
Price |
Sales |
Sales |
||
Calif. Single-family home |
$611,420 |
$611,190 |
$602,770 |
r |
0.0% |
1.4% |
-4.2% |
-5.1% |
|
Calif. Condo/Townhomes |
$480,000 |
$470,000 |
$476,500 |
r |
2.1% |
0.7% |
-11.6% |
-12.4% |
|
Los Angeles Metro Area |
$545,000 |
$535,000 |
$539,000 |
1.9% |
1.1% |
-6.5% |
-8.4% |
||
Central Coast |
$699,000 |
$690,000 |
$670,000 |
1.3% |
4.3% |
-1.1% |
-6.4% |
||
Central Valley |
$340,000 |
$340,000 |
$334,000 |
0.0% |
1.8% |
-7.2% |
-9.4% |
||
Inland Empire |
$379,000 |
$384,000 |
$360,000 |
-1.3% |
5.3% |
-3.5% |
-5.2% |
||
San Francisco Bay Area |
$960,000 |
$990,000 |
$1,045,000 |
-3.0% |
-8.1% |
-10.2% |
-8.8% |
||
San Francisco Bay Area |
|||||||||
Alameda |
$960,000 |
$959,000 |
$1,015,000 |
0.1% |
-5.4% |
-7.6% |
-12.9% |
||
Contra Costa |
$698,000 |
$700,360 |
r |
$702,370 |
r |
-0.3% |
-0.6% |
-14.6% |
-8.3% |
Marin |
$1,370,000 |
$1,400,000 |
$1,415,000 |
-2.1% |
-3.2% |
-6.1% |
-0.4% |
||
Napa |
$705,750 |
$725,000 |
$740,000 |
-2.7% |
-4.6% |
7.8% |
19.2% |
||
San Francisco |
$1,762,500 |
$1,697,500 |
$1,620,000 |
3.8% |
8.8% |
-23.5% |
-21.1% |
||
San Mateo |
$1,620,000 |
$1,766,500 |
$1,650,500 |
-8.3% |
-1.8% |
-6.4% |
-8.2% |
||
Santa Clara |
$1,350,000 |
$1,335,000 |
$1,400,000 |
1.1% |
-3.6% |
-14.4% |
-14.6% |
||
Solano |
$448,000 |
$446,000 |
$450,000 |
0.4% |
-0.4% |
-6.2% |
-1.9% |
||
Sonoma |
$662,500 |
$666,000 |
$705,000 |
-0.5% |
-6.0% |
-2.4% |
3.3% |
||
Southern California |
|||||||||
Los Angeles |
$599,680 |
$539,480 |
$586,090 |
11.2% |
2.3% |
-10.8% |
-12.6% |
||
Orange |
$842,000 |
$845,000 |
$835,500 |
-0.4% |
0.8% |
-4.7% |
-7.6% |
||
Riverside |
$420,000 |
$420,000 |
$405,000 |
0.0% |
3.7% |
-8.3% |
-4.0% |
||
San Bernardino |
$310,000 |
$315,000 |
$293,250 |
-1.6% |
5.7% |
5.7% |
-7.2% |
||
San Diego |
$665,000 |
$650,000 |
$650,000 |
2.3% |
2.3% |
-10.2% |
-12.5% |
||
Ventura |
$647,000 |
$659,500 |
r |
$675,000 |
-1.9% |
-4.1% |
0.4% |
0.6% |
|
Central Coast |
|||||||||
Monterey |
$640,500 |
$639,000 |
$632,500 |
0.2% |
1.3% |
-16.0% |
-18.1% |
||
San Luis Obispo |
$640,000 |
$640,000 |
$612,500 |
0.0% |
4.5% |
-4.3% |
-5.7% |
||
Santa Barbara |
$717,000 |
$696,000 |
$753,750 |
3.0% |
-4.9% |
10.4% |
3.0% |
||
Santa Cruz |
$897,000 |
$935,000 |
$925,000 |
-4.1% |
-3.0% |
10.8% |
-5.7% |
||
Central Valley |
|||||||||
Fresno |
$283,000 |
$284,900 |
$275,500 |
-0.7% |
2.7% |
-0.4% |
-10.2% |
||
Glenn |
$250,000 |
$245,000 |
$227,710 |
2.0% |
9.8% |
-5.6% |
41.7% |
||
Kern |
$259,450 |
$252,000 |
$245,000 |
3.0% |
5.9% |
-5.3% |
-10.3% |
||
Kings |
$247,150 |
$260,000 |
$245,000 |
-4.9% |
0.9% |
3.5% |
21.9% |
||
Madera |
$291,250 |
$270,000 |
$268,000 |
7.9% |
8.7% |
-8.7% |
1.7% |
||
Merced |
$287,000 |
$285,000 |
$275,000 |
0.7% |
4.4% |
-15.4% |
-13.8% |
||
Placer |
$525,000 |
$514,900 |
$510,000 |
2.0% |
2.9% |
-7.8% |
-9.9% |
||
Sacramento |
$390,000 |
$385,000 |
$375,000 |
1.3% |
4.0% |
-7.6% |
-12.7% |
||
San Benito |
$585,500 |
$600,000 |
$570,400 |
-2.4% |
2.6% |
22.4% |
20.0% |
||
San Joaquin |
$386,750 |
$380,000 |
$377,150 |
1.8% |
2.5% |
-7.2% |
-6.6% |
||
Stanislaus |
$325,500 |
$335,000 |
$320,000 |
-2.8% |
1.7% |
-21.7% |
-16.6% |
||
Tulare |
$247,500 |
$248,000 |
$234,500 |
-0.2% |
5.5% |
-3.4% |
-2.3% |
||
Other Calif. Counties |
|||||||||
Amador |
NA |
NA |
NA |
NA |
NA |
NA |
NA |
||
Butte |
$384,000 |
$359,000 |
$323,000 |
7.0% |
18.9% |
-3.4% |
-9.4% |
||
Calaveras |
$330,000 |
$375,000 |
$313,000 |
-12.0% |
5.4% |
-15.0% |
-10.8% |
||
Del Norte |
$353,500 |
$256,850 |
$312,500 |
37.6% |
13.1% |
14.3% |
-27.3% |
||
El Dorado |
$497,500 |
$521,380 |
r |
$525,000 |
-4.6% |
-5.2% |
1.7% |
-10.4% |
|
Humboldt |
$340,000 |
$315,000 |
$331,250 |
7.9% |
2.6% |
-7.1% |
-11.9% |
||
Lake |
$270,000 |
$267,000 |
$298,800 |
1.1% |
-9.6% |
2.5% |
1.2% |
||
Lassen |
$215,000 |
$205,000 |
$212,000 |
4.9% |
1.4% |
-13.8% |
13.6% |
||
Mariposa |
$354,500 |
$295,000 |
$307,000 |
r |
20.2% |
15.5% |
-23.8% |
-30.4% |
|
Mendocino |
$399,000 |
$388,500 |
$449,000 |
2.7% |
-11.1% |
-4.8% |
-14.5% |
||
Mono |
$910,000 |
$564,500 |
$570,000 |
61.2% |
59.6% |
150.0% |
15.4% |
||
Nevada |
$427,500 |
$420,000 |
$452,000 |
1.8% |
-5.4% |
-0.7% |
-15.5% |
||
Plumas |
$340,000 |
$350,500 |
$290,000 |
-3.0% |
17.2% |
56.0% |
56.0% |
||
Shasta |
$289,900 |
$285,000 |
$281,500 |
1.7% |
3.0% |
-16.5% |
-18.4% |
||
Siskiyou |
$270,250 |
$235,000 |
$187,500 |
15.0% |
44.1% |
-4.3% |
-4.3% |
||
Sutter |
$313,000 |
$319,900 |
$315,000 |
-2.2% |
-0.6% |
2.7% |
-19.4% |
||
Tehama |
$260,000 |
$243,000 |
$234,900 |
7.0% |
10.7% |
-16.3% |
-8.9% |
||
Tuolumne |
$297,000 |
$310,000 |
$318,500 |
-4.2% |
-6.8% |
-4.1% |
-23.9% |
||
Yolo |
$463,500 |
$469,500 |
$450,000 |
-1.3% |
3.0% |
5.5% |
-9.9% |
||
Yuba |
$295,000 |
$311,000 |
$292,500 |
-5.1% |
0.9% |
-13.2% |
-1.3% |
||
r = revised |
|||||||||
NA = not available |
June 2019 County Unsold Inventory and Days on Market |
||||||||||
(Regional and condo sales data not seasonally adjusted) |
||||||||||
June 2019 |
Unsold Inventory Index |
Median Time on Market |
||||||||
State/Region/County |
June |
May |
June |
June |
May |
June |
||||
Calif. Single-family home |
3.4 |
3.2 |
3.0 |
19.0 |
18.0 |
15.0 |
||||
Calif. Condo/Townhomes |
3.1 |
2.8 |
2.3 |
21.0 |
19.0 |
13.0 |
||||
Los Angeles Metro Area |
3.7 |
3.6 |
3.0 |
r |
24.0 |
25.0 |
20.0 |
|||
Central Coast |
4.0 |
3.9 |
3.5 |
21.0 |
18.0 |
16.5 |
||||
Central Valley |
2.9 |
2.7 |
2.7 |
14.0 |
13.0 |
13.0 |
||||
Inland Empire |
3.7 |
3.7 |
3.7 |
31.0 |
31.0 |
25.0 |
||||
San Francisco Bay Area |
2.5 |
2.3 |
2.0 |
16.0 |
14.0 |
14.0 |
||||
San Francisco Bay Area |
||||||||||
Alameda |
1.9 |
1.9 |
1.5 |
13.0 |
12.0 |
12.0 |
||||
Contra Costa |
2.4 |
2.1 |
2.0 |
13.0 |
12.0 |
12.0 |
||||
Marin |
2.8 |
2.9 |
2.5 |
27.0 |
25.0 |
28.0 |
||||
Napa |
4.8 |
5.2 |
4.8 |
41.5 |
35.0 |
34.0 |
||||
San Francisco |
2.0 |
1.5 |
1.4 |
13.0 |
14.0 |
13.0 |
||||
San Mateo |
1.9 |
2.0 |
1.7 |
13.0 |
11.0 |
11.5 |
||||
Santa Clara |
2.5 |
2.2 |
1.7 |
12.0 |
12.0 |
9.0 |
||||
Solano |
2.9 |
2.7 |
2.6 |
33.0 |
31.0 |
32.0 |
||||
Sonoma |
3.8 |
3.6 |
3.4 |
35.0 |
34.0 |
34.0 |
||||
Southern California |
||||||||||
Los Angeles |
3.4 |
3.3 |
2.6 |
r |
19.0 |
21.0 |
17.0 |
|||
Orange |
3.8 |
3.7 |
3.2 |
20.0 |
19.0 |
15.0 |
||||
Riverside |
3.6 |
3.4 |
3.5 |
32.0 |
32.0 |
26.0 |
||||
San Bernardino |
4.0 |
4.1 |
3.9 |
28.0 |
28.0 |
25.0 |
||||
San Diego |
3.3 |
3.0 |
2.8 |
13.0 |
14.0 |
13.0 |
||||
Ventura |
4.9 |
4.9 |
1.5 |
r |
45.0 |
44.5 |
40.0 |
|||
Central Coast |
||||||||||
Monterey |
4.6 |
3.8 |
3.5 |
21.0 |
17.0 |
15.0 |
||||
San Luis Obispo |
3.8 |
3.7 |
3.5 |
21.0 |
19.0 |
22.0 |
||||
Santa Barbara |
3.9 |
4.3 |
4.0 |
27.0 |
21.0 |
20.0 |
||||
Santa Cruz |
3.6 |
3.8 |
3.0 |
16.0 |
14.0 |
13.0 |
||||
Central Valley |
||||||||||
Fresno |
3.1 |
3.2 |
2.7 |
15.0 |
14.0 |
13.0 |
||||
Glenn |
5.2 |
4.6 |
6.3 |
22.0 |
22.0 |
18.5 |
||||
Kern |
2.9 |
2.8 |
3.0 |
13.0 |
13.0 |
18.0 |
||||
Kings |
2.9 |
3.1 |
3.1 |
20.0 |
20.0 |
19.5 |
||||
Madera |
4.2 |
3.8 |
4.0 |
25.0 |
30.0 |
27.0 |
||||
Merced |
3.9 |
3.3 |
2.8 |
29.5 |
29.5 |
15.0 |
||||
Placer |
2.7 |
2.6 |
2.4 |
10.0 |
10.0 |
14.0 |
||||
Sacramento |
2.4 |
2.2 |
2.3 |
10.0 |
10.0 |
10.0 |
||||
San Benito |
3.2 |
4.2 |
2.7 |
15.0 |
15.0 |
11.5 |
||||
San Joaquin |
3.1 |
2.8 |
2.6 |
14.0 |
14.0 |
13.0 |
||||
Stanislaus |
2.9 |
2.3 |
2.7 |
14.0 |
14.0 |
12.0 |
||||
Tulare |
3.1 |
3.0 |
3.2 |
27.0 |
27.0 |
23.0 |
||||
Other Calif. Counties |
||||||||||
Amador |
NA |
NA |
NA |
NA |
NA |
NA |
||||
Butte |
2.9 |
2.7 |
2.9 |
10.0 |
9.0 |
16.0 |
||||
Calaveras |
6.7 |
5.6 |
6.0 |
33.0 |
32.0 |
29.0 |
||||
Del Norte |
8.7 |
9.4 |
6.4 |
84.5 |
146.5 |
108.0 |
||||
El Dorado |
5.3 |
5.2 |
4.2 |
24.0 |
24.0 |
21.0 |
||||
Humboldt |
5.0 |
4.7 |
5.1 |
17.5 |
12.0 |
19.0 |
||||
Lake |
6.4 |
6.5 |
6.2 |
37.0 |
51.0 |
40.0 |
||||
Lassen |
6.3 |
4.8 |
8.9 |
66.0 |
97.0 |
69.0 |
||||
Mariposa |
7.7 |
5.9 |
4.8 |
r |
21.5 |
29.0 |
27.0 |
r |
||
Mendocino |
7.6 |
7.3 |
7.1 |
66.0 |
49.5 |
74.0 |
||||
Mono |
8.2 |
15.8 |
7.6 |
102.5 |
182.5 |
82.0 |
||||
Nevada |
5.4 |
4.9 |
3.9 |
19.0 |
25.0 |
17.0 |
||||
Plumas |
10.9 |
15.1 |
11.7 |
123.0 |
123.0 |
50.0 |
||||
Shasta |
4.8 |
3.9 |
4.0 |
21.0 |
14.0 |
24.0 |
||||
Siskiyou |
8.1 |
7.5 |
7.1 |
38.0 |
17.0 |
24.5 |
||||
Sutter |
2.9 |
2.8 |
2.5 |
14.0 |
11.0 |
19.0 |
||||
Tehama |
5.6 |
4.7 |
4.8 |
36.0 |
57.0 |
61.0 |
||||
Tuolumne |
7.9 |
6.9 |
4.8 |
32.0 |
28.0 |
17.0 |
||||
Yolo |
2.6 |
2.9 |
2.3 |
12.5 |
12.0 |
11.0 |
||||
Yuba |
3.0 |
2.5 |
3.3 |
9.0 |
13.0 |
14.5 |
||||
r = revised |
NA = not available |
SOURCE CALIFORNIA ASSOCIATION OF REALTORS® (C.A.R.)


Share this article