California median home price reaches highest level in 15 months as elevated interest rates weaken home sales further in August, C.A.R. reports

- Existing, single-family home sales totaled 254,740 in August on a seasonally adjusted annualized rate, down 5.3 percent from July and down 19.0 percent from August 2022.
- August's statewide median home price was $859,800, up 3.3 percent from July and up 3.0 percent from August 2022.
- Year-to-date statewide home sales were down 29.2 percent in August.
LOS ANGELES, Sept. 18, 2023 /PRNewswire/ -- Rising mortgage rates and a continued shortage of homes for sale hampered California home sales for the third straight month in August, while the statewide median home price registered its biggest year-over-year gain in 14 months, the CALIFORNIA ASSOCIATION OF REALTORS® (C.A.R.) said today.
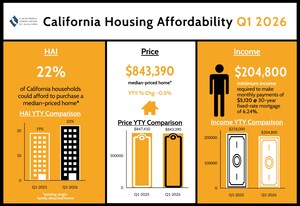
Infographic: https://www.car.org/en/Global/Infographics/2023-08-Sales-and-Price
Closed escrow sales of existing, single-family detached homes in California totaled a seasonally adjusted annualized rate of 254,740 in August, according to information collected by C.A.R. from more than 90 local REALTOR® associations and MLSs statewide. The statewide annualized sales figure represents what would be the total number of homes sold during 2023 if sales maintained the August pace throughout the year. It is adjusted to account for seasonal factors that typically influence home sales.
August's sales pace was down 5.3 percent on a monthly basis from a revised 268,940 in July and down 18.9 percent from a year ago, when a revised 314,270 homes were sold on an annualized basis. Sales of existing single-family homes in California remained below the 300,000-unit pace for the 11th month in a row. The monthly decline was the third consecutive decrease, and the annual decline was the 26th straight drop.
"Despite persistently high mortgage rates and availability of homes remaining extremely tight, there's still solid interest from prospective buyers," said C.A.R. President Jennifer Branchini, a Bay Area REALTOR®. "The highly competitive housing market continued to provide support to home prices, with the statewide median price steadily improving since early 2023. As California housing prices continue to stabilize, buyers and sellers on the sidelines will get back into the market once interest rates begin to moderate in the fourth quarter."
Home prices rose again from the year-ago level for the second straight month, as the statewide median price recorded the biggest year-over-year gain in 14 months. California's statewide median price climbed 3.3 percent from July's revised $832,400 to $859,800 in August and rose 3.0 percent from $834,740 a year ago. August's median price was the highest in 15 months and the highest since California reached its peak price of $893,200 in May 2022.
"A reacceleration of interest rates since April, combined with tight housing inventory pushed down California home sales to a seven-month low in August," said C.A.R. Senior Vice President and Chief Economist Jordan Levine. "While rates may remain elevated for a little longer, macroeconomic fundamentals are expected to soften starting in the last quarter of this year. Mortgage rates should begin to ease, albeit gradually, in the next couple months, and provide a much-needed boost to both the supply and the demand sides of the housing market."
Other key points from C.A.R.'s August 2023 resale housing report include:
- At the regional level, all major regions recorded double-digits sales declines in August on a year-over-year basis, with four of the five major regions dropping more than 15 percent from a year ago. The Central Valley region recorded the biggest sales drop of -19.0 percent from last year, followed by the San Francisco Bay Area (-18.3 percent), the Central Coast (-17.9 percent) and the Far North (-15.7 percent). Southern California (-13.9 percent) was the only region that experienced a decline of less than 15 percent.
- Forty-three of the 52 counties tracked by C.A.R. experienced sales decreases from a year ago in August, with 36 counties declining more than 10 percent year-over-year and 20 counties posting drops of more than 20 percent from last August. Mono (-42.9 percent) recorded the biggest sales drop, followed by Marin (-36.0 percent) and Siskiyou (-31.9 percent). Nine counties registered sales increases from last year, with San Benito (76.2 percent) gaining the most year-over-year, followed by Tuolumne (20.5 percent) and Trinity (16.7 percent).
- At the regional level, three of the five major regions experienced home price gains from a year ago. The median price in the San Francisco Bay Area (5.0 percent) improved in August on a year-over-year basis for the first time in 14 months and was the region recording the biggest annual gain. Two out of nine counties within the region posted an annual gain, with Santa Clara registering a double-digit gain of 12.3 percent from the prior year. Southern California (4.4 percent) and the Central Valley (3.2 percent) also posted median prices increases from last year, while the Central Coast region remained unchanged. The Far North region (-2.4 percent) was the only region that posted a median price decline from last August.
- Home prices continued to stabilize across the state, with 19 counties experiencing year-over-year median price decreases in August, compared to 27 counties in July and 37 in June. Trinity posted the biggest price decline, dropping -19.9 percent from last August, followed by Siskiyou (-15.1 percent) and Marin (-11.9 percent). Thirty counties recorded an increase in median price from last year, up from 21 in July. Mono posted the biggest price jump at 21.6 percent, followed by Kings (18.9 percent) and Santa Barbara (16.4 percent).
- Housing supply in California continued to shrink from a year ago in August as mortgage rates remained elevated. The statewide unsold inventory index (UII), which measures the number of months needed to sell the supply of homes on the market at the current sales rate, was 2.4 in August 2023 and 2.8 in August 2022. The statewide unsold inventory index was down 14.3 percent on a year-over-year basis. The index also slipped slightly by 4.0 percent from the prior month, but the month-to-month decline was due primarily to seasonal factors.
- Active listings at the state level have fallen from a year ago for five months in a row, and the year-over-year decline in each of the last four months all registered more than 20 percent. On a month-over-month basis, active listings improved slightly from July to August as fewer listings were taken off the market due to the slowdown in closed sales in August. An increase in newly added for-sale properties from July to August was another contributing factor to an improvement in the overall level of active listings last month.
- Nearly two-thirds of counties recorded a decline in active listings from last year, and 44 counties posted double-digit, year-over-year drops. Alameda (-54.0 percent) dropped the most, followed by Mono (-50.9 percent) and Contra Costa (-48.5 percent). Nineteen counties recorded a year-over-year gain, with Mariposa registering the largest yearly gain of 71.4 percent, followed by Del Norte (59.1 percent) and Marin (27.5 percent). On a month-to-month basis, eight counties followed the statewide trend, while 45 counties remained on an upward trend and continued to post month-over-month increases.
- The median number of days it took to sell a California single-family home was 18 days in August and 23 days in August 2022.
- C.A.R.'s statewide sales-price-to-list-price ratio* was 100 percent in August 2023 and 98.4 percent in August 2022.
- The statewide average price per square foot** for an existing single-family home was $417, up from $404 in August a year ago.
- The 30-year, fixed-mortgage interest rate averaged 7.07 percent in August, up from 5.22 percent in August 2022, according to C.A.R.'s calculations based on Freddie Mac's weekly mortgage survey data.
Note: The County MLS median price and sales data in the tables are generated from a survey of more than 90 associations of REALTORS® throughout the state and represent statistics of existing single-family detached homes only. County sales data is not adjusted to account for seasonal factors that can influence home sales. Movements in sales prices should not be interpreted as changes in the cost of a standard home. The median price is where half sold for more and half sold for less; medians are more typical than average prices, which are skewed by a relatively small share of transactions at either the lower end or the upper end. Median prices can be influenced by changes in cost, as well as changes in the characteristics and the size of homes sold. The change in median prices should not be construed as actual price changes in specific homes.
*Sales-to-list-price ratio is an indicator that reflects the negotiation power of home buyers and home sellers under current market conditions. The ratio is calculated by dividing the final sales price of a property by its original list price and is expressed as a percentage. A sales-to-list ratio with 100 percent or above suggests that the property sold for more than the list price, and a ratio below 100 percent indicates that the price sold below the asking price.
**Price per square foot is a measure commonly used by real estate agents and brokers to determine how much a square foot of space a buyer will pay for a property. It is calculated as the sale price of the home divided by the number of finished square feet. C.A.R. currently tracks price-per-square foot statistics for 51 counties.
Leading the way…® in California real estate for more than 110 years, the CALIFORNIA ASSOCIATION OF REALTORS® (www.car.org) is one of the largest state trade organizations in the United States with more than 200,000 members dedicated to the advancement of professionalism in real estate. C.A.R. is headquartered in Los Angeles.
August 2023 County Sales and Price Activity |
|||||||||
August 2023 |
Median Sold Price of Existing Single-Family Homes |
Sales |
|||||||
State/Region/County |
Aug. 2023 |
July 2023 |
Aug. 2022 |
Price |
Price |
Sales |
Sales |
||
Calif. Single-family home |
$859,800 |
$832,400 |
r |
$834,740 |
r |
3.3 % |
3.0 % |
-5.3 % |
-18.9 % |
Calif. Condo/Townhome |
$657,000 |
$645,000 |
$620,000 |
r |
1.9 % |
6.0 % |
12.2 % |
-14.6 % |
|
Los Angeles Metro Area |
$792,500 |
$790,000 |
$765,000 |
0.3 % |
3.6 % |
9.3 % |
-13.4 % |
||
Central Coast |
$950,000 |
$985,000 |
$950,000 |
-3.6 % |
0.0 % |
1.0 % |
-17.9 % |
||
Central Valley |
$485,000 |
$489,000 |
$470,000 |
r |
-0.8 % |
3.2 % |
4.0 % |
-19.0 % |
|
Far North |
$369,000 |
$375,000 |
$378,000 |
-1.6 % |
-2.4 % |
0.7 % |
-15.7 % |
||
Inland Empire |
$569,990 |
$575,000 |
$565,500 |
-0.9 % |
0.8 % |
10.8 % |
-15.7 % |
||
San Francisco Bay Area |
$1,260,000 |
$1,255,000 |
$1,200,000 |
r |
0.4 % |
5.0 % |
4.3 % |
-18.3 % |
|
Southern California |
$830,000 |
$830,000 |
$795,000 |
0.0 % |
4.4 % |
7.9 % |
-13.9 % |
||
San Francisco Bay Area |
|||||||||
Alameda |
$1,250,000 |
$1,260,000 |
$1,220,000 |
r |
-0.8 % |
2.5 % |
7.6 % |
-21.0 % |
|
Contra Costa |
$844,440 |
$900,000 |
$850,000 |
r |
-6.2 % |
-0.7 % |
2.1 % |
-19.8 % |
|
Marin |
$1,475,000 |
$1,609,500 |
$1,674,500 |
r |
-8.4 % |
-11.9 % |
-24.0 % |
-36.0 % |
|
Napa |
$1,055,000 |
$927,500 |
$1,150,000 |
r |
13.7 % |
-8.3 % |
1.4 % |
-21.1 % |
|
San Francisco |
$1,576,000 |
$1,460,000 |
$1,635,000 |
7.9 % |
-3.6 % |
-7.1 % |
-22.2 % |
||
San Mateo |
$1,950,000 |
$1,984,000 |
$1,950,000 |
-1.7 % |
0.0 % |
14.0 % |
-6.6 % |
||
Santa Clara |
$1,852,500 |
$1,800,000 |
$1,650,000 |
2.9 % |
12.3 % |
13.4 % |
-13.3 % |
||
Solano |
$599,000 |
$600,560 |
$610,000 |
-0.3 % |
-1.8 % |
0.7 % |
-20.4 % |
||
Sonoma |
$850,000 |
$850,960 |
$834,000 |
r |
-0.1 % |
1.9 % |
1.7 % |
-14.5 % |
|
Southern California |
|||||||||
Los Angeles |
$882,020 |
$851,540 |
$854,960 |
3.6 % |
3.2 % |
5.6 % |
-12.5 % |
||
Orange |
$1,310,000 |
$1,300,000 |
$1,200,000 |
0.8 % |
9.2 % |
13.3 % |
-8.4 % |
||
Riverside |
$618,000 |
$615,000 |
$620,000 |
0.5 % |
-0.3 % |
6.7 % |
-14.6 % |
||
San Bernardino |
$495,000 |
$485,000 |
$472,750 |
2.1 % |
4.7 % |
18.9 % |
-17.6 % |
||
San Diego |
$1,000,000 |
$969,020 |
$886,250 |
r |
3.2 % |
12.8 % |
2.7 % |
-16.0 % |
|
Ventura |
$915,000 |
$920,000 |
$884,000 |
-0.5 % |
3.5 % |
12.0 % |
-20.3 % |
||
Central Coast |
|||||||||
Monterey |
$897,000 |
$949,000 |
$842,500 |
-5.5 % |
6.5 % |
20.9 % |
-4.5 % |
||
San Luis Obispo |
$868,810 |
$860,000 |
$868,500 |
1.0 % |
0.0 % |
-10.3 % |
-22.9 % |
||
Santa Barbara |
$1,295,000 |
$994,470 |
$1,112,500 |
30.2 % |
16.4 % |
0.7 % |
-25.7 % |
||
Santa Cruz |
$1,200,000 |
$1,300,000 |
$1,300,000 |
-7.7 % |
-7.7 % |
-2.4 % |
-14.8 % |
||
Central Valley |
|||||||||
Fresno |
$425,000 |
$417,500 |
$405,000 |
1.8 % |
4.9 % |
-6.8 % |
-23.6 % |
||
Glenn |
$321,000 |
$372,500 |
$327,500 |
-13.8 % |
-2.0 % |
-33.3 % |
-7.7 % |
||
Kern |
$394,500 |
$395,000 |
$373,250 |
-0.1 % |
5.7 % |
3.0 % |
-29.3 % |
||
Kings |
$382,500 |
$385,000 |
$321,750 |
-0.6 % |
18.9 % |
-13.9 % |
-24.4 % |
||
Madera |
$453,000 |
$426,000 |
$400,000 |
6.3 % |
13.3 % |
15.3 % |
4.4 % |
||
Merced |
$385,000 |
$390,000 |
$385,000 |
-1.3 % |
0.0 % |
-8.6 % |
-17.8 % |
||
Placer |
$669,000 |
$660,000 |
$649,000 |
r |
1.4 % |
3.1 % |
5.8 % |
-7.6 % |
|
Sacramento |
$535,000 |
$547,000 |
$535,000 |
-2.2 % |
0.0 % |
7.7 % |
-19.1 % |
||
San Benito |
$777,550 |
$745,000 |
$755,000 |
4.4 % |
3.0 % |
37.0 % |
76.2 % |
||
San Joaquin |
$535,000 |
$545,000 |
$550,000 |
r |
-1.8 % |
-2.7 % |
-2.7 % |
-28.4 % |
|
Stanislaus |
$465,000 |
$465,000 |
$460,000 |
0.0 % |
1.1 % |
7.6 % |
-20.2 % |
||
Tulare |
$372,000 |
$370,520 |
$350,000 |
0.4 % |
6.3 % |
24.8 % |
-7.0 % |
||
Far North |
|||||||||
Butte |
$436,250 |
$429,000 |
$441,000 |
1.7 % |
-1.1 % |
-18.2 % |
-23.7 % |
||
Lassen |
$225,000 |
$280,000 |
$199,000 |
-19.6 % |
13.1 % |
91.7 % |
-14.8 % |
||
Plumas |
$412,000 |
$364,050 |
$380,000 |
13.2 % |
8.4 % |
41.2 % |
11.6 % |
||
Shasta |
$365,000 |
$379,000 |
$370,000 |
-3.7 % |
-1.4 % |
-0.5 % |
-17.9 % |
||
Siskiyou |
$305,500 |
$296,000 |
$360,000 |
3.2 % |
-15.1 % |
-20.0 % |
-31.9 % |
||
Tehama |
$312,050 |
$320,000 |
$301,000 |
-2.5 % |
3.7 % |
-8.6 % |
6.7 % |
||
Trinity |
$205,000 |
$320,000 |
$256,000 |
-35.9 % |
-19.9 % |
250.0 % |
16.7 % |
||
Other CA Counties |
|||||||||
Amador |
$490,000 |
$442,000 |
$449,900 |
r |
10.9 % |
8.9 % |
42.5 % |
-3.4 % |
|
Calaveras |
$475,000 |
$476,500 |
$464,950 |
-0.3 % |
2.2 % |
20.3 % |
-16.3 % |
||
Del Norte |
$382,500 |
$349,000 |
$378,960 |
9.6 % |
0.9 % |
20.0 % |
-25.0 % |
||
El Dorado |
$657,000 |
$650,000 |
$627,000 |
r |
1.1 % |
4.8 % |
30.0 % |
8.9 % |
|
Humboldt |
$421,920 |
$465,000 |
$465,000 |
-9.3 % |
-9.3 % |
-6.1 % |
-23.3 % |
||
Lake |
$325,000 |
$335,000 |
$330,000 |
-3.0 % |
-1.5 % |
7.7 % |
14.8 % |
||
Mariposa |
$480,000 |
$459,000 |
$450,000 |
4.6 % |
6.7 % |
42.9 % |
5.3 % |
||
Mendocino |
$560,000 |
$540,000 |
$502,500 |
r |
3.7 % |
11.4 % |
-18.9 % |
-17.3 % |
|
Mono |
$970,000 |
$785,000 |
$797,500 |
23.6 % |
21.6 % |
-27.3 % |
-42.9 % |
||
Nevada |
$555,000 |
$579,900 |
$580,000 |
-4.3 % |
-4.3 % |
15.5 % |
-18.5 % |
||
Sutter |
$425,000 |
$402,000 |
$455,000 |
r |
5.7 % |
-6.6 % |
65.0 % |
-14.3 % |
|
Tuolumne |
$389,500 |
$463,500 |
$407,500 |
-16.0 % |
-4.4 % |
4.4 % |
20.5 % |
||
Yolo |
$622,500 |
$625,000 |
$631,000 |
r |
-0.4 % |
-1.3 % |
8.4 % |
-22.7 % |
|
Yuba |
$449,500 |
$415,000 |
$425,000 |
r |
8.3 % |
5.8 % |
-20.5 % |
-28.7 % |
|
r = revised |
August 2023 County Unsold Inventory and Days on Market |
||||||||||
August 2023 |
Unsold Inventory Index |
Median Time on Market |
||||||||
State/Region/County |
Aug. 2023 |
July 2023 |
Aug. 2022 |
Aug-23 |
Jul-23 |
Aug-22 |
||||
Calif. Single-family home |
2.4 |
2.5 |
2.8 |
r |
18.0 |
16.0 |
23.0 |
r |
||
Calif. Condo/Townhome |
2.2 |
2.4 |
2.3 |
r |
16.0 |
16.0 |
21.0 |
r |
||
Los Angeles Metro Area |
2.4 |
2.7 |
3.1 |
20.0 |
19.0 |
25.0 |
r |
|||
Central Coast |
2.9 |
2.7 |
2.7 |
15.0 |
14.0 |
19.0 |
r |
|||
Central Valley |
2.3 |
2.4 |
2.7 |
r |
16.0 |
14.0 |
20.0 |
r |
||
Far North |
4.2 |
4.1 |
r |
3.7 |
r |
27.0 |
21.0 |
r |
28.0 |
r |
Inland Empire |
2.9 |
3.1 |
3.4 |
22.0 |
22.0 |
27.0 |
r |
|||
San Francisco Bay Area |
1.9 |
1.8 |
2.1 |
r |
14.0 |
14.0 |
24.0 |
r |
||
Southern California |
2.3 |
2.5 |
3.0 |
18.0 |
17.0 |
23.0 |
r |
|||
San Francisco Bay Area |
||||||||||
Alameda |
1.4 |
1.3 |
2.0 |
r |
12.0 |
11.0 |
17.0 |
r |
||
Contra Costa |
1.4 |
1.4 |
2.1 |
r |
12.0 |
12.0 |
19.0 |
r |
||
Marin |
3.0 |
1.7 |
1.7 |
r |
45.0 |
43.0 |
45.0 |
r |
||
Napa |
4.5 |
4.0 |
3.2 |
r |
60.0 |
54.5 |
50.0 |
r |
||
San Francisco |
2.9 |
2.1 |
2.2 |
47.0 |
35.0 |
38.0 |
r |
|||
San Mateo |
2.1 |
2.1 |
2.3 |
12.0 |
11.0 |
14.0 |
||||
Santa Clara |
1.6 |
1.6 |
2.0 |
8.0 |
8.0 |
16.0 |
||||
Solano |
2.3 |
2.1 |
2.1 |
r |
29.0 |
35.0 |
42.5 |
r |
||
Sonoma |
3.1 |
3.1 |
2.5 |
r |
62.0 |
46.0 |
48.0 |
r |
||
Southern California |
||||||||||
Los Angeles |
2.4 |
2.5 |
3.1 |
18.0 |
17.0 |
22.0 |
r |
|||
Orange |
2.0 |
2.3 |
2.5 |
18.0 |
18.0 |
25.0 |
r |
|||
Riverside |
2.5 |
2.7 |
3.2 |
23.0 |
23.0 |
28.0 |
r |
|||
San Bernardino |
3.5 |
4.0 |
3.7 |
21.0 |
19.0 |
25.0 |
r |
|||
San Diego |
1.9 |
2.0 |
2.5 |
13.0 |
12.0 |
18.0 |
r |
|||
Ventura |
2.1 |
2.3 |
2.3 |
25.0 |
25.0 |
31.0 |
r |
|||
Central Coast |
||||||||||
Monterey |
2.7 |
3.2 |
3.1 |
13.5 |
13.0 |
20.0 |
||||
San Luis Obispo |
2.9 |
2.4 |
2.5 |
22.0 |
21.0 |
24.0 |
r |
|||
Santa Barbara |
2.9 |
2.7 |
2.6 |
13.0 |
10.0 |
14.0 |
||||
Santa Cruz |
2.9 |
2.7 |
2.5 |
14.0 |
14.0 |
18.0 |
||||
Central Valley |
||||||||||
Fresno |
2.8 |
2.6 |
2.9 |
12.0 |
12.0 |
15.0 |
r |
|||
Glenn |
4.4 |
2.8 |
4.2 |
9.5 |
19.5 |
58.0 |
r |
|||
Kern |
2.1 |
2.3 |
2.4 |
11.0 |
12.0 |
18.0 |
||||
Kings |
2.6 |
2.0 |
2.3 |
12.0 |
12.0 |
12.5 |
||||
Madera |
3.7 |
4.0 |
3.7 |
27.0 |
32.0 |
18.5 |
r |
|||
Merced |
3.2 |
2.8 |
3.5 |
20.0 |
16.0 |
22.0 |
r |
|||
Placer |
2.2 |
2.3 |
2.8 |
r |
24.0 |
18.0 |
27.0 |
r |
||
Sacramento |
1.9 |
1.9 |
2.5 |
r |
14.0 |
13.0 |
20.0 |
r |
||
San Benito |
3.5 |
4.6 |
7.7 |
34.0 |
14.0 |
30.0 |
||||
San Joaquin |
2.4 |
2.1 |
2.4 |
r |
17.0 |
12.0 |
22.0 |
r |
||
Stanislaus |
2.1 |
2.1 |
2.6 |
r |
14.0 |
14.0 |
20.0 |
r |
||
Tulare |
2.2 |
2.9 |
2.7 |
17.0 |
16.0 |
12.0 |
||||
Far North |
||||||||||
Butte |
2.9 |
2.3 |
3.4 |
19.0 |
16.5 |
23.0 |
r |
|||
Lassen |
5.2 |
9.7 |
4.6 |
35.0 |
22.0 |
70.0 |
||||
Plumas |
4.0 |
5.8 |
4.1 |
32.0 |
15.5 |
25.0 |
r |
|||
Shasta |
3.7 |
3.6 |
3.3 |
23.0 |
19.0 |
22.0 |
r |
|||
Siskiyou |
8.0 |
6.2 |
4.5 |
27.0 |
24.5 |
52.0 |
r |
|||
Tehama |
4.2 |
3.5 |
6.4 |
65.0 |
30.0 |
53.5 |
||||
Trinity |
8.4 |
28.8 |
NA |
43.5 |
53.0 |
55.0 |
||||
Other CA Counties |
||||||||||
Amador |
4.5 |
6.1 |
4.6 |
r |
39.0 |
16.5 |
37.0 |
r |
||
Calaveras |
3.3 |
4.1 |
3.3 |
r |
25.0 |
42.0 |
57.5 |
|||
Del Norte |
5.0 |
5.8 |
3.2 |
20.5 |
26.5 |
24.0 |
r |
|||
El Dorado |
2.9 |
3.7 |
3.2 |
r |
21.0 |
18.0 |
36.0 |
r |
||
Humboldt |
5.2 |
4.8 |
3.6 |
16.5 |
10.0 |
18.5 |
||||
Lake |
6.0 |
6.2 |
6.7 |
45.0 |
30.0 |
42.0 |
r |
|||
Mariposa |
5.3 |
6.3 |
3.8 |
27.5 |
85.0 |
17.0 |
r |
|||
Mendocino |
7.4 |
6.3 |
6.4 |
r |
71.0 |
72.0 |
81.5 |
r |
||
Mono |
4.8 |
2.8 |
4.6 |
23.5 |
8.0 |
55.0 |
||||
Nevada |
3.3 |
4.2 |
3.3 |
r |
35.0 |
23.0 |
41.0 |
r |
||
Sutter |
2.0 |
3.4 |
2.5 |
r |
22.5 |
10.0 |
28.0 |
r |
||
Tuolumne |
3.7 |
3.2 |
4.3 |
35.0 |
15.5 |
36.5 |
r |
|||
Yolo |
2.3 |
2.2 |
2.0 |
r |
17.0 |
14.0 |
21.5 |
r |
||
Yuba |
3.5 |
2.4 |
3.5 |
r |
17.0 |
19.5 |
29.0 |
r |
||
r = revised |
SOURCE CALIFORNIA ASSOCIATION OF REALTORS® (C.A.R.)


Share this article