DIAMONDROCK HOSPITALITY COMPANY REPORTS THIRD QUARTER 2023 RESULTS
Comparable Total Revenues Flat to 2022 and 12% Higher than 2019
BETHESDA, Md., Nov. 1, 2023 /PRNewswire/ -- DiamondRock Hospitality Company (the "Company") (NYSE: DRH), a lodging-focused real estate investment trust that owns a portfolio of 36 premium hotels and resorts in the United States, today announced results of operations for the quarter ended September 30, 2023.
Third Quarter 2023 Highlights
- Net Income: Net income was $27.3 million and earnings per diluted share was $0.12.
- Comparable Revenues: Comparable total revenues were $277.1 million, a 0.1% increase over 2022 and a 12.0% increase over 2019.
- Comparable RevPAR: Comparable RevPAR was $210.03, a 1.1% decrease from 2022 and a 7.6% increase over 2019.
- Comparable Hotel Adjusted EBITDA: Comparable Hotel Adjusted EBITDA was $81.1 million, a 6.6% decrease from 2022 and a 8.9% increase over 2019.
- Comparable Hotel Adjusted EBITDA Margin: Comparable Hotel Adjusted EBITDA margin was 29.27%, a 210 basis point decrease from 2022 and a 85 basis point decrease over 2019.
- Adjusted EBITDA: Adjusted EBITDA was $73.2 million, a 4.1% decrease from 2022 and a 8.4% increase over 2019.
- Adjusted FFO: Adjusted FFO was $54.6 million and Adjusted FFO per diluted share was $0.26.
- Hotel Acquisition: The Company acquired Chico Hot Springs Resort located in Paradise Valley, Montana for $33.0 million on August 1, 2023.
- Hotel Rebranding: The Company completed the rebranding of the Hilton Boston Downtown/Faneuil Hall to The Dagny, an independent lifestyle boutique hotel, on August 1, 2023.
"DiamondRock's results for the third quarter were modestly ahead of our expectations. The team did a great job controlling expenses, which saw significant improvement over the prior quarter. Accomplishments in the third quarter also included the successful completion of the major repositioning of The Dagny in Boston. For the fourth quarter, we expect our RevPAR growth to improve approximately 100 basis points from the third quarter and be essentially flat compared to 2022 driven by improving results from our resort portfolio," said Mark W. Brugger, President and Chief Executive Officer of DiamondRock Hospitality Company.
Operating Results
Please see "Non-GAAP Financial Measures" attached to this press release for an explanation of the terms "EBITDAre," "Adjusted EBITDA," "Hotel Adjusted EBITDA," "Hotel Adjusted EBITDA Margin," "FFO" and "Adjusted FFO" and a reconciliation of these measures to net income. Comparable operating results include all hotels currently owned for all periods presented, except the Kimpton Fort Lauderdale Beach Resort, which opened in April 2021. See "Reconciliation of Comparable Operating Results" attached to this press release for a reconciliation to historical amounts.
Quarter Ended September 30, | Change From | ||||||||
2023 | 2022 | 2019 | 2022 | 2019 | |||||
($ amounts in millions, except hotel statistics and per share amounts) | |||||||||
Comparable Operating Results (1) | |||||||||
ADR | $ 274.00 | $ 282.49 | $ 240.06 | (3.0) % | 14.1 % | ||||
Occupancy | 76.7 % | 75.1 % | 81.3 % | 1.6 % | (4.6) % | ||||
RevPAR | $ 210.03 | $ 212.27 | $ 195.19 | (1.1) % | 7.6 % | ||||
Total RevPAR | $ 312.35 | $ 312.57 | $ 280.00 | (0.1) % | 11.6 % | ||||
Revenues | $ 277.1 | $ 276.8 | $ 247.4 | 0.1 % | 12.0 % | ||||
Hotel Adjusted EBITDA | $ 81.1 | $ 86.8 | $ 74.5 | (6.6) % | 8.9 % | ||||
Hotel Adjusted EBITDA Margin | 29.27 % | 31.37 % | 30.12 % | (210 bps) | (85 bps) | ||||
Available Rooms | 887,279 | 885,466 | 883,660 | 1,813 | 3,619 | ||||
Actual Operating Results (2) | |||||||||
Revenues | $ 276.5 | $ 268.2 | $ 240.3 | 3.1 % | 15.1 % | ||||
Net income | $ 27.3 | $ 28.6 | $ 11.6 | (4.5) % | 135.3 % | ||||
Earnings per diluted share | $ 0.12 | $ 0.12 | $ 0.06 | 0.0 % | 100.0 % | ||||
Adjusted EBITDA | $ 73.2 | $ 76.3 | $ 67.5 | (4.1) % | 8.4 % | ||||
Adjusted FFO | $ 54.6 | $ 60.6 | $ 55.3 | (9.9) % | (1.3) % | ||||
Adjusted FFO per diluted share | $ 0.26 | $ 0.28 | $ 0.27 | (7.1) % | (3.7) % | ||||
Nine Months Ended September 30, | Change From | ||||||||
2023 | 2022 | 2019 | 2022 | 2019 | |||||
($ amounts in millions, except hotel statistics and per share amounts) | |||||||||
Comparable Operating Results (1) | |||||||||
ADR | $ 281.52 | $ 288.43 | $ 239.96 | (2.4) % | 17.3 % | ||||
Occupancy | 73.4 % | 68.7 % | 78.6 % | 4.7 % | (5.2) % | ||||
RevPAR | $ 206.60 | $ 198.19 | $ 188.72 | 4.2 % | 9.5 % | ||||
Total RevPAR | $ 309.40 | $ 294.71 | $ 278.07 | 5.0 % | 11.3 % | ||||
Revenues | $ 814.1 | $ 773.7 | $ 728.9 | 5.2 % | 11.7 % | ||||
Hotel Adjusted EBITDA | $ 238.0 | $ 245.2 | $ 217.7 | (2.9) % | 9.3 % | ||||
Hotel Adjusted EBITDA Margin | 29.23 % | 31.69 % | 29.87 % | (246 bps) | (64 bps) | ||||
Available Rooms | 2,631,183 | 2,625,408 | 2,621,125 | 5,775 | 10,058 | ||||
Actual Operating Results (2) | |||||||||
Revenues | $ 811.3 | $ 746.4 | $ 700.6 | 8.7 % | 15.8 % | ||||
Net income | $ 75.7 | $ 91.3 | $ 49.6 | (17.1) % | 52.6 % | ||||
Earnings per diluted share | $ 0.32 | $ 0.39 | $ 0.24 | (17.9) % | 33.3 % | ||||
Adjusted EBITDA | $ 214.4 | $ 213.2 | $ 197.8 | 0.6 % | 8.4 % | ||||
Adjusted FFO | $ 159.9 | $ 168.0 | $ 162.3 | (4.8) % | (1.5) % | ||||
Adjusted FFO per diluted share | $ 0.75 | $ 0.78 | $ 0.80 | (3.8) % | (6.3) % | ||||
(1) | Amounts represent the pre-acquisition operating results for Bourbon Orleans Hotel from January 1, 2019 to July 28, 2021, Henderson Park Inn from January 1, 2019 to July 29, 2021, Henderson Beach Resort from January 1, 2019 to December 22, 2021, Tranquility Bay Beachfront Resort from January 1, 2019 to January 5, 2022, Lake Austin Spa Resort from January 1, 2019 to November 20, 2022 Chico Hot Springs Resort from January 1, 2019 to July 31, 2023 and exclude the operating results of the Kimpton Fort Lauderdale Beach Resort as the hotel opened in April 2021. The pre-acquisition operating results were obtained from the sellers of the hotels during the acquisition due diligence process. We have made no adjustments to the amounts provided to us by the seller. The pre-acquisition operating results were not audited or reviewed by the Company's independent auditors. |
(2) | Actual operating results include the operating results of all hotels for the Company's respective ownership periods. |
Hotel Acquisition
On August 1, 2023, the Company acquired the fee-simple interest in Chico Hot Springs Resort, a lifestyle resort, and adjacent ranch in Paradise Valley, Montana and near Yellowstone National Park for $33 million. The $27 million purchase price for the 117-room, 153-acre resort represents an 8.1% capitalization rate on 2022 net operating income ("NOI"). The adjacent ranch, a 595-acre parcel purchased for approximately $6 million, provides extensive on-site trails for hiking and horseback riding as well as potential for future expansion of the resort or residential lot sales. The acquisition was funded from corporate cash on hand.
Capital Expenditures
The Company invested approximately $67.1 million in capital improvements at its hotels during the nine months ended September 30, 2023. The Company expects to spend $100 million on capital improvements at its hotels in 2023. Significant projects in 2023 include the following:
- The Dagny: The Company completed a comprehensive renovation to rebrand the Hilton Boston Downtown/Faneuil Hall as The Dagny, an independent lifestyle hotel, during the third quarter.
- Salt Lake City Marriott: The Company completed a renovation of the guestrooms during the third quarter.
- Hilton Burlington Lake Champlain: The Company commenced a repositioning of the hotel to rebrand it as a Curio Collection hotel. The repositioning is expected to be completed in the summer of 2024 and includes a new restaurant concept by a well-known, award-winning chef.
Balance Sheet and Liquidity
The Company ended the quarter with $611.6 million of liquidity, comprised of $102.7 million of unrestricted corporate cash, $108.9 million of unrestricted cash at its hotels and full capacity on its $400 million senior unsecured credit facility. As of September 30, 2023, the Company had $1.2 billion of total debt outstanding, which consisted of $800.0 million of unsecured term loans and $380.6 million of property-specific, non-recourse mortgage debt.
Dividends
The Company declared a quarterly cash dividend of $0.03 per common share, which was was paid on October 12, 2023 to shareholders of record as of September 29, 2023. The Company paid a quarterly dividend of $0.515625 per share on its 8.250% Series A Cumulative Redeemable Preferred Stock on September 29, 2023 to shareholders of record as of September 18, 2023.
Earnings Call
The Company will host a conference call to discuss its third quarter results on Wednesday, November 1, 2023, at 10:00 a.m. Eastern Time (ET). The conference call will be accessible by telephone and through the internet. Interested individuals are requested to register for the call by visiting https://investor.drhc.com. A replay of the conference call webcast will be archived and available online.
About the Company
DiamondRock Hospitality Company is a self-advised real estate investment trust (REIT) that is an owner of a leading portfolio of geographically diversified hotels concentrated in leisure destinations and top gateway markets. The Company currently owns 36 premium quality hotels with over 9,700 rooms. The Company has strategically positioned its portfolio to be operated both under leading global brand families as well as independent boutique hotels in the lifestyle segment. For further information on the Company and its portfolio, please visit DiamondRock Hospitality Company's website at www.drhc.com.
This press release contains forward-looking statements within the meaning of federal securities laws and regulations. These forward-looking statements are identified by their use of terms and phrases such as "believe," "expect," "intend," "project," "forecast," "plan" and other similar terms and phrases, including references to assumptions and forecasts of future results. Forward-looking statements are not guarantees of future performance and involve known and unknown risks, uncertainties and other factors which may cause the actual results to differ materially from those anticipated at the time the forward-looking statements are made. These risks include, but are not limited to: the adverse impact of the novel coronavirus (COVID-19) on the U.S., regional and global economies, travel, the hospitality industry, and the financial condition and results of operations of the Company and its hotels; national and local economic and business conditions, including the potential for additional terrorist attacks, that will affect occupancy rates at the Company's hotels and the demand for hotel products and services; operating risks associated with the hotel business; relationships with property managers; the ability to compete effectively in areas such as access, location, quality of accommodations and room rate structures; changes in travel patterns, taxes and government regulations which influence or determine wages, prices, construction procedures and costs; and other risk factors contained in the Company's filings with the Securities and Exchange Commission. Although the Company believes the expectations reflected in such forward-looking statements are based upon reasonable assumptions, it can give no assurance that the expectations will be attained or that any deviation will not be material. All information in this release is as of the date of this release, and the Company undertakes no obligation to update any forward-looking statement to conform the statement to actual results or changes in the Company's expectations.
DIAMONDROCK HOSPITALITY COMPANY
(in thousands, except share and per share amounts) | |||
September 30, 2023 | December 31, 2022 | ||
ASSETS | (unaudited) | ||
Property and equipment, net | $ 2,765,646 | $ 2,748,476 | |
Right-of-use assets | 97,552 | 99,047 | |
Restricted cash | 42,503 | 39,614 | |
Due from hotel managers | 167,695 | 176,708 | |
Prepaid and other assets | 80,188 | 76,131 | |
Cash and cash equivalents | 102,737 | 67,564 | |
Total assets | $ 3,256,321 | $ 3,207,540 | |
LIABILITIES AND EQUITY | |||
Liabilities: | |||
Mortgage and other debt, net of unamortized debt issuance costs | $ 379,914 | $ 386,655 | |
Unsecured term loans, net of unamortized debt issuance costs | 799,337 | 799,138 | |
Senior unsecured credit facility | — | — | |
Total debt | 1,179,251 | 1,185,793 | |
Lease liabilities | 111,832 | 110,875 | |
Due to hotel managers | 122,746 | 123,682 | |
Deferred rent | 68,291 | 65,097 | |
Unfavorable contract liabilities, net | 59,825 | 61,069 | |
Accounts payable and accrued expenses | 48,940 | 43,120 | |
Distributions declared and unpaid | 6,380 | 12,946 | |
Deferred income related to key money, net | 8,457 | 8,780 | |
Total liabilities | 1,605,722 | 1,611,362 | |
Equity: | |||
Preferred stock, $0.01 par value; 10,000,000 shares authorized; | |||
8.250% Series A Cumulative Redeemable Preferred Stock (liquidation preference $25.00 per share), 4,760,000 shares issued and outstanding at September 30, 2023 and December 31, 2022 | 48 | 48 | |
Common stock, $0.01 par value; 400,000,000 shares authorized; 209,627,197 and 209,374,830 shares issued and outstanding at September 30, 2023 and December 31, 2022, respectively | 2,096 | 2,094 | |
Additional paid-in capital | 2,289,501 | 2,288,433 | |
Accumulated other comprehensive income | 3,802 | — | |
Distributions in excess of earnings | (651,533) | (700,694) | |
Total stockholders' equity | 1,643,914 | 1,589,881 | |
Noncontrolling interests | 6,685 | 6,297 | |
Total equity | 1,650,599 | 1,596,178 | |
Total liabilities and equity | $ 3,256,321 | $ 3,207,540 | |
DIAMONDROCK HOSPITALITY COMPANY CONSOLIDATED STATEMENTS OF OPERATIONS (in thousands, except share and per share amounts) (unaudited) | |||||||
Three Months Ended September 30, | Nine Months Ended September 30, | ||||||
2023 | 2022 | 2023 | 2022 | ||||
Revenues: | |||||||
Rooms | $ 186,334 | $ 184,994 | $ 544,325 | $ 510,189 | |||
Food and beverage | 64,723 | 61,940 | 192,869 | 176,294 | |||
Other | 25,463 | 21,274 | 74,126 | 59,965 | |||
Total revenues | 276,520 | 268,208 | 811,320 | 746,448 | |||
Operating Expenses: | |||||||
Rooms | 45,773 | 43,899 | 131,092 | 120,374 | |||
Food and beverage | 45,428 | 43,227 | 134,486 | 119,919 | |||
Other departmental and support expenses | 65,952 | 62,271 | 193,365 | 170,328 | |||
Management fees | 7,323 | 6,697 | 19,196 | 17,029 | |||
Franchise fees | 8,913 | 8,709 | 26,393 | 23,212 | |||
Other property-level expenses | 25,704 | 21,047 | 76,755 | 63,997 | |||
Depreciation and amortization | 27,683 | 27,053 | 82,995 | 81,097 | |||
Impairment losses | — | — | 941 | 2,843 | |||
Corporate expenses | 7,526 | 7,516 | 23,677 | 22,275 | |||
Business interruption insurance income | (537) | — | (647) | (499) | |||
Total operating expenses, net | 233,765 | 220,419 | 688,253 | 620,575 | |||
Interest expense | 15,973 | 9,072 | 48,712 | 22,866 | |||
Interest (income) and other (income) expense, net | (772) | 152 | (1,717) | 1,044 | |||
Loss on early extinguishment of debt | — | 9,698 | — | 9,698 | |||
Total other expenses, net | 15,201 | 18,922 | 46,995 | 33,608 | |||
Income before income taxes | 27,554 | 28,867 | 76,072 | 92,265 | |||
Income tax expense | (224) | (312) | (420) | (949) | |||
Net income | 27,330 | 28,555 | 75,652 | 91,316 | |||
Less: Net income attributable to noncontrolling interests | (58) | (99) | (259) | (315) | |||
Net income attributable to the Company | 27,272 | 28,456 | 75,393 | 91,001 | |||
Distributions to preferred stockholders | (2,454) | (2,454) | (7,362) | (7,362) | |||
Net income attributable to common stockholders | $ 24,818 | $ 26,002 | $ 68,031 | $ 83,639 | |||
Earnings per share: | |||||||
Earnings per share available to common stockholders - basic | $ 0.12 | $ 0.12 | $ 0.32 | $ 0.39 | |||
Earnings per share available to common stockholders - diluted | $ 0.12 | $ 0.12 | $ 0.32 | $ 0.39 | |||
Weighted-average number of common shares outstanding: | |||||||
Basic | 211,490,571 | 212,878,364 | 211,525,596 | 212,736,133 | |||
Diluted | 212,204,989 | 213,657,373 | 212,129,712 | 213,459,354 | |||
Non-GAAP Financial Measures
We use the following non-GAAP financial measures that we believe are useful to investors as key measures of our operating performance: EBITDA, EBITDAre, Adjusted EBITDA, Hotel EBITDA, Hotel Adjusted EBITDA, FFO and Adjusted FFO. These measures should not be considered in isolation or as a substitute for measures of performance in accordance with U.S. GAAP. EBITDA, EBITDAre, Adjusted EBITDA, Hotel EBITDA, Hotel Adjusted EBITDA, FFO and Adjusted FFO, as calculated by us, may not be comparable to other companies that do not define such terms exactly as the Company.
Use and Limitations of Non-GAAP Financial Measures
Our management and Board of Directors use EBITDA, EBITDAre, Adjusted EBITDA, Hotel EBITDA, Hotel Adjusted EBITDA, FFO and Adjusted FFO to evaluate the performance of our hotels and to facilitate comparisons between us and other lodging REITs, hotel owners who are not REITs and other capital intensive companies. The use of these non-GAAP financial measures has certain limitations. These non-GAAP financial measures as presented by us, may not be comparable to non-GAAP financial measures as calculated by other real estate companies. These measures do not reflect certain expenses or expenditures that we incurred and will incur, such as depreciation, interest and capital expenditures. We compensate for these limitations by separately considering the impact of these excluded items to the extent they are material to operating decisions or assessments of our operating performance. Our reconciliations to the most comparable U.S. GAAP financial measures, and our consolidated statements of operations and cash flows, include interest expense, capital expenditures, and other excluded items, all of which should be considered when evaluating our performance, as well as the usefulness of our non-GAAP financial measures.
These non-GAAP financial measures are used in addition to and in conjunction with results presented in accordance with U.S. GAAP. They should not be considered as alternatives to operating profit, cash flow from operations, or any other operating performance measure prescribed by U.S. GAAP. These non-GAAP financial measures reflect additional ways of viewing our operations that we believe, when viewed with our U.S. GAAP results and the reconciliations to the corresponding U.S. GAAP financial measures, provide a more complete understanding of factors and trends affecting our business than could be obtained absent this disclosure. We strongly encourage investors to review our financial information in its entirety and not to rely on a single financial measure.
EBITDA, EBITDAre and FFO
EBITDA represents net income (calculated in accordance with U.S. GAAP) excluding: (1) interest expense; (2) provision for income taxes, including income taxes applicable to sale of assets; and (3) depreciation and amortization. The Company computes EBITDAre in accordance with the National Association of Real Estate Investment Trusts ("Nareit") guidelines, as defined in its September 2017 white paper "Earnings Before Interest, Taxes, Depreciation and Amortization for Real Estate." EBITDAre represents net income (calculated in accordance with U.S. GAAP) adjusted for: (1) interest expense; (2) provision for income taxes, including income taxes applicable to sale of assets; (3) depreciation and amortization; (4) gains or losses on the disposition of depreciated property including gains or losses on change of control; (5) impairment write-downs of depreciated property and of investments in unconsolidated affiliates caused by a decrease in value of depreciated property in the affiliate; and (6) adjustments to reflect the entity's share of EBITDAre of unconsolidated affiliates.
We believe EBITDA and EBITDAre are useful to an investor in evaluating our operating performance because they help investors evaluate and compare the results of our operations from period to period by removing the impact of our capital structure (primarily interest expense) and our asset base (primarily depreciation and amortization, and in the case of EBITDAre, impairment and gains or losses on dispositions of depreciated property) from our operating results. In addition, covenants included in our debt agreements use EBITDA as a measure of financial compliance. We also use EBITDA and EBITDAre as measures in determining the value of hotel acquisitions and dispositions.
The Company computes FFO in accordance with standards established by the Nareit, which defines FFO as net income determined in accordance with U.S. GAAP, excluding gains or losses from sales of properties and impairment losses, plus real estate related depreciation and amortization. The Company believes that the presentation of FFO provides useful information to investors regarding its operating performance because it is a measure of the Company's operations without regard to specified non-cash items, such as real estate related depreciation and amortization and gains or losses on the sale of assets. The Company also uses FFO as one measure in assessing its operating results.
Hotel EBITDA
Hotel EBITDA represents net income excluding: (1) interest expense, (2) income taxes, (3) depreciation and amortization, (4) corporate general and administrative expenses (shown as corporate expenses on the consolidated statements of operations), and (5) hotel acquisition costs. We believe that Hotel EBITDA provides our investors a useful financial measure to evaluate our hotel operating performance, excluding the impact of our capital structure (primarily interest), our asset base (primarily depreciation and amortization), and our corporate-level expenses (corporate expenses and hotel acquisition costs). With respect to Hotel EBITDA, we believe that excluding the effect of corporate-level expenses provides a more complete understanding of the operating results over which individual hotels and third-party management companies have direct control. We believe property-level results provide investors with supplemental information on the ongoing operational performance of our hotels and effectiveness of the third-party management companies operating our business on a property-level basis.
Adjustments to EBITDAre, FFO and Hotel EBITDA
We adjust EBITDAre, FFO and Hotel EBITDA when evaluating our performance because we believe that the exclusion of certain additional items described below provides useful supplemental information to investors regarding our ongoing operating performance and that the presentation of Adjusted EBITDA, Adjusted FFO and Hotel Adjusted EBITDA when combined with U.S. GAAP net income, EBITDAre, FFO and Hotel EBITDA, is beneficial to an investor's complete understanding of our consolidated and property-level operating performance. Hotel Adjusted EBITDA margins are calculated as Hotel Adjusted EBITDA divided by total hotel revenues. We adjust EBITDAre, FFO and Hotel EBITDA for the following items:
- Non-Cash Lease Expense and Other Amortization: We exclude the non-cash expense incurred from the straight line recognition of expense from our ground leases and other contractual obligations and the non-cash amortization of our favorable and unfavorable contracts, originally recorded in conjunction with certain hotel acquisitions. We exclude these non-cash items because they do not reflect the actual cash amounts due to the respective lessors and service providers in the current period and they are of lesser significance in evaluating our actual performance for that period.
- Cumulative Effect of a Change in Accounting Principle: The Financial Accounting Standards Board promulgates new accounting standards that require or permit the consolidated statement of operations to reflect the cumulative effect of a change in accounting principle. We exclude the effect of these adjustments, which include the accounting impact from prior periods, because they do not reflect the Company's actual underlying performance for the current period.
- Gains or Losses from Early Extinguishment of Debt: We exclude the effect of gains or losses recorded on the early extinguishment of debt because these gains or losses result from transaction activity related to the Company's capital structure that we believe are not indicative of the ongoing operating performance of the Company or our hotels.
- Hotel Acquisition Costs: We exclude hotel acquisition costs expensed during the period because we believe these transaction costs are not reflective of the ongoing performance of the Company or our hotels.
- Severance Costs: We exclude corporate severance costs, or reversals thereof, incurred with the termination of corporate-level employees and severance costs incurred at our hotels related to lease terminations or structured severance programs because we believe these costs do not reflect the ongoing performance of the Company or our hotels.
- Hotel Manager Transition Items: We exclude the transition items associated with a change in hotel manager because we believe these items do not reflect the ongoing performance of the Company or our hotels.
- Hotel Pre-Opening Costs: We exclude the pre-opening costs associated with the redevelopment or rebranding of a hotel because we believe these items do not reflect the ongoing performance of the Company or our hotels.
- Other Items: From time to time we incur costs or realize gains that we consider outside the ordinary course of business and that we do not believe reflect the ongoing performance of the Company or our hotels. Such items may include, but are not limited to, the following: lease preparation costs incurred to prepare vacant space for marketing; management or franchise contract termination fees; gains or losses from legal settlements; costs incurred related to natural disasters; and gains on property insurance claim settlements, other than income related to business interruption insurance.
In addition, to derive Adjusted FFO we exclude any fair value adjustments to interest rate swaps. We exclude these non-cash amounts because they do not reflect the underlying performance of the Company.
Reconciliations of Non-GAAP Measures
EBITDA, EBITDAre and Adjusted EBITDA
The following tables are reconciliations of our GAAP net income to EBITDA, EBITDAre and Adjusted EBITDA (in thousands):
Three Months Ended September 30, | |||||
2023 | 2022 | 2019 | |||
Net income | $ 27,330 | $ 28,555 | $ 11,574 | ||
Interest expense | 15,973 | 9,072 | 14,184 | ||
Income tax expense | 224 | 312 | 1,217 | ||
Real estate related depreciation and amortization | 27,683 | 27,053 | 29,474 | ||
EBITDAre | 71,210 | 64,992 | 56,449 | ||
Non-cash lease expense and other amortization | 1,533 | 1,551 | 1,750 | ||
Professional fees and pre-opening costs related to Frenchman's Reef (1) | — | — | 6,378 | ||
Hotel pre-opening costs | 496 | — | — | ||
Hotel manager transition items | — | 11 | 582 | ||
Loss on early extinguishment of debt | — | 9,698 | 2,373 | ||
Adjusted EBITDA | $ 73,239 | $ 76,252 | $ 67,532 | ||
Nine Months Ended September 30, | |||||
2023 | 2022 | 2019 | |||
Net income | $ 75,652 | $ 91,316 | $ 49,628 | ||
Interest expense | 48,712 | 22,866 | 38,264 | ||
Income tax expense | 420 | 949 | 1,939 | ||
Real estate related depreciation and amortization | 82,995 | 81,097 | 87,805 | ||
EBITDA | 207,779 | 196,228 | 177,636 | ||
Impairment losses | 941 | 2,843 | — | ||
EBITDAre | 208,720 | 199,071 | 177,636 | ||
Non-cash lease expense and other amortization | 4,620 | 4,675 | 5,249 | ||
Professional fees and pre-opening costs related to Frenchman's Reef (1) | — | — | 11,445 | ||
Loss on early extinguishment of debt | — | 9,698 | 2,373 | ||
Hotel pre-opening costs | 1,038 | — | — | ||
Severance costs (2) | — | (532) | — | ||
Hotel manager transition items | — | 247 | 1,050 | ||
Adjusted EBITDA | $ 214,378 | $ 213,159 | $ 197,753 | ||
(1) | Represents pre-opening costs related to the re-opening of Frenchman's Reef, as well as legal and professional fees and other costs incurred at Frenchman's Reef as a result of Hurricane Irma that were not covered by insurance. |
(2) | Consists of severance costs incurred, and adjustments thereto, associated with the elimination of positions at our hotels, which are classified within other hotel expenses on the consolidated statement of operations. |
Hotel EBITDA and Hotel Adjusted EBITDA
The following table is a reconciliation of our GAAP net income to Hotel EBITDA and Hotel Adjusted EBITDA (in thousands):
Three Months Ended September 30, | |||||
2023 | 2022 | 2019 | |||
Net income | $ 27,330 | $ 28,555 | $ 11,574 | ||
Interest expense | 15,973 | 9,072 | 14,184 | ||
Income tax expense | 224 | 312 | 1,217 | ||
Real estate related depreciation and amortization | 27,683 | 27,053 | 29,474 | ||
EBITDA | 71,210 | 64,992 | 56,449 | ||
Corporate expenses | 7,526 | 7,516 | 6,318 | ||
Interest (income) and other (income) expense, net | (772) | 152 | (102) | ||
Professional fees and pre-opening costs related to Frenchman's Reef (1) | — | — | 6,378 | ||
Loss on early extinguishment of debt | — | 9,698 | 2,373 | ||
Hotel EBITDA | 77,964 | 82,358 | 71,416 | ||
Non-cash lease expense and other amortization | 1,533 | 1,551 | 1,750 | ||
Hotel pre-opening costs | 496 | — | — | ||
Hotel manager transition items | — | 11 | 582 | ||
Hotel Adjusted EBITDA | $ 79,993 | $ 83,920 | $ 73,748 | ||
Nine Months Ended September 30, | |||||
2023 | 2022 | 2019 | |||
Net income | $ 75,652 | $ 91,316 | $ 49,628 | ||
Interest expense | 48,712 | 22,866 | 38,264 | ||
Income tax expense | 420 | 949 | 1,939 | ||
Real estate related depreciation and amortization | 82,995 | 81,097 | 87,805 | ||
EBITDA | 207,779 | 196,228 | 177,636 | ||
Corporate expenses | 23,677 | 22,275 | 20,785 | ||
Interest (income) and other (income) expense, net | (1,717) | 1,044 | (510) | ||
Impairment losses | 941 | 2,843 | — | ||
Professional fees and pre-opening costs related to Frenchman's Reef (1) | — | — | 11,445 | ||
Loss on early extinguishment of debt | — | 9,698 | 2,373 | ||
Hotel EBITDA | 230,680 | 232,088 | 211,729 | ||
Non-cash lease expense and other amortization | 4,620 | 4,675 | 5,249 | ||
Hotel pre-opening costs | 1,038 | — | — | ||
Hotel manager transition items | — | 247 | 1,050 | ||
Severance costs (2) | — | (532) | — | ||
Hotel Adjusted EBITDA | $ 236,338 | $ 236,478 | $ 218,028 | ||
(1) | Represents pre-opening costs related to the re-opening of Frenchman's Reef, as well as legal and professional fees and other costs incurred at Frenchman's Reef as a result of Hurricane Irma that were not covered by insurance. |
(2) | Consists of severance costs incurred, or adjustments thereto, associated with the elimination of positions at our hotels, which are classified within other hotel expenses on the consolidated statement of operations. |
FFO and Adjusted FFO
The following tables are reconciliations of our GAAP net income to FFO and Adjusted FFO (in thousands):
Three Months Ended September 30, | |||||
2023 | 2022 | 2019 | |||
Net income | $ 27,330 | $ 28,555 | $ 11,574 | ||
Real estate related depreciation and amortization | 27,683 | 27,053 | 29,474 | ||
FFO | 55,013 | 55,608 | 41,048 | ||
Distribution to preferred stockholders | (2,454) | (2,454) | — | ||
FFO available to common stock and unit holders | 52,559 | 53,154 | 41,048 | ||
Non-cash lease expense and other amortization | 1,533 | 1,551 | 1,750 | ||
Professional fees and pre-opening costs related to Frenchman's Reef (1) | — | — | 6,378 | ||
Loss on early extinguishment of debt | — | 9,698 | 2,373 | ||
Hotel pre-opening costs | 496 | — | — | ||
Hotel manager transition items | — | 11 | 582 | ||
Fair value adjustments to interest rate swaps | — | (3,780) | 3,143 | ||
Adjusted FFO available to common stock and unit holders | $ 54,588 | $ 60,634 | $ 55,274 | ||
Adjusted FFO available to common stock and unit holders, per diluted share | $ 0.26 | $ 0.28 | $ 0.27 | ||
Nine Months Ended September 30, | |||||
2023 | 2022 | 2019 | |||
Net income | $ 75,652 | $ 91,316 | $ 49,628 | ||
Real estate related depreciation and amortization | 82,995 | 81,097 | 87,805 | ||
Impairment losses | 941 | 2,843 | — | ||
FFO | 159,588 | 175,256 | 137,433 | ||
Distribution to preferred stockholders | (7,362) | (7,362) | — | ||
FFO available to common stock and unit holders | 152,226 | 167,894 | 137,433 | ||
Non-cash lease expense and other amortization | 4,620 | 4,675 | 5,249 | ||
Professional fees and pre-opening costs related to Frenchman's Reef (1) | — | — | 11,445 | ||
Hotel pre-opening costs | 1,038 | — | — | ||
Hotel manager transition items | — | 247 | 1,050 | ||
Loss on early extinguishment of debt | — | 9,698 | 2,373 | ||
Severance costs (2) | — | (532) | — | ||
Fair value adjustments to interest rate swaps | 2,033 | (14,002) | 4,790 | ||
Adjusted FFO available to common stock and unit holders | $ 159,917 | $ 167,980 | $ 162,340 | ||
Adjusted FFO available to common stock and unit holders, per diluted share | $ 0.75 | $ 0.78 | $ 0.80 | ||
(1) | Represents pre-opening costs related to the re-opening of Frenchman's Reef, as well as legal and professional fees and other costs incurred at Frenchman's Reef as a result of Hurricane Irma that were not covered by insurance. |
(2) | Consists of severance costs incurred, or adjustments thereto, associated with the elimination of positions at our hotels, which are classified within other hotel expenses on the consolidated statement of operations. |
Reconciliation of Comparable Operating Results
The following presents the revenues, Hotel Adjusted EBITDA and Hotel Adjusted EBITDA Margin together with comparable prior year results, which excludes the results for our 2021 dispositions (in thousands):
Three Months Ended September 30, | |||||
2023 | 2022 | 2019 | |||
Revenues | $ 276,520 | $ 268,208 | $ 240,279 | ||
Hotel revenues from prior ownership (1) | 620 | 8,566 | 25,484 | ||
Hotel revenues from sold hotels (2) | — | — | (18,338) | ||
Comparable Revenues | $ 277,140 | $ 276,774 | $ 247,425 | ||
Hotel Adjusted EBITDA | $ 79,993 | $ 83,920 | $ 73,748 | ||
Hotel Adjusted EBITDA from prior ownership (1) | 1,125 | 2,915 | 5,720 | ||
Hotel Adjusted EBITDA from sold hotels (2) | — | — | (4,938) | ||
Comparable Hotel Adjusted EBITDA | $ 81,118 | $ 86,835 | $ 74,530 | ||
Hotel Adjusted EBITDA Margin | 28.93 % | 31.29 % | 30.69 % | ||
Comparable Hotel Adjusted EBITDA Margin | 29.27 % | 31.37 % | 30.12 % | ||
Nine Months Ended September 30, | |||||
2023 | 2022 | 2019 | |||
Revenues | $ 811,320 | $ 746,448 | $ 700,572 | ||
Hotel revenues from prior ownership (1) | 2,767 | 27,277 | 76,162 | ||
Hotel revenues from sold hotels (2) | — | — | (47,872) | ||
Comparable Revenues | $ 814,087 | $ 773,725 | $ 728,862 | ||
Hotel Adjusted EBITDA | $ 236,338 | $ 236,478 | $ 218,028 | ||
Hotel Adjusted EBITDA from prior ownership (1) | 1,656 | 8,693 | 17,461 | ||
Hotel Adjusted EBITDA from sold hotels (2) | — | — | (17,758) | ||
Comparable Hotel Adjusted EBITDA | $ 237,994 | $ 245,171 | $ 217,731 | ||
Hotel Adjusted EBITDA Margin | 29.13 % | 31.68 % | 31.12 % | ||
Comparable Hotel Adjusted EBITDA Margin | 29.23 % | 31.69 % | 29.87 % | ||
(1) | Amounts represent the pre-acquisition operating results for Bourbon Orleans Hotel from January 1, 2019 to July 28, 2021, Henderson Park Inn from January 1, 2019 to July 29, 2021, Henderson Beach Resort from January 1, 2019 to December 22, 2021, Tranquility Bay Beachfront Resort from January 1, 2019 to January 5, 2022, Lake Austin Spa Resort from January 1, 2019 to November 20, 2022 and Chico Hot Springs Resort from January 1, 2019 to July 31, 2023. The pre-acquisition operating results of the Kimpton Fort Lauderdale Beach Resort are excluded from all periods as the hotel opened in April 2021. The pre-acquisition operating results were obtained from the sellers of the hotels during the acquisition due diligence process. We have made no adjustments to the amounts provided to us by the seller. The pre-acquisition operating results were not audited or reviewed by the Company's independent auditors. |
(2) | Amounts represent the operating results of Frenchman's Reef and The Lexington Hotel. |
Selected Quarterly Comparable Operating Information
The following tables are presented to provide investors with selected quarterly comparable operating information. The operating information includes historical quarterly operating results for our portfolio, excluding the Kimpton Fort Lauderdale Beach Resort since the hotel opened in April 2021.
Quarter 1, 2019 | Quarter 2, 2019 | Quarter 3, 2019 | Quarter 4, 2019 | Full Year 2019 | |
ADR | $ 224.54 | $ 253.23 | $ 240.06 | $ 243.26 | $ 240.76 |
Occupancy | 72.2 % | 82.3 % | 81.3 % | 75.1 % | 77.7 % |
RevPAR | $ 162.14 | $ 208.45 | $ 195.19 | $ 182.59 | $ 187.17 |
Total RevPAR | $ 247.08 | $ 306.77 | $ 280.00 | $ 268.71 | $ 275.71 |
Revenues (in thousands) | $ 213,429 | $ 268,008 | $ 247,425 | $ 237,449 | $ 966,311 |
Hotel Adjusted EBITDA (in thousands) | $ 52,197 | $ 91,004 | $ 74,530 | $ 66,020 | $ 283,751 |
Hotel Adjusted EBITDA Margin | 24.46 % | 33.96 % | 30.12 % | 27.80 % | 29.36 % |
Available Rooms | 863,804 | 873,661 | 883,660 | 883,660 | 3,504,785 |
Quarter 1, 2022 | Quarter 2, 2022 | Quarter 3, 2022 | Quarter 4, 2022 | Full Year 2022 | |
ADR | $ 281.93 | $ 299.28 | $ 282.49 | $ 289.83 | $ 288.78 |
Occupancy | 56.0 % | 74.8 % | 75.1 % | 67.2 % | 68.3 % |
RevPAR | $ 157.86 | $ 223.81 | $ 212.27 | $ 194.91 | $ 197.36 |
Total RevPAR | $ 239.15 | $ 331.55 | $ 312.57 | $ 293.70 | $ 294.45 |
Revenues (in thousands) | $ 206,858 | $ 290,093 | $ 276,774 | $ 260,150 | $ 1,033,875 |
Hotel Adjusted EBITDA (in thousands) | $ 53,958 | $ 104,378 | $ 86,835 | $ 77,431 | $ 322,602 |
Hotel Adjusted EBITDA Margin | 26.08 % | 35.98 % | 31.37 % | 29.76 % | 31.20 % |
Available Rooms | 864,972 | 874,970 | 885,466 | 885,776 | 3,511,184 |
Quarter 1, 2023 | Quarter 2, 2023 | Quarter 3, 2023 | |
ADR | $ 276.48 | $ 293.44 | $ 274.00 |
Occupancy | 66.7 % | 76.7 % | 76.7 % |
RevPAR | $ 184.39 | $ 225.09 | $ 210.03 |
Total RevPAR | $ 281.32 | $ 334.17 | $ 312.35 |
Revenues (in thousands) | $ 243,859 | $ 293,088 | $ 277,140 |
Hotel Adjusted EBITDA (in thousands) | $ 62,450 | $ 94,426 | $ 81,118 |
Hotel Adjusted EBITDA Margin | 25.61 % | 32.22 % | 29.27 % |
Available Rooms | 866,846 | 877,058 | 887,279 |
Market Capitalization as of September 30, 2023 | ||
(in thousands) | ||
Enterprise Value | ||
Common equity capitalization (at September 30, 2023 closing price of $8.03/share) | $ 1,716,306 | |
Preferred equity capitalization (at liquidation value of $25.00/share) | 119,000 | |
Consolidated debt (face amount) | 1,180,625 | |
Cash and cash equivalents | (102,737) | |
Total enterprise value | $ 2,913,194 | |
Share Reconciliation | ||
Common shares outstanding | 209,627 | |
Operating partnership units | 1,037 | |
Unvested restricted stock held by management and employees | 1,201 | |
Share grants under deferred compensation plan | 1,872 | |
Combined shares and units | 213,737 | |
Debt Summary as of September 30, 2023 | ||||||||
(dollars in thousands) | ||||||||
Loan | Interest Rate | Term | Outstanding Principal | Maturity | ||||
Courtyard New York Manhattan / Midtown East | 4.40 % | Fixed | $ 74,808 | August 2024 | ||||
Worthington Renaissance Fort Worth Hotel | 3.66 % | Fixed | 74,210 | May 2025 | ||||
Hotel Clio | 4.33 % | Fixed | 56,443 | July 2025 | ||||
Westin Boston Seaport District | 4.36 % | Fixed | 175,164 | November 2025 | ||||
Unamortized debt issuance costs | (711) | |||||||
Total mortgage debt, net of unamortized debt issuance costs | 379,914 | |||||||
Unsecured term loan | SOFR + 1.35% | Variable | 500,000 | January 2028 | ||||
Unsecured term loan | SOFR + 1.35% | Variable | 300,000 | January 2025 (1) | ||||
Unamortized debt issuance costs | (663) | |||||||
Unsecured term loans, net of unamortized debt issuance costs | 799,337 | |||||||
Senior unsecured credit facility | SOFR + 1.40% | Variable | — | September 2026 (1) | ||||
Total debt, net of unamortized debt issuance costs | $ 1,179,251 | |||||||
Weighted-average interest rate of fixed rate debt | 3.86 % | |||||||
Total weighted-average interest rate (2) | 5.07 % | |||||||
(1) | May be extended for an additional year upon the payment of applicable fees and the satisfaction of certain customary conditions. |
(2) | Weighted-average interest rate includes effect of interest rate swaps. |
Operating Statistics – Third Quarter | ||||||||||||
Number of Rooms | ADR | Occupancy | RevPAR | |||||||||
3Q 2023 | 3Q 2022 | B/(W) 2022 | 3Q 2023 | 3Q 2022 | B/(W) 2022 | 3Q 2023 | 3Q 2022 | B/(W) 2022 | ||||
Atlanta Marriott Alpharetta | 318 | $ 154.82 | $ 155.35 | (0.3) % | 69.4 % | 60.7 % | 8.7 % | $ 107.43 | $ 94.35 | 13.9 % | ||
Bourbon Orleans Hotel | 220 | $ 201.95 | $ 198.82 | 1.6 % | 66.4 % | 67.0 % | (0.6) % | $ 134.04 | $ 133.24 | 0.6 % | ||
Cavallo Point, The Lodge at the Golden Gate | 142 | $ 589.26 | $ 723.68 | (18.6) % | 57.8 % | 50.8 % | 7.0 % | $ 340.41 | $ 367.33 | (7.3) % | ||
Chicago Marriott Downtown Magnificent Mile | 1,200 | $ 250.00 | $ 253.84 | (1.5) % | 71.4 % | 72.9 % | (1.5) % | $ 178.61 | $ 185.02 | (3.5) % | ||
Chico Hot Springs Resort | 117 | $ 183.71 | $ 175.42 | 4.7 % | 79.6 % | 75.3 % | 4.3 % | $ 146.31 | $ 132.01 | 10.8 % | ||
Courtyard Denver Downtown | 177 | $ 241.09 | $ 232.76 | 3.6 % | 82.6 % | 83.0 % | (0.4) % | $ 199.12 | $ 193.21 | 3.1 % | ||
Courtyard New York Manhattan/Fifth Avenue | 189 | $ 299.95 | $ 288.20 | 4.1 % | 97.2 % | 96.8 % | 0.4 % | $ 291.65 | $ 279.10 | 4.5 % | ||
Courtyard New York Manhattan/Midtown East | 321 | $ 356.68 | $ 338.74 | 5.3 % | 91.2 % | 90.7 % | 0.5 % | $ 325.19 | $ 307.21 | 5.9 % | ||
Embassy Suites by Hilton Bethesda | 272 | $ 159.76 | $ 140.80 | 13.5 % | 73.8 % | 56.9 % | 16.9 % | $ 117.93 | $ 80.12 | 47.2 % | ||
Havana Cabana Key West | 106 | $ 236.66 | $ 259.31 | (8.7) % | 78.0 % | 80.0 % | (2.0) % | $ 184.58 | $ 207.40 | (11.0) % | ||
Henderson Beach Resort | 254 | $ 470.03 | $ 501.78 | (6.3) % | 67.4 % | 76.7 % | (9.3) % | $ 316.76 | $ 385.06 | (17.7) % | ||
Henderson Park Inn | 37 | $ 648.09 | $ 711.75 | (8.9) % | 80.5 % | 81.3 % | (0.8) % | $ 521.86 | $ 578.98 | (9.9) % | ||
Hilton Burlington Lake Champlain | 258 | $ 323.75 | $ 315.25 | 2.7 % | 86.1 % | 88.5 % | (2.4) % | $ 278.74 | $ 279.11 | (0.1) % | ||
Hilton Garden Inn New York/Times Square Central | 282 | $ 276.77 | $ 276.98 | (0.1) % | 97.0 % | 98.4 % | (1.4) % | $ 268.48 | $ 272.65 | (1.5) % | ||
Hotel Clio | 199 | $ 331.92 | $ 329.77 | 0.7 % | 77.4 % | 76.3 % | 1.1 % | $ 256.83 | $ 251.56 | 2.1 % | ||
Hotel Emblem San Francisco | 96 | $ 234.01 | $ 244.50 | (4.3) % | 70.3 % | 80.7 % | (10.4) % | $ 164.57 | $ 197.39 | (16.6) % | ||
Hotel Palomar Phoenix | 242 | $ 164.84 | $ 172.35 | (4.4) % | 76.1 % | 61.7 % | 14.4 % | $ 125.47 | $ 106.41 | 17.9 % | ||
Kimpton Fort Lauderdale Beach Resort | 96 | $ 134.25 | $ 157.26 | (14.6) % | 46.4 % | 57.5 % | (11.1) % | $ 62.25 | $ 90.40 | (31.1) % | ||
Kimpton Shorebreak Resort | 157 | $ 378.69 | $ 406.55 | (6.9) % | 85.0 % | 88.0 % | (3.0) % | $ 321.77 | $ 357.63 | (10.0) % | ||
L'Auberge de Sedona | 88 | $ 765.90 | $ 766.54 | (0.1) % | 54.6 % | 68.8 % | (14.2) % | $ 418.24 | $ 527.38 | (20.7) % | ||
Lake Austin Spa Resort | 40 | $ 983.07 | $ 1,019.44 | (3.6) % | 53.1 % | 60.8 % | (7.7) % | $ 521.72 | $ 619.70 | (15.8) % | ||
Margaritaville Beach House Key West | 186 | $ 313.67 | $ 353.53 | (11.3) % | 77.8 % | 70.5 % | 7.3 % | $ 244.18 | $ 249.32 | (2.1) % | ||
Orchards Inn Sedona | 70 | $ 240.57 | $ 228.40 | 5.3 % | 49.4 % | 65.4 % | (16.0) % | $ 118.79 | $ 149.38 | (20.5) % | ||
Salt Lake City Marriott Downtown at City Creek | 510 | $ 181.37 | $ 173.45 | 4.6 % | 61.6 % | 67.9 % | (6.3) % | $ 111.69 | $ 117.76 | (5.2) % | ||
The Dagny | 403 | $ 289.64 | $ 334.30 | (13.4) % | 87.3 % | 88.2 % | (0.9) % | $ 252.93 | $ 294.90 | (14.2) % | ||
The Gwen Hotel | 311 | $ 320.89 | $ 329.43 | (2.6) % | 79.9 % | 78.7 % | 1.2 % | $ 256.33 | $ 259.15 | (1.1) % | ||
The Hythe Vail | 344 | $ 282.10 | $ 269.70 | 4.6 % | 65.0 % | 64.9 % | 0.1 % | $ 183.45 | $ 174.94 | 4.9 % | ||
The Landing Lake Tahoe Resort & Spa | 82 | $ 569.67 | $ 670.73 | (15.1) % | 76.9 % | 63.1 % | 13.8 % | $ 437.83 | $ 423.03 | 3.5 % | ||
The Lindy Renaissance Charleston Hotel | 167 | $ 326.08 | $ 340.67 | (4.3) % | 88.9 % | 85.6 % | 3.3 % | $ 289.98 | $ 291.51 | (0.5) % | ||
The Lodge at Sonoma Resort | 182 | $ 490.51 | $ 502.90 | (2.5) % | 68.3 % | 70.5 % | (2.2) % | $ 334.84 | $ 354.59 | (5.6) % | ||
Tranquility Bay Beachfront Resort | 103 | $ 495.75 | $ 588.88 | (15.8) % | 79.3 % | 63.7 % | 15.6 % | $ 393.05 | $ 375.17 | 4.8 % | ||
Westin Boston Waterfront | 793 | $ 250.75 | $ 249.19 | 0.6 % | 92.4 % | 86.4 % | 6.0 % | $ 231.78 | $ 215.40 | 7.6 % | ||
Westin Fort Lauderdale Beach Resort | 433 | $ 187.46 | $ 201.15 | (6.8) % | 58.6 % | 67.8 % | (9.2) % | $ 109.90 | $ 136.47 | (19.5) % | ||
Westin San Diego Bayview | 436 | $ 223.42 | $ 216.33 | 3.3 % | 85.5 % | 87.4 % | (1.9) % | $ 191.04 | $ 189.13 | 1.0 % | ||
Westin Washington D.C. City Center | 410 | $ 185.80 | $ 196.28 | (5.3) % | 81.5 % | 61.3 % | 20.2 % | $ 151.37 | $ 120.35 | 25.8 % | ||
Worthington Renaissance Fort Worth Hotel | 504 | $ 186.10 | $ 176.37 | 5.5 % | 70.4 % | 65.8 % | 4.6 % | $ 130.98 | $ 115.99 | 12.9 % | ||
Comparable Total (1) | 9,649 | $ 274.00 | $ 282.49 | (3.0) % | 76.7 % | 75.1 % | 1.6 % | $ 210.03 | $ 212.27 | (1.1) % | ||
(1) | Amounts include the pre-acquisition operating results of hotels acquired in 2023 and 2022 and exclude the Kimpton Fort Lauderdale Beach Resort as the hotel opened during 2021. |
Operating Statistics – Third Quarter | ||||||||||||
Number of Rooms | ADR | Occupancy | RevPAR | |||||||||
3Q 2023 | 3Q 2019 | B/(W) 2019 | 3Q 2023 | 3Q 2019 | B/(W) 2019 | 3Q 2023 | 3Q 2019 | B/(W) 2019 | ||||
Atlanta Marriott Alpharetta | 318 | $ 154.82 | $ 163.80 | (5.5) % | 69.4 % | 72.9 % | (3.5) % | $ 107.43 | $ 119.41 | (10.0) % | ||
Bourbon Orleans Hotel | 220 | $ 201.95 | $ 193.21 | 4.5 % | 66.4 % | 75.3 % | (8.9) % | $ 134.04 | $ 145.55 | (7.9) % | ||
Cavallo Point, The Lodge at the Golden Gate | 142 | $ 589.26 | $ 469.36 | 25.5 % | 57.8 % | 68.1 % | (10.3) % | $ 340.41 | $ 319.72 | 6.5 % | ||
Chicago Marriott Downtown Magnificent Mile | 1,200 | $ 250.00 | $ 239.22 | 4.5 % | 71.4 % | 82.5 % | (11.1) % | $ 178.61 | $ 197.32 | (9.5) % | ||
Chico Hot Springs Resort | 117 | $ 183.71 | $ 147.95 | 24.2 % | 79.6 % | 93.3 % | (13.7) % | $ 146.31 | $ 137.97 | 6.0 % | ||
Courtyard Denver Downtown | 177 | $ 241.09 | $ 218.40 | 10.4 % | 82.6 % | 85.9 % | (3.3) % | $ 199.12 | $ 187.70 | 6.1 % | ||
Courtyard New York Manhattan/Fifth Avenue | 189 | $ 299.95 | $ 256.72 | 16.8 % | 97.2 % | 91.6 % | 5.6 % | $ 291.65 | $ 235.21 | 24.0 % | ||
Courtyard New York Manhattan/Midtown East | 321 | $ 356.68 | $ 266.37 | 33.9 % | 91.2 % | 97.4 % | (6.2) % | $ 325.19 | $ 259.56 | 25.3 % | ||
Embassy Suites by Hilton Bethesda | 272 | $ 159.76 | $ 167.95 | (4.9) % | 73.8 % | 70.4 % | 3.4 % | $ 117.93 | $ 118.20 | (0.2) % | ||
Havana Cabana Key West | 106 | $ 236.66 | $ 170.13 | 39.1 % | 78.0 % | 85.9 % | (7.9) % | $ 184.58 | $ 146.13 | 26.3 % | ||
Henderson Beach Resort | 254 | $ 470.03 | $ 333.54 | 40.9 % | 67.4 % | 65.7 % | 1.7 % | $ 316.76 | $ 219.30 | 44.4 % | ||
Henderson Park Inn | 37 | $ 648.09 | $ 520.73 | 24.5 % | 80.5 % | 87.7 % | (7.2) % | $ 521.86 | $ 456.78 | 14.2 % | ||
Hilton Burlington Lake Champlain | 258 | $ 323.75 | $ 244.03 | 32.7 % | 86.1 % | 90.1 % | (4.0) % | $ 278.74 | $ 219.97 | 26.7 % | ||
Hilton Garden Inn New York/Times Square Central | 282 | $ 276.77 | $ 249.41 | 11.0 % | 97.0 % | 98.7 % | (1.7) % | $ 268.48 | $ 246.24 | 9.0 % | ||
Hotel Clio | 199 | $ 331.92 | $ 262.04 | 26.7 % | 77.4 % | 85.9 % | (8.5) % | $ 256.83 | $ 225.20 | 14.0 % | ||
Hotel Emblem San Francisco | 96 | $ 234.01 | $ 247.06 | (5.3) % | 70.3 % | 91.7 % | (21.4) % | $ 164.57 | $ 226.47 | (27.3) % | ||
Hotel Palomar Phoenix | 242 | $ 164.84 | $ 143.55 | 14.8 % | 76.1 % | 73.4 % | 2.7 % | $ 125.47 | $ 105.30 | 19.2 % | ||
Kimpton Shorebreak Resort | 157 | $ 378.69 | $ 306.54 | 23.5 % | 85.0 % | 81.8 % | 3.2 % | $ 321.77 | $ 250.72 | 28.3 % | ||
L'Auberge de Sedona | 88 | $ 765.90 | $ 533.79 | 43.5 % | 54.6 % | 71.7 % | (17.1) % | $ 418.24 | $ 382.61 | 9.3 % | ||
Lake Austin Spa Resort | 40 | $ 983.07 | $ 795.98 | 23.5 % | 53.1 % | 68.7 % | (15.6) % | $ 521.72 | $ 546.80 | (4.6) % | ||
Margaritaville Beach House Key West | 186 | $ 313.67 | $ 205.47 | 52.7 % | 77.8 % | 61.4 % | 16.4 % | $ 244.18 | $ 126.16 | 93.5 % | ||
Orchards Inn Sedona | 70 | $ 240.57 | $ 207.09 | 16.2 % | 49.4 % | 74.3 % | (24.9) % | $ 118.79 | $ 153.97 | (22.8) % | ||
Salt Lake City Marriott Downtown at City Creek | 510 | $ 181.37 | $ 179.29 | 1.2 % | 61.6 % | 76.1 % | (14.5) % | $ 111.69 | $ 136.50 | (18.2) % | ||
The Dagny | 403 | $ 289.64 | $ 342.48 | (15.4) % | 87.3 % | 92.6 % | (5.3) % | $ 252.93 | $ 317.16 | (20.3) % | ||
The Gwen Hotel | 311 | $ 320.89 | $ 280.57 | 14.4 % | 79.9 % | 91.3 % | (11.4) % | $ 256.33 | $ 256.27 | — % | ||
The Hythe Vail | 344 | $ 282.10 | $ 212.25 | 32.9 % | 65.0 % | 70.4 % | (5.4) % | $ 183.45 | $ 149.45 | 22.8 % | ||
The Landing Lake Tahoe Resort & Spa | 82 | $ 569.67 | $ 376.60 | 51.3 % | 76.9 % | 86.4 % | (9.5) % | $ 437.83 | $ 325.43 | 34.5 % | ||
The Lindy Renaissance Charleston Hotel | 167 | $ 326.08 | $ 239.40 | 36.2 % | 88.9 % | 77.9 % | 11.0 % | $ 289.98 | $ 186.38 | 55.6 % | ||
The Lodge at Sonoma Resort | 182 | $ 490.51 | $ 349.59 | 40.3 % | 68.3 % | 83.8 % | (15.5) % | $ 334.84 | $ 292.92 | 14.3 % | ||
Tranquility Bay Beachfront Resort | 103 | $ 495.75 | $ 331.66 | 49.5 % | 79.3 % | 80.5 % | (1.2) % | $ 393.05 | $ 267.05 | 47.2 % | ||
Westin Boston Waterfront | 793 | $ 250.75 | $ 261.88 | (4.3) % | 92.4 % | 84.5 % | 7.9 % | $ 231.78 | $ 221.26 | 4.8 % | ||
Westin Fort Lauderdale Beach Resort | 433 | $ 187.46 | $ 144.14 | 30.1 % | 58.6 % | 69.6 % | (11.0) % | $ 109.90 | $ 100.29 | 9.6 % | ||
Westin San Diego Bayview | 436 | $ 223.42 | $ 192.85 | 15.9 % | 85.5 % | 86.0 % | (0.5) % | $ 191.04 | $ 165.84 | 15.2 % | ||
Westin Washington D.C. City Center | 410 | $ 185.80 | $ 178.69 | 4.0 % | 81.5 % | 90.7 % | (9.2) % | $ 151.37 | $ 162.01 | (6.6) % | ||
Worthington Renaissance Fort Worth Hotel | 504 | $ 186.10 | $ 177.73 | 4.7 % | 70.4 % | 69.5 % | 0.9 % | $ 130.98 | $ 123.48 | 6.1 % | ||
Comparable Total (1) | 9,649 | $ 274.00 | $ 240.06 | 14.1 % | 76.7 % | 81.3 % | (4.6) % | $ 210.03 | $ 195.19 | 7.6 % | ||
(1) | Amounts include the pre-acquisition operating results of hotels acquired in 2023, 2022 and 2021 and exclude the Kimpton Fort Lauderdale Beach Resort as the hotel opened during 2021. |
Operating Statistics – Year to Date | ||||||||||||
Number of Rooms | ADR | Occupancy | RevPAR | |||||||||
YTD 2023 | YTD 2022 | B/(W) 2022 | YTD 2023 | YTD 2022 | B/(W) 2022 | YTD 2023 | YTD 2022 | B/(W) 2022 | ||||
Atlanta Marriott Alpharetta | 318 | $ 154.52 | $ 150.91 | 2.4 % | 68.5 % | 54.9 % | 13.6 % | $ 105.84 | $ 82.78 | 27.9 % | ||
Bourbon Orleans Hotel | 220 | $ 236.68 | $ 231.33 | 2.3 % | 76.9 % | 60.9 % | 16.0 % | $ 182.12 | $ 140.87 | 29.3 % | ||
Cavallo Point, The Lodge at the Golden Gate | 142 | $ 590.72 | $ 714.46 | (17.3) % | 55.8 % | 51.7 % | 4.1 % | $ 329.54 | $ 369.12 | (10.7) % | ||
Chicago Marriott Downtown Magnificent Mile | 1,200 | $ 246.14 | $ 241.50 | 1.9 % | 60.7 % | 53.9 % | 6.8 % | $ 149.41 | $ 130.14 | 14.8 % | ||
Chico Hot Springs Resort | 117 | $ 183.71 | $ 175.42 | 4.7 % | 79.6 % | 75.3 % | 4.3 % | $ 146.31 | $ 132.01 | 10.8 % | ||
Courtyard Denver Downtown | 177 | $ 220.51 | $ 208.00 | 6.0 % | 78.4 % | 75.2 % | 3.2 % | $ 172.83 | $ 156.32 | 10.6 % | ||
Courtyard New York Manhattan/Fifth Avenue | 189 | $ 270.33 | $ 251.64 | 7.4 % | 95.1 % | 92.0 % | 3.1 % | $ 257.20 | $ 231.47 | 11.1 % | ||
Courtyard New York Manhattan/Midtown East | 321 | $ 314.26 | $ 299.94 | 4.8 % | 90.5 % | 81.3 % | 9.2 % | $ 284.44 | $ 243.72 | 16.7 % | ||
Embassy Suites by Hilton Bethesda | 272 | $ 163.58 | $ 144.33 | 13.3 % | 71.9 % | 48.8 % | 23.1 % | $ 117.54 | $ 70.50 | 66.7 % | ||
Havana Cabana Key West | 106 | $ 305.56 | $ 337.36 | (9.4) % | 84.2 % | 87.9 % | (3.7) % | $ 257.20 | $ 296.70 | (13.3) % | ||
Henderson Park Resort | 254 | $ 458.10 | $ 494.31 | (7.3) % | 61.7 % | 69.8 % | (8.1) % | $ 282.64 | $ 344.91 | (18.1) % | ||
Henderson Park Inn | 37 | $ 627.97 | $ 668.31 | (6.0) % | 70.2 % | 77.7 % | (7.5) % | $ 440.90 | $ 519.31 | (15.1) % | ||
Hilton Burlington Lake Champlain | 258 | $ 252.40 | $ 246.52 | 2.4 % | 76.2 % | 74.7 % | 1.5 % | $ 192.25 | $ 184.15 | 4.4 % | ||
Hilton Garden Inn New York/Times Square Central | 282 | $ 252.61 | $ 247.70 | 2.0 % | 89.4 % | 91.5 % | (2.1) % | $ 225.73 | $ 226.63 | (0.4) % | ||
Hotel Clio | 199 | $ 320.35 | $ 305.20 | 5.0 % | 71.2 % | 69.6 % | 1.6 % | $ 227.96 | $ 212.32 | 7.4 % | ||
Hotel Emblem San Francisco | 96 | $ 245.70 | $ 227.72 | 7.9 % | 67.0 % | 73.5 % | (6.5) % | $ 164.55 | $ 167.44 | (1.7) % | ||
Hotel Palomar Phoenix | 242 | $ 221.99 | $ 215.33 | 3.1 % | 76.0 % | 67.9 % | 8.1 % | $ 168.72 | $ 146.24 | 15.4 % | ||
Kimpton Fort Lauderdale Beach Resort | 96 | $ 217.03 | $ 231.86 | (6.4) % | 66.3 % | 66.4 % | (0.1) % | $ 143.81 | $ 154.03 | (6.6) % | ||
Kimpton Shorebreak Resort | 157 | $ 338.09 | $ 357.34 | (5.4) % | 81.3 % | 81.7 % | (0.4) % | $ 274.92 | $ 292.03 | (5.9) % | ||
L'Auberge de Sedona | 88 | $ 907.24 | $ 964.94 | (6.0) % | 60.0 % | 72.6 % | (12.6) % | $ 544.22 | $ 700.49 | (22.3) % | ||
Lake Austin Spa Resort | 40 | $ 1,071.67 | $ 1,084.98 | (1.2) % | 58.5 % | 68.9 % | (10.4) % | $ 627.30 | $ 747.66 | (16.1) % | ||
Margaritaville Beach House Key West | 186 | $ 403.61 | $ 469.76 | (14.1) % | 84.3 % | 83.1 % | 1.2 % | $ 340.19 | $ 390.37 | (12.9) % | ||
Orchards Inn Sedona | 70 | $ 281.82 | $ 298.31 | (5.5) % | 59.6 % | 66.4 % | (6.8) % | $ 167.87 | $ 197.97 | (15.2) % | ||
Salt Lake City Marriott Downtown at City Creek | 510 | $ 190.89 | $ 176.93 | 7.9 % | 63.3 % | 60.2 % | 3.1 % | $ 120.75 | $ 106.44 | 13.4 % | ||
The Dagny | 403 | $ 291.35 | $ 291.00 | 0.1 % | 75.3 % | 79.0 % | (3.7) % | $ 219.35 | $ 229.86 | (4.6) % | ||
The Gwen Hotel | 311 | $ 299.15 | $ 296.79 | 0.8 % | 74.5 % | 72.4 % | 2.1 % | $ 222.97 | $ 214.85 | 3.8 % | ||
The Hythe Vail | 344 | $ 435.10 | $ 416.30 | 4.5 % | 61.1 % | 56.8 % | 4.3 % | $ 265.81 | $ 236.33 | 12.5 % | ||
The Landing Lake Tahoe Resort & Spa | 82 | $ 472.57 | $ 527.40 | (10.4) % | 53.0 % | 52.8 % | 0.2 % | $ 250.32 | $ 278.45 | (10.1) % | ||
The Lindy Renaissance Charleston Hotel | 167 | $ 352.01 | $ 357.66 | (1.6) % | 89.2 % | 86.7 % | 2.5 % | $ 313.99 | $ 310.06 | 1.3 % | ||
The Lodge at Sonoma Resort | 182 | $ 455.78 | $ 464.17 | (1.8) % | 62.7 % | 63.4 % | (0.7) % | $ 285.78 | $ 294.12 | (2.8) % | ||
Tranquility Bay Beachfront Resort | 103 | $ 652.82 | $ 786.68 | (17.0) % | 77.8 % | 76.1 % | 1.7 % | $ 507.60 | $ 598.62 | (15.2) % | ||
Westin Boston Waterfront | 793 | $ 243.78 | $ 238.48 | 2.2 % | 85.3 % | 75.5 % | 9.8 % | $ 207.90 | $ 180.00 | 15.5 % | ||
Westin Fort Lauderdale Beach Resort | 433 | $ 274.94 | $ 271.85 | 1.1 % | 73.3 % | 79.2 % | (5.9) % | $ 201.56 | $ 215.27 | (6.4) % | ||
Westin San Diego Bayview | 436 | $ 214.93 | $ 203.80 | 5.5 % | 79.9 % | 74.1 % | 5.8 % | $ 171.62 | $ 151.06 | 13.6 % | ||
Westin Washington D.C. City Center | 410 | $ 216.66 | $ 210.68 | 2.8 % | 75.9 % | 58.8 % | 17.1 % | $ 164.39 | $ 123.90 | 32.7 % | ||
Worthington Renaissance Fort Worth Hotel | 504 | $ 194.08 | $ 186.23 | 4.2 % | 74.5 % | 68.0 % | 6.5 % | $ 144.59 | $ 126.62 | 14.2 % | ||
Comparable Total (1) | 9,649 | $ 281.52 | $ 288.43 | (2.4) % | 73.4 % | 68.7 % | 4.7 % | $ 206.60 | $ 198.19 | 4.2 % | ||
(1) | Amounts include the pre-acquisition operating results of hotels acquired in 2023 and 2022 and exclude the Kimpton Fort Lauderdale Beach Resort as the hotel opened during 2021. |
.
Operating Statistics – Year to Date | ||||||||||||
Number of Rooms | ADR | Occupancy | RevPAR | |||||||||
YTD 2023 | YTD 2019 | B/(W) 2019 | YTD 2023 | YTD 2019 | B/(W) 2019 | YTD 2023 | YTD 2019 | B/(W) 2019 | ||||
Atlanta Marriott Alpharetta | 318 | $ 154.52 | $ 166.97 | (7.5) % | 68.5 % | 72.7 % | (4.2) % | $ 105.84 | $ 121.42 | (12.8) % | ||
Bourbon Orleans Hotel | 220 | $ 236.68 | $ 217.20 | 9.0 % | 76.9 % | 82.8 % | (5.9) % | $ 182.12 | $ 179.87 | 1.3 % | ||
Cavallo Point, The Lodge at the Golden Gate | 142 | $ 590.72 | $ 458.60 | 28.8 % | 55.8 % | 65.2 % | (9.4) % | $ 329.54 | $ 298.90 | 10.3 % | ||
Chicago Marriott Downtown Magnificent Mile | 1,200 | $ 246.14 | $ 225.86 | 9.0 % | 60.7 % | 72.7 % | (12.0) % | $ 149.41 | $ 164.20 | (9.0) % | ||
Chico Hot Springs Resort | 117 | $ 183.71 | $ 147.95 | 24.2 % | 79.6 % | 93.3 % | (13.7) % | $ 146.31 | $ 137.97 | 6.0 % | ||
Courtyard Denver Downtown | 177 | $ 220.51 | $ 200.80 | 9.8 % | 78.4 % | 81.1 % | (2.7) % | $ 172.83 | $ 162.75 | 6.2 % | ||
Courtyard New York Manhattan/Fifth Avenue | 189 | $ 270.33 | $ 248.54 | 8.8 % | 95.1 % | 86.7 % | 8.4 % | $ 257.20 | $ 215.49 | 19.4 % | ||
Courtyard New York Manhattan/Midtown East | 321 | $ 314.26 | $ 244.82 | 28.4 % | 90.5 % | 95.6 % | (5.1) % | $ 284.44 | $ 234.03 | 21.5 % | ||
Embassy Suites by Hilton Bethesda | 272 | $ 163.58 | $ 176.98 | (7.6) % | 71.9 % | 73.0 % | (1.1) % | $ 117.54 | $ 129.23 | (9.0) % | ||
Havana Cabana Key West | 106 | $ 305.56 | $ 210.19 | 45.4 % | 84.2 % | 90.3 % | (6.1) % | $ 257.20 | $ 189.78 | 35.5 % | ||
Henderson Beach Resort | 254 | $ 458.10 | $ 315.85 | 45.0 % | 61.7 % | 60.0 % | 1.7 % | $ 282.64 | $ 189.66 | 49.0 % | ||
Henderson Park Inn | 37 | $ 627.97 | $ 480.49 | 30.7 % | 70.2 % | 77.1 % | (6.9) % | $ 440.90 | $ 370.28 | 19.1 % | ||
Hilton Burlington Lake Champlain | 258 | $ 252.40 | $ 193.56 | 30.4 % | 76.2 % | 81.7 % | (5.5) % | $ 192.25 | $ 158.11 | 21.6 % | ||
Hilton Garden Inn New York/Times Square Central | 282 | $ 252.61 | $ 235.87 | 7.1 % | 89.4 % | 98.5 % | (9.1) % | $ 225.73 | $ 232.29 | (2.8) % | ||
Hotel Clio | 199 | $ 320.35 | $ 258.63 | 23.9 % | 71.2 % | 70.8 % | 0.4 % | $ 227.96 | $ 183.12 | 24.5 % | ||
Hotel Emblem San Francisco | 96 | $ 245.70 | $ 240.00 | 2.4 % | 67.0 % | 78.9 % | (11.9) % | $ 164.55 | $ 189.34 | (13.1) % | ||
Hotel Palomar Phoenix | 242 | $ 221.99 | $ 185.74 | 19.5 % | 76.0 % | 82.7 % | (6.7) % | $ 168.72 | $ 153.51 | 9.9 % | ||
Kimpton Shorebreak Resort | 157 | $ 338.09 | $ 268.57 | 25.9 % | 81.3 % | 78.7 % | 2.6 % | $ 274.92 | $ 211.27 | 30.1 % | ||
L'Auberge de Sedona | 88 | $ 907.24 | $ 596.05 | 52.2 % | 60.0 % | 78.6 % | (18.6) % | $ 544.22 | $ 468.42 | 16.2 % | ||
Lake Austin Spa Resort | 40 | $ 1,071.67 | $ 825.66 | 29.8 % | 58.5 % | 63.6 % | (5.1) % | $ 627.30 | $ 524.81 | 19.5 % | ||
Margaritaville Beach House Key West | 186 | $ 403.61 | $ 259.71 | 55.4 % | 84.3 % | 80.5 % | 3.8 % | $ 340.19 | $ 209.08 | 62.7 % | ||
Orchards Inn Sedona | 70 | $ 281.82 | $ 244.33 | 15.3 % | 59.6 % | 77.7 % | (18.1) % | $ 167.87 | $ 189.96 | (11.6) % | ||
Salt Lake City Marriott Downtown at City Creek | 510 | $ 190.89 | $ 173.43 | 10.1 % | 63.3 % | 69.4 % | (6.1) % | $ 120.75 | $ 120.42 | 0.3 % | ||
The Dagny | 403 | $ 291.35 | $ 308.79 | (5.6) % | 75.3 % | 88.9 % | (13.6) % | $ 219.35 | $ 274.58 | (20.1) % | ||
The Gwen Hotel | 311 | $ 299.15 | $ 256.86 | 16.5 % | 74.5 % | 83.3 % | (8.8) % | $ 222.97 | $ 213.95 | 4.2 % | ||
The Hythe Vail | 344 | $ 435.10 | $ 298.07 | 46.0 % | 61.1 % | 65.6 % | (4.5) % | $ 265.81 | $ 195.66 | 35.9 % | ||
The Landing Lake Tahoe Resort & Spa | 82 | $ 472.57 | $ 321.13 | 47.2 % | 53.0 % | 65.4 % | (12.4) % | $ 250.32 | $ 210.11 | 19.1 % | ||
The Lindy Renaissance Charleston Hotel | 167 | $ 352.01 | $ 260.92 | 34.9 % | 89.2 % | 84.0 % | 5.2 % | $ 313.99 | $ 219.09 | 43.3 % | ||
The Lodge at Sonoma Resort | 182 | $ 455.78 | $ 310.27 | 46.9 % | 62.7 % | 74.3 % | (11.6) % | $ 285.78 | $ 230.57 | 23.9 % | ||
Tranquility Bay Beachfront Resort | 103 | $ 652.82 | $ 417.59 | 56.3 % | 77.8 % | 87.4 % | (9.6) % | $ 507.60 | $ 365.09 | 39.0 % | ||
Westin Boston Waterfront | 793 | $ 243.78 | $ 251.43 | (3.0) % | 85.3 % | 78.4 % | 6.9 % | $ 207.90 | $ 197.05 | 5.5 % | ||
Westin Fort Lauderdale Beach Resort | 433 | $ 274.94 | $ 204.38 | 34.5 % | 73.3 % | 81.8 % | (8.5) % | $ 201.56 | $ 167.26 | 20.5 % | ||
Westin San Diego Bayview | 436 | $ 214.93 | $ 194.30 | 10.6 % | 79.9 % | 82.0 % | (2.1) % | $ 171.62 | $ 159.39 | 7.7 % | ||
Westin Washington D.C. City Center | 410 | $ 216.66 | $ 206.84 | 4.7 % | 75.9 % | 86.9 % | (11.0) % | $ 164.39 | $ 179.77 | (8.6) % | ||
Worthington Renaissance Fort Worth Hotel | 504 | $ 194.08 | $ 186.24 | 4.2 % | 74.5 % | 75.4 % | (0.9) % | $ 144.59 | $ 140.50 | 2.9 % | ||
Comparable Total (1) | 9,649 | $ 281.52 | $ 239.96 | 17.3 % | 73.4 % | 78.6 % | (5.2) % | $ 206.60 | $ 188.72 | 9.5 % | ||
(1) | Amounts include the pre-acquisition operating results of hotels acquired in 2023, 2022 and 2021 and exclude the Kimpton Fort Lauderdale Beach Resort as the hotel opened during 2021. |
Hotel Adjusted EBITDA Reconciliation - Third Quarter 2023 | ||||||||
Net Income / (Loss) | Plus: | Plus: | Plus: | Equals: Hotel Adjusted EBITDA | ||||
Total Revenues | Depreciation | Interest Expense | Adjustments (1) | |||||
Atlanta Marriott Alpharetta | $ 4,328 | $ 1,018 | $ 367 | $ — | $ — | $ 1,385 | ||
Bourbon Orleans Hotel | $ 3,437 | $ 76 | $ 866 | $ — | $ 6 | $ 948 | ||
Cavallo Point, The Lodge at the Golden Gate | $ 11,114 | $ 1,348 | $ 1,410 | $ — | $ 94 | $ 2,852 | ||
Chicago Marriott Downtown Magnificent Mile | $ 32,302 | $ 8,332 | $ 3,517 | $ 6 | $ (397) | $ 11,458 | ||
Chico Hot Springs Resort | $ 2,595 | $ 357 | $ 195 | $ — | $ — | $ 552 | ||
Courtyard Denver Downtown | $ 3,562 | $ 1,386 | $ 372 | $ — | $ — | $ 1,758 | ||
Courtyard New York Manhattan/Fifth Avenue | $ 5,327 | $ 780 | $ 350 | $ — | $ 253 | $ 1,383 | ||
Courtyard New York Manhattan/Midtown East | $ 9,921 | $ 2,073 | $ 519 | $ 895 | $ — | $ 3,487 | ||
Embassy Suites by Hilton Bethesda | $ 3,361 | $ (1,765) | $ 570 | $ — | $ 1,463 | $ 268 | ||
Havana Cabana Key West | $ 2,517 | $ (35) | $ 290 | $ — | $ — | $ 255 | ||
Henderson Beach Resort | $ 11,721 | $ 2,034 | $ 1,015 | $ — | $ — | $ 3,049 | ||
Henderson Park Inn | $ 2,846 | $ 1,071 | $ 283 | $ — | $ — | $ 1,354 | ||
Hilton Burlington Lake Champlain | $ 8,421 | $ 3,555 | $ 551 | $ — | $ — | $ 4,106 | ||
Hilton Garden Inn New York/Times Square Central | $ 7,700 | $ 2,341 | $ 646 | $ — | $ — | $ 2,987 | ||
Hotel Clio | $ 7,679 | $ 836 | $ 768 | $ 635 | $ 5 | $ 2,244 | ||
Hotel Emblem San Francisco | $ 1,684 | $ (263) | $ 296 | $ — | $ — | $ 33 | ||
Hotel Palomar Phoenix | $ 4,724 | $ (200) | $ 496 | $ — | $ 178 | $ 474 | ||
Kimpton Fort Lauderdale Beach Resort | $ 1,022 | $ (938) | $ 312 | $ — | $ — | $ (626) | ||
Kimpton Shorebreak Resort | $ 6,203 | $ 2,048 | $ 381 | $ — | $ — | $ 2,429 | ||
L'Auberge de Sedona | $ 5,950 | $ 641 | $ 362 | $ — | $ — | $ 1,003 | ||
Lake Austin Spa Resort | $ 4,543 | $ 118 | $ 647 | $ — | $ — | $ 765 | ||
Margaritaville Beach House Key West | $ 5,933 | $ 934 | $ 775 | $ — | $ — | $ 1,709 | ||
Orchards Inn Sedona | $ 1,586 | $ 6 | $ 93 | $ — | $ 42 | $ 141 | ||
Salt Lake City Marriott Downtown at City Creek | $ 7,630 | $ 2,035 | $ 677 | $ — | $ 11 | $ 2,723 | ||
The Dagny | $ 10,420 | $ 2,096 | $ 1,522 | $ — | $ — | $ 3,618 | ||
The Gwen Hotel | $ 10,747 | $ 2,725 | $ 1,030 | $ — | $ — | $ 3,755 | ||
The Hythe Vail | $ 10,420 | $ 1,897 | $ 1,201 | $ — | $ — | $ 3,098 | ||
The Landing Lake Tahoe Resort & Spa | $ 5,767 | $ 2,676 | $ 135 | $ — | $ — | $ 2,811 | ||
The Lindy Renaissance Charleston Hotel | $ 5,507 | $ 1,798 | $ 477 | $ — | $ — | $ 2,275 | ||
The Lodge at Sonoma Resort | $ 8,746 | $ 2,337 | $ 635 | $ — | $ — | $ 2,972 | ||
Tranquility Bay Beachfront Resort | $ 4,888 | $ 713 | $ 449 | $ — | $ — | $ 1,162 | ||
Westin Boston Seaport District | $ 26,082 | $ 3,135 | $ 2,473 | $ 1,999 | $ (122) | $ 7,485 | ||
Westin Fort Lauderdale Beach Resort | $ 10,846 | $ (1,632) | $ 1,028 | $ — | $ — | $ (604) | ||
Westin San Diego Bayview | $ 10,006 | $ 2,585 | $ 850 | $ — | $ — | $ 3,435 | ||
Westin Washington D.C. City Center | $ 6,826 | $ (244) | $ 1,026 | $ — | $ — | $ 782 | ||
Worthington Renaissance Fort Worth Hotel | $ 10,159 | $ 651 | $ 1,099 | $ 718 | $ — | $ 2,468 | ||
Total | $ 276,520 | $ 46,525 | $ 27,683 | $ 4,253 | $ 1,533 | $ 79,993 | ||
Add: Prior Ownership Results (2) | $ 620 | $ 1,362 | $ (237) | $ — | $ — | $ 1,125 | ||
Comparable Total | $ 277,140 | $ 47,887 | $ 27,446 | $ 4,253 | $ 1,533 | $ 81,118 | ||
(1) | Includes non-cash expenses incurred by the hotels due to the straight lining of the rent from ground lease obligations and the non-cash amortization of intangible assets and liabilities. |
(2) | Represents the pre-acquisition operating results of our 2023 acquisition and excludes the Kimpton Fort Lauderdale Beach Resort. |
Hotel Adjusted EBITDA Reconciliation - Third Quarter 2022 | ||||||||
Net Income / (Loss) | Plus: | Plus: | Plus: | Equals: Hotel | ||||
Total Revenues | Depreciation | Interest Expense | Adjustments (1) | Adjusted EBITDA | ||||
Atlanta Marriott Alpharetta | $ 3,654 | $ 843 | $ 369 | $ — | $ — | $ 1,212 | ||
Bourbon Orleans Hotel | $ 3,763 | $ 218 | $ 838 | $ — | $ 6 | $ 1,062 | ||
Cavallo Point, The Lodge at the Golden Gate | $ 10,963 | $ 808 | $ 1,844 | $ — | $ 94 | $ 2,746 | ||
Chicago Marriott Downtown Magnificent Mile | $ 31,715 | $ 10,640 | $ 3,838 | $ 6 | $ (397) | $ 14,087 | ||
Courtyard Denver Downtown | $ 3,448 | $ 1,398 | $ 377 | $ — | $ — | $ 1,775 | ||
Courtyard New York Manhattan/Fifth Avenue | $ 4,907 | $ 490 | $ 332 | $ — | $ 253 | $ 1,075 | ||
Courtyard New York Manhattan/Midtown East | $ 9,332 | $ 1,742 | $ 485 | $ 915 | $ — | $ 3,142 | ||
Embassy Suites by Hilton Bethesda | $ 2,378 | $ (2,396) | $ 567 | $ — | $ 1,477 | $ (352) | ||
Havana Cabana Key West | $ 2,715 | $ 526 | $ 276 | $ — | $ — | $ 802 | ||
Henderson Beach Resort | $ 13,113 | $ 2,703 | $ 990 | $ — | $ — | $ 3,693 | ||
Henderson Park Inn | $ 2,750 | $ 1,010 | $ 228 | $ — | $ — | $ 1,238 | ||
Hilton Burlington Lake Champlain | $ 8,088 | $ 3,323 | $ 574 | $ — | $ — | $ 3,897 | ||
Hilton Garden Inn New York/Times Square Central | $ 7,727 | $ 1,903 | $ 634 | $ — | $ — | $ 2,537 | ||
Hotel Clio | $ 7,683 | $ 864 | $ 876 | $ 650 | $ 5 | $ 2,395 | ||
Hotel Emblem San Francisco | $ 2,065 | $ 132 | $ 296 | $ — | $ — | $ 428 | ||
Hotel Palomar Phoenix | $ 3,609 | $ (551) | $ 649 | $ — | $ 181 | $ 279 | ||
Kimpton Fort Lauderdale Beach Resort | $ 1,275 | $ (585) | $ 294 | $ — | $ — | $ (291) | ||
Kimpton Shorebreak Resort | $ 6,941 | $ 2,657 | $ 396 | $ — | $ — | $ 3,053 | ||
L'Auberge de Sedona | $ 6,727 | $ 614 | $ 352 | $ — | $ — | $ 966 | ||
Margaritaville Beach House Key West | $ 5,834 | $ 766 | $ 795 | $ — | $ — | $ 1,561 | ||
Orchards Inn Sedona | $ 1,772 | $ 27 | $ 85 | $ — | $ 42 | $ 154 | ||
Salt Lake City Marriott Downtown at City Creek | $ 7,649 | $ 1,620 | $ 571 | $ 621 | $ 11 | $ 2,823 | ||
The Dagny | $ 11,999 | $ 3,846 | $ 1,000 | $ — | $ — | $ 4,846 | ||
The Gwen Hotel | $ 11,129 | $ 3,115 | $ 1,062 | $ — | $ — | $ 4,177 | ||
The Hythe Vail | $ 9,529 | $ 1,248 | $ 1,207 | $ — | $ — | $ 2,455 | ||
The Landing Lake Tahoe Resort & Spa | $ 5,007 | $ 2,144 | $ 218 | $ — | $ — | $ 2,362 | ||
The Lindy Renaissance Charleston Hotel | $ 5,571 | $ 1,910 | $ 454 | $ — | $ — | $ 2,364 | ||
The Lodge at Sonoma Resort | $ 9,203 | $ 1,966 | $ 645 | $ 261 | $ — | $ 2,872 | ||
Tranquility Bay Beachfront Resort | $ 4,429 | $ 714 | $ 412 | $ — | $ — | $ 1,126 | ||
Westin Boston Seaport District | $ 24,663 | $ 2,904 | $ 2,448 | $ 2,048 | $ (122) | $ 7,278 | ||
Westin Fort Lauderdale Beach Resort | $ 13,223 | $ 987 | $ 967 | $ — | $ — | $ 1,954 | ||
Westin San Diego Bayview | $ 9,415 | $ 1,808 | $ 842 | $ 587 | $ — | $ 3,237 | ||
Westin Washington D.C. City Center | $ 6,019 | $ (1,189) | $ 1,026 | $ 597 | $ — | $ 434 | ||
Worthington Renaissance Fort Worth Hotel | $ 9,913 | $ 690 | $ 1,106 | $ 736 | $ 1 | $ 2,533 | ||
Total | $ 268,208 | $ 48,895 | $ 27,053 | $ 6,421 | $ 1,551 | $ 83,920 | ||
Add: Prior Ownership Results (2) | $ 8,566 | $ 2,684 | $ 231 | $ — | $ — | $ 2,915 | ||
Comparable Total | $ 276,774 | $ 51,579 | $ 27,284 | $ 6,421 | $ 1,551 | $ 86,835 | ||
(1) | Includes non-cash expenses incurred by the hotels due to the straight lining of the rent from ground lease obligations and the non-cash amortization of intangible assets and liabilities. |
(2) | Represents the pre-acquisition operating results of our 2023 and 2022 acquisitions and excludes the Kimpton Fort Lauderdale Beach Resort. |
Hotel Adjusted EBITDA Reconciliation - Third Quarter 2019 | ||||||||
Net Income / (Loss) | Plus: | Plus: | Plus: | Equals: Hotel | ||||
Total Revenues | Depreciation | Interest Expense | Adjustments (1) | Adjusted EBITDA | ||||
Atlanta Marriott Alpharetta | $ 4,787 | $ 1,123 | $ 455 | $ — | $ — | $ 1,578 | ||
Cavallo Point, The Lodge at the Golden Gate | $ 10,633 | $ 1,327 | $ 1,828 | $ — | $ 79 | $ 3,234 | ||
Chicago Marriott Downtown Magnificent Mile | $ 32,503 | $ 6,887 | $ 4,166 | $ (8) | $ (397) | $ 10,648 | ||
Courtyard Denver Downtown | $ 3,344 | $ 1,393 | $ 298 | $ — | $ — | $ 1,691 | ||
Courtyard New York Manhattan/Fifth Avenue | $ 4,191 | $ 103 | $ 449 | $ — | $ 253 | $ 805 | ||
Courtyard New York Manhattan/Midtown East | $ 7,909 | $ 570 | $ 697 | $ 970 | $ — | $ 2,237 | ||
Embassy Suites by Hilton Bethesda | $ 3,880 | $ (1,078) | $ 471 | $ — | $ 1,514 | $ 907 | ||
Frenchman's Reef & Morning Star Marriott Beach Resort | $ 1 | $ (2) | $ — | $ — | $ — | $ (2) | ||
Havana Cabana Key West | $ 1,996 | $ 87 | $ 260 | $ — | $ — | $ 347 | ||
Hilton Burlington Lake Champlain | $ 6,121 | $ 2,451 | $ 486 | $ — | $ — | $ 2,937 | ||
Hilton Garden Inn New York/Times Square Central | $ 6,508 | $ 944 | $ 838 | $ — | $ — | $ 1,782 | ||
Hotel Clio | $ 5,907 | $ 269 | $ 746 | $ 692 | $ 6 | $ 1,713 | ||
Hotel Emblem San Francisco | $ 2,305 | $ 399 | $ 297 | $ — | $ — | $ 696 | ||
Hotel Palomar Phoenix | $ 4,325 | $ (424) | $ 662 | $ 39 | $ 295 | $ 572 | ||
Kimpton Shorebreak Resort | $ 5,281 | $ 1,808 | $ 348 | $ — | $ 40 | $ 2,196 | ||
L'Auberge de Sedona | $ 5,636 | $ 727 | $ 508 | $ — | $ — | $ 1,235 | ||
Margaritaville Beach House Key West | $ 2,666 | $ (55) | $ 351 | $ — | $ — | $ 296 | ||
Orchards Inn Sedona | $ 1,598 | $ (11) | $ 238 | $ — | $ 42 | $ 269 | ||
Salt Lake City Marriott Downtown at City Creek | $ 8,849 | $ 2,368 | $ 575 | $ 608 | $ — | $ 3,551 | ||
The Dagny | $ 12,504 | $ 4,271 | $ 1,231 | $ — | $ — | $ 5,502 | ||
The Gwen Hotel | $ 10,771 | $ 3,256 | $ 1,077 | $ — | $ — | $ 4,333 | ||
The Hythe Vail | $ 8,109 | $ 1,140 | $ 1,011 | $ — | $ — | $ 2,151 | ||
The Landing Lake Tahoe Resort & Spa | $ 4,060 | $ 1,086 | $ 418 | $ — | $ — | $ 1,504 | ||
The Lexington Hotel | $ 18,337 | $ 1,319 | $ 3,607 | $ 6 | $ 8 | $ 4,940 | ||
The Lindy Renaissance Charleston Hotel | $ 3,398 | $ 642 | $ 421 | $ — | $ (32) | $ 1,031 | ||
The Lodge at Sonoma Resort | $ 7,549 | $ 2,070 | $ 508 | $ 281 | $ — | $ 2,859 | ||
Westin Boston Seaport District | $ 24,009 | $ 2,413 | $ 2,418 | $ 2,182 | $ (60) | $ 6,953 | ||
Westin Fort Lauderdale Beach Resort | $ 8,131 | $ (949) | $ 1,675 | $ — | $ — | $ 726 | ||
Westin San Diego Bayview | $ 8,654 | $ 1,439 | $ 1,135 | $ 637 | $ — | $ 3,211 | ||
Westin Washington D.C. City Center | $ 7,829 | $ 280 | $ 1,310 | $ 663 | $ — | $ 2,253 | ||
Worthington Renaissance Fort Worth Hotel | $ 8,488 | $ (132) | $ 990 | $ 784 | $ 2 | $ 1,644 | ||
Total | $ 240,279 | $ 35,721 | $ 29,474 | $ 6,854 | $ 1,750 | $ 73,748 | ||
Add: Prior Ownership Results (2) | $ 25,484 | $ 3,456 | $ 2,264 | $ — | $ — | $ 5,720 | ||
Less: Sold Hotels (3) | $ (18,338) | $ (1,317) | $ (3,607) | $ (6) | $ (8) | $ (4,938) | ||
Comparable Total | $ 247,425 | $ 37,860 | $ 28,131 | $ 6,848 | $ 1,742 | $ 74,530 | ||
(1) | Includes non-cash expenses incurred by the hotels due to the straight lining of the rent from ground lease obligations and the non-cash amortization of intangible assets and liabilities. |
(2) | Represents the pre-acquisition operating results of our 2023, 2022 and 2021 acquisitions (excluding the Kimpton Fort Lauderdale Beach Resort). |
(3) | Represents the operating results of Frenchman's Reef and The Lexington Hotel. |
Hotel Adjusted EBITDA Reconciliation - Year to Date 2023 | ||||||||
Total Revenues | Net Income / (Loss) | Plus: Depreciation | Plus: Interest Expense | Plus Adjustments (1) | Equals: Hotel Adjusted EBITDA | |||
Atlanta Marriott Alpharetta | $ 12,584 | $ 3,080 | $ 1,090 | $ — | $ — | $ 4,170 | ||
Bourbon Orleans Hotel | $ 13,449 | $ 2,831 | $ 2,553 | $ — | $ 19 | $ 5,403 | ||
Cavallo Point, The Lodge at the Golden Gate | $ 33,762 | $ 4,447 | $ 4,198 | $ — | $ 281 | $ 8,926 | ||
Chicago Marriott Downtown Magnificent Mile | $ 79,569 | $ 14,293 | $ 10,709 | $ 18 | $ (1,192) | $ 23,828 | ||
Chico Hot Springs Resort | $ 2,595 | $ 357 | $ 195 | $ — | $ — | $ 552 | ||
Courtyard Denver Downtown | $ 9,215 | $ 2,899 | $ 1,126 | $ — | $ — | $ 4,025 | ||
Courtyard New York Manhattan/Fifth Avenue | $ 13,671 | $ 874 | $ 1,097 | $ — | $ 760 | $ 2,731 | ||
Courtyard New York Manhattan/Midtown East | $ 25,890 | $ 3,351 | $ 1,524 | $ 2,672 | $ — | $ 7,547 | ||
Embassy Suites by Hilton Bethesda | $ 10,113 | $ (4,917) | $ 1,713 | $ — | $ 4,409 | $ 1,205 | ||
Havana Cabana Key West | $ 9,856 | $ 2,294 | $ 877 | $ — | $ — | $ 3,171 | ||
Henderson Beach Resort | $ 32,520 | $ 4,492 | $ 3,047 | $ — | $ — | $ 7,539 | ||
Henderson Park Inn | $ 7,044 | $ 2,210 | $ 785 | $ — | $ — | $ 2,995 | ||
Hilton Burlington Lake Champlain | $ 17,899 | $ 4,837 | $ 1,679 | $ — | $ — | $ 6,516 | ||
Hilton Garden Inn New York/Times Square Central | $ 19,308 | $ 3,322 | $ 1,929 | $ — | $ — | $ 5,251 | ||
Hotel Clio | $ 19,814 | $ 118 | $ 2,490 | $ 1,898 | $ 14 | $ 4,520 | ||
Hotel Emblem San Francisco | $ 5,224 | $ (740) | $ 890 | $ — | $ — | $ 150 | ||
Hotel Palomar Phoenix | $ 18,580 | $ 2,724 | $ 1,646 | $ — | $ 538 | $ 4,908 | ||
Kimpton Fort Lauderdale Beach Resort | $ 6,168 | $ (751) | $ 921 | $ — | $ — | $ 170 | ||
Kimpton Shorebreak Resort | $ 16,579 | $ 4,662 | $ 1,177 | $ — | $ — | $ 5,839 | ||
L'Auberge de Sedona | $ 21,566 | $ 4,622 | $ 1,106 | $ — | $ — | $ 5,728 | ||
Lake Austin Spa Resort | $ 15,462 | $ 1,837 | $ 1,916 | $ — | $ — | $ 3,753 | ||
Margaritaville Beach House Key West | $ 23,355 | $ 7,819 | $ 2,366 | $ — | $ — | $ 10,185 | ||
Orchards Inn Sedona | $ 6,225 | $ 1,106 | $ 273 | $ — | $ 126 | $ 1,505 | ||
Salt Lake City Marriott Downtown at City Creek | $ 23,233 | $ 6,549 | $ 1,912 | $ — | $ 32 | $ 8,493 | ||
The Dagny | $ 27,018 | $ 3,674 | $ 4,195 | $ — | $ — | $ 7,869 | ||
The Gwen Hotel | $ 27,126 | $ 3,510 | $ 3,163 | $ — | $ — | $ 6,673 | ||
The Hythe Vail | $ 37,727 | $ 11,374 | $ 3,603 | $ — | $ — | $ 14,977 | ||
The Landing Lake Tahoe Resort & Spa | $ 10,074 | $ 2,520 | $ 666 | $ — | $ — | $ 3,186 | ||
The Lindy Renaissance Charleston Hotel | $ 17,758 | $ 6,584 | $ 1,418 | $ — | $ — | $ 8,002 | ||
The Lodge at Sonoma Resort | $ 23,812 | $ 4,918 | $ 1,933 | $ — | $ — | $ 6,851 | ||
Tranquility Bay Beachfront Resort | $ 18,222 | $ 4,401 | $ 1,315 | $ — | $ — | $ 5,716 | ||
Westin Boston Seaport District | $ 71,511 | $ 5,271 | $ 7,421 | $ 5,969 | $ (367) | $ 18,294 | ||
Westin Fort Lauderdale Beach Resort | $ 50,066 | $ 9,178 | $ 3,096 | $ — | $ — | $ 12,274 | ||
Westin San Diego Bayview | $ 27,124 | $ 6,023 | $ 2,561 | $ — | $ — | $ 8,584 | ||
Westin Washington D.C. City Center | $ 22,481 | $ 1,435 | $ 3,070 | $ — | $ — | $ 4,505 | ||
Worthington Renaissance Fort Worth Hotel | $ 34,720 | $ 4,824 | $ 3,335 | $ 2,145 | $ — | $ 10,304 | ||
Total | $ 811,320 | $ 136,028 | $ 82,995 | $ 12,702 | $ 4,620 | $ 236,338 | ||
Add: Prior Ownership Results (2) | $ 2,767 | $ 2,052 | $ (396) | $ — | $ — | $ 1,656 | ||
Comparable Total | $ 814,087 | $ 138,080 | $ 82,599 | $ 12,702 | $ 4,620 | $ 237,994 | ||
(1) | Includes non-cash expenses incurred by the hotels due to the straight lining of the rent from ground lease obligations and the non-cash amortization of intangible assets and liabilities. |
(2) | Represents the pre-acquisition operating results of our 2023 acquisition and excludes the Kimpton Fort Lauderdale Beach Resort. |
Hotel Adjusted EBITDA Reconciliation - Year to Date 2022 | ||||||||
Net Income /(Loss) | Plus: | Plus: | Plus: | Equals: Hotel | ||||
Total Revenues | Depreciation | Interest Expense | Adjustments (1) | Adjusted EBITDA | ||||
Atlanta Marriott Alpharetta | $ 9,908 | $ 2,010 | $ 1,112 | $ — | $ — | $ 3,122 | ||
Bourbon Orleans Hotel | $ 11,027 | $ 1,429 | $ 2,486 | $ — | $ 19 | $ 3,934 | ||
Cavallo Point, The Lodge at the Golden Gate | $ 33,993 | $ 4,712 | $ 5,535 | $ — | $ 281 | $ 10,528 | ||
Chicago Marriott Downtown Magnificent Mile | $ 67,600 | $ 12,805 | $ 11,686 | $ 17 | $ (1,192) | $ 23,316 | ||
Courtyard Denver Downtown | $ 8,453 | $ 2,917 | $ 1,129 | $ — | $ — | $ 4,046 | ||
Courtyard New York Manhattan/Fifth Avenue | $ 12,144 | $ (141) | $ 994 | $ — | $ 760 | $ 1,613 | ||
Courtyard New York Manhattan/Midtown East | $ 22,049 | $ 1,178 | $ 1,456 | $ 2,730 | $ — | $ 5,364 | ||
Embassy Suites by Hilton Bethesda | $ 6,233 | $ (7,305) | $ 1,681 | $ — | $ 4,449 | $ (1,175) | ||
Havana Cabana Key West | $ 11,119 | $ 4,044 | $ 830 | $ — | $ — | $ 4,874 | ||
Henderson Beach Resort | $ 35,406 | $ 5,599 | $ 2,913 | $ — | $ — | $ 8,512 | ||
Henderson Park Inn | $ 7,187 | $ 2,261 | $ 666 | $ — | $ — | $ 2,927 | ||
Hilton Burlington Lake Champlain | $ 16,350 | $ 4,689 | $ 1,698 | $ — | $ — | $ 6,387 | ||
Hilton Garden Inn New York/Times Square Central | $ 19,138 | $ 3,348 | $ 1,878 | $ — | $ — | $ 5,226 | ||
Hotel Clio | $ 19,594 | $ 709 | $ 2,527 | $ 1,941 | $ 14 | $ 5,191 | ||
Hotel Emblem San Francisco | $ 5,297 | $ (112) | $ 891 | $ — | $ — | $ 779 | ||
Hotel Palomar Phoenix | $ 15,334 | $ 1,978 | $ 1,995 | $ — | $ 548 | $ 4,521 | ||
Kimpton Fort Lauderdale Beach Resort | $ 3,237 | $ (547) | $ 609 | $ — | $ — | $ 62 | ||
Kimpton Shorebreak Resort | $ 17,721 | $ 5,892 | $ 1,201 | $ — | $ — | $ 7,093 | ||
L'Auberge de Sedona | $ 25,120 | $ 7,056 | $ 1,101 | $ — | $ — | $ 8,157 | ||
Margaritaville Beach House Key West | $ 25,524 | $ 9,623 | $ 2,387 | $ — | $ — | $ 12,010 | ||
Orchards Inn Sedona | $ 6,788 | $ 1,724 | $ 254 | $ — | $ 126 | $ 2,104 | ||
Salt Lake City Marriott Downtown at City Creek | $ 20,333 | $ 4,064 | $ 1,657 | $ 1,578 | $ 32 | $ 7,331 | ||
The Dagny | $ 28,099 | $ 6,564 | $ 3,072 | $ — | $ — | $ 9,636 | ||
The Gwen Hotel | $ 27,302 | $ 5,168 | $ 3,207 | $ — | $ — | $ 8,375 | ||
The Hythe Vail | $ 32,526 | $ 7,491 | $ 3,607 | $ — | $ — | $ 11,098 | ||
The Landing Lake Tahoe Resort & Spa | $ 9,947 | $ 3,256 | $ 793 | $ — | $ — | $ 4,049 | ||
The Lindy Renaissance Charleston Hotel | $ 17,672 | $ 6,528 | $ 1,372 | $ — | $ — | $ 7,900 | ||
The Lodge at Sonoma Resort | $ 23,733 | $ 4,335 | $ 1,905 | $ 782 | $ — | $ 7,022 | ||
Tranquility Bay Beachfront Resort | $ 19,650 | $ 5,325 | $ 1,277 | $ — | $ — | $ 6,602 | ||
Westin Boston Seaport District | $ 63,111 | $ 2,872 | $ 7,346 | $ 6,112 | $ (367) | $ 15,963 | ||
Westin Fort Lauderdale Beach Resort | $ 53,957 | $ 16,539 | $ 2,942 | $ — | $ — | $ 19,481 | ||
Westin San Diego Bayview | $ 22,978 | $ 3,507 | $ 2,484 | $ 1,756 | $ — | $ 7,747 | ||
Westin Washington D.C. City Center | $ 17,814 | $ (1,145) | $ 3,078 | $ 1,781 | $ — | $ 3,714 | ||
Worthington Renaissance Fort Worth Hotel | $ 30,104 | $ 3,440 | $ 3,328 | $ 2,196 | $ 5 | $ 8,969 | ||
Total | $ 746,448 | $ 131,813 | $ 81,097 | $ 18,893 | $ 4,675 | $ 236,478 | ||
Add: Prior Ownership Results (2) | $ 27,277 | $ 7,717 | $ 976 | $ — | $ — | $ 8,693 | ||
Comparable Total | $ 773,725 | $ 139,530 | $ 82,073 | $ 18,893 | $ 4,675 | $ 245,171 | ||
(1) | Includes non-cash expenses incurred by the hotels due to the straight lining of the rent from ground lease obligations and the non-cash amortization of intangible assets and liabilities. |
(2) | Represents the pre-acquisition operating results of our 2023 and 2022 acquisitions and excludes the Kimpton Fort Lauderdale Beach Resort. |
Hotel Adjusted EBITDA Reconciliation - Year to Date 2019 | ||||||||
Plus: | Plus: | Plus: | Equals: Hotel | |||||
Total Revenues | Net Income / (Loss) | Depreciation | Interest Expense | Adjustments (1) | Adjusted EBITDA | |||
Atlanta Marriott Alpharetta | $ 14,959 | $ 3,891 | $ 1,389 | $ — | $ — | $ 5,280 | ||
Cavallo Point, The Lodge at the Golden Gate | $ 30,600 | $ 2,374 | $ 5,557 | $ — | $ 221 | $ 8,152 | ||
Chicago Marriott Downtown Magnificent Mile | $ 83,224 | $ 12,127 | $ 12,461 | $ 110 | $ (1,192) | $ 23,506 | ||
Courtyard Denver Downtown | $ 8,881 | $ 3,407 | $ 881 | $ — | $ — | $ 4,288 | ||
Courtyard New York Manhattan/Fifth Avenue | $ 11,417 | $ (519) | $ 1,330 | $ — | $ 760 | $ 1,571 | ||
Courtyard New York Manhattan/Midtown East | $ 21,213 | $ (70) | $ 2,077 | $ 2,891 | $ — | $ 4,898 | ||
Embassy Suites by Hilton Bethesda | $ 13,051 | $ (2,031) | $ 1,422 | $ — | $ 4,555 | $ 3,946 | ||
Frenchman's Reef & Morning Star Marriott Beach Resort | $ — | $ 8,798 | $ — | $ — | $ — | $ 8,798 | ||
Havana Cabana Key West | $ 7,351 | $ 2,035 | $ 740 | $ — | $ — | $ 2,775 | ||
Hilton Burlington Lake Champlain | $ 14,031 | $ 3,917 | $ 1,500 | $ — | $ — | $ 5,417 | ||
Hilton Garden Inn New York/Times Square Central | $ 18,222 | $ 1,731 | $ 2,509 | $ — | $ — | $ 4,240 | ||
Hotel Clio | $ 14,380 | $ (944) | $ 1,975 | $ 2,062 | $ 18 | $ 3,111 | ||
Hotel Emblem San Francisco | $ 5,649 | $ 323 | $ 868 | $ — | $ — | $ 1,191 | ||
Hotel Palomar Phoenix | $ 18,008 | $ 2,319 | $ 1,991 | $ 116 | $ 885 | $ 5,311 | ||
Kimpton Shorebreak Resort | $ 13,704 | $ 3,586 | $ 1,046 | $ — | $ 121 | $ 4,753 | ||
L'Auberge de Sedona | $ 19,259 | $ 3,688 | $ 1,525 | $ — | $ — | $ 5,213 | ||
Margaritaville Beach House Key West | $ 12,906 | $ 3,557 | $ 1,033 | $ — | $ — | $ 4,590 | ||
Orchards Inn Sedona | $ 5,890 | $ 884 | $ 713 | $ — | $ 126 | $ 1,723 | ||
Salt Lake City Marriott Downtown at City Creek | $ 23,586 | $ 5,120 | $ 1,680 | $ 1,818 | $ — | $ 8,618 | ||
The Dagny | $ 32,337 | $ 9,124 | $ 3,708 | $ — | $ — | $ 12,832 | ||
The Gwen Hotel | $ 25,709 | $ 4,030 | $ 3,285 | $ — | $ — | $ 7,315 | ||
The Hythe Vail, a Luxury Collection Resort | $ 27,989 | $ 6,063 | $ 3,035 | $ — | $ — | $ 9,098 | ||
The Landing Lake Tahoe Resort & Spa | $ 7,618 | $ 294 | $ 1,179 | $ — | $ — | $ 1,473 | ||
The Lexington Hotel | $ 47,872 | $ (1,778) | $ 10,697 | $ 17 | $ 24 | $ 8,960 | ||
The Lindy Renaissance Charleston Hotel | $ 11,566 | $ 3,438 | $ 1,242 | $ — | $ (95) | $ 4,585 | ||
The Lodge at Sonoma Resort | $ 19,023 | $ 3,234 | $ 1,571 | $ 840 | $ — | $ 5,645 | ||
Westin Boston Seaport District | $ 70,991 | $ 6,286 | $ 7,266 | $ 6,506 | $ (180) | $ 19,878 | ||
Westin Fort Lauderdale Beach Resort | $ 38,246 | $ 7,223 | $ 4,853 | $ — | $ — | $ 12,076 | ||
Westin San Diego Bayview | $ 26,333 | $ 4,769 | $ 3,397 | $ 1,901 | $ — | $ 10,067 | ||
Westin Washington D.C. City Center | $ 25,238 | $ 2,075 | $ 3,948 | $ 1,986 | $ — | $ 8,009 | ||
Worthington Renaissance Fort Worth Hotel | $ 31,319 | $ 5,597 | $ 2,927 | $ 2,340 | $ 6 | $ 10,870 | ||
Total | $ 700,572 | $ 104,548 | $ 87,805 | $ 20,587 | $ 5,249 | $ 218,028 | ||
Add: Prior Ownership Results (2) | $ 76,162 | $ 10,670 | $ 6,791 | $ — | $ — | $ 17,461 | ||
Less: Sold Hotels (3) | $ (47,872) | $ (7,020) | $ (10,697) | $ (17) | $ (24) | $ (17,758) | ||
Comparable Total | $ 728,862 | $ 108,198 | $ 83,899 | $ 20,570 | $ 5,225 | $ 217,731 | ||
(1) | Includes non-cash expenses incurred by the hotels due to the straight lining of the rent from ground lease obligations and the non-cash amortization of intangible assets and liabilities. |
(2) | Represents the pre-acquisition operating results of our 2023, 2022 and 2021 acquisitions (excluding the Kimpton Fort Lauderdale Beach Resort). |
(3) | Represents the operating results of Frenchman's Reef and The Lexington Hotel. |
SOURCE DiamondRock Hospitality Company

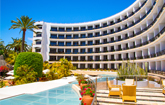



Share this article