General Dynamics Reports Fourth-quarter, Full-year 2011 Performance
- Net cash provided by operating activities totals $2 billion in fourth quarter, $3.2 billion for full year
- Company-wide sales increase over prior periods

FALLS CHURCH, Va., Jan. 25, 2012 /PRNewswire/ -- General Dynamics (NYSE: GD) today reported 2011 fourth-quarter earnings from continuing operations of $603 million, or $1.68 per share on a fully diluted basis, compared to 2010 fourth-quarter earnings from continuing operations of $729 million, or $1.91 per share fully diluted.
Fourth-quarter earnings were impacted by charges taken at the company's Switzerland-based aircraft-completions business totaling $189 million. The charges comprise a $111 million non-cash impairment of an intangible asset related to the business and $78 million in contract losses.
"Jet Aviation's aircraft-completions business continued to face lower OEM business-jet volume and delays in several narrow-body and wide-body aircraft which are nearing delivery," said Jay L. Johnson, chairman and chief executive officer. "We have taken appropriate steps to address these issues.
"The charges taken in our completions business mask an otherwise solid fourth-quarter performance by General Dynamics, marked by excellent cash generation, delivery of the first 12 Gulfstream G650 production aircraft to the final phase of manufacturing, and strong margins in our defense businesses," Johnson continued.
Revenue and Full-year Earnings
Fourth-quarter 2011 revenue was $9.1 billion, and revenue was $32.7 billion for the full year. Full-year 2011 earnings from continuing operations were $2.55 billion, or $6.94 per share on a fully diluted basis, compared to $2.63 billion and $6.82 per share, respectively, for 2010.
Margins
Company-wide operating margins, which include the impact of the charges in Aerospace, were 10.4 percent for the fourth quarter and 11.7 percent for the full year. These margins reflect the continued strong performance in the company's defense groups, each of which increased their operating margins in the quarter and for the year.
Cash
Net cash provided by operating activities totaled $2 billion in the fourth quarter and $3.2 billion for the full year. Free cash flow from operations, defined as net cash provided by operating activities less capital expenditures, was $1.8 billion in the quarter and $2.8 billion for the year. Free cash flow exceeded earnings from continuing operations in the fourth quarter and for the full year, benefitting from progress payments received by the Aerospace group as the new Gulfstream G650 business-jet aircraft received provisional type certification and the first 12 production aircraft were delivered into final-phase manufacturing.
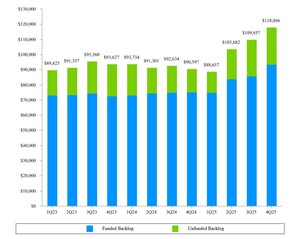
Backlog
The company's total backlog was $57.4 billion at the end of the year. In the fourth quarter, orders were particularly strong for combat vehicle production and improvements, both domestically and internationally. Gulfstream also enjoyed healthy demand across its product portfolio in the quarter, and for the full year recorded the highest number of orders for new aircraft since the introduction of the G650 in 2008.
Estimated potential contract value, representing management's estimate of the value of unfunded indefinite delivery, indefinite quantity (IDIQ) contracts and unexercised contract options, increased to $28 billion at year-end 2011. Total potential contract value, the sum of all backlog components, was $85.4 billion at the end of the year.
General Dynamics, headquartered in Falls Church, Virginia, employs approximately 95,100 people worldwide. The company is a market leader in business aviation; land and expeditionary combat systems, armaments and munitions; shipbuilding and marine systems; and information systems and technologies. More information about the company is available on the Internet at www.generaldynamics.com.
Certain statements made in this press release, including any statements as to future results of operations and financial projections, may constitute "forward-looking statements" within the meaning of the Private Securities Litigation Reform Act of 1995, as amended. Forward-looking statements are based on management's expectations, estimates, projections and assumptions. These statements are not guarantees of future performance and involve certain risks and uncertainties, which are difficult to predict. Therefore, actual future results and trends may differ materially from what is forecast in forward-looking statements due to a variety of factors. Additional information regarding these factors is contained in the company's filings with the Securities and Exchange Commission, including, without limitation, its Annual Report on Form 10-K and its Quarterly Reports on Form 10-Q.
All forward-looking statements speak only as of the date they were made. The company does not undertake any obligation to update or publicly release any revisions to any forward-looking statements to reflect events, circumstances or changes in expectations after the date of this press release.
WEBCAST INFORMATION: General Dynamics will webcast its fourth-quarter securities-analyst conference call at 11:30 a.m. Eastern Standard Time on Wednesday, January 25, 2012. The webcast will be a listen-only audio event, available at www.generaldynamics.com. An on-demand replay of the webcast will be available by 2 p.m. January 25 and will continue for 12 months. To hear a recording of the conference call by telephone, please call 888-286-8010 (international: 617-801-6888); passcode 99298277. The phone replay will be available from 2 p.m. January 25 until midnight February 1, 2012.
EXHIBIT A |
|||||||||
CONSOLIDATED STATEMENT OF EARNINGS (UNAUDITED) |
|||||||||
DOLLARS IN MILLIONS, EXCEPT PER SHARE AMOUNTS |
|||||||||
Fourth Quarter |
Variance |
||||||||
2010 |
2011 |
$ |
% |
||||||
Revenues |
$ 8,601 |
$ 9,147 |
$ 546 |
6.3 % |
|||||
Operating costs and expenses |
7,525 |
8,197 |
(672) |
||||||
Operating earnings |
1,076 |
950 |
(126) |
(11.7)% |
|||||
Interest, net |
(33) |
(38) |
(5) |
||||||
Other, net |
- |
(1) |
(1) |
||||||
Earnings from continuing operations before income taxes |
1,043 |
911 |
(132) |
(12.7)% |
|||||
Provision for income taxes |
314 |
308 |
6 |
||||||
Earnings from continuing operations |
$ 729 |
$ 603 |
$ (126) |
(17.3)% |
|||||
Discontinued operations, net of tax |
- |
- |
- |
||||||
Net earnings |
$ 729 |
$ 603 |
$ (126) |
(17.3)% |
|||||
Earnings per share - basic |
|||||||||
Continuing operations |
$ 1.94 |
$ 1.69 |
$ (0.25) |
(12.9)% |
|||||
Discontinued operations |
$ - |
$ - |
$ - |
||||||
Net earnings |
$ 1.94 |
$ 1.69 |
$ (0.25) |
(12.9)% |
|||||
Basic weighted average shares outstanding (in millions) |
376.7 |
356.2 |
|||||||
Earnings per share - diluted |
|||||||||
Continuing operations |
$ 1.91 |
$ 1.68 |
$ (0.23) |
(12.0)% |
|||||
Discontinued operations |
$ - |
$ - |
$ - |
||||||
Net earnings |
$ 1.91 |
$ 1.68 |
$ (0.23) |
(12.0)% |
|||||
Diluted weighted average shares outstanding (in millions) |
380.9 |
359.4 |
|||||||
EXHIBIT B |
|||||||||
CONSOLIDATED STATEMENT OF EARNINGS (UNAUDITED) |
|||||||||
DOLLARS IN MILLIONS, EXCEPT PER SHARE AMOUNTS |
|||||||||
Twelve Months |
Variance |
||||||||
2010 |
2011 |
$ |
% |
||||||
Revenues |
$ 32,466 |
$ 32,677 |
$ 211 |
0.6 % |
|||||
Operating costs and expenses |
28,521 |
28,851 |
(330) |
||||||
Operating earnings |
3,945 |
3,826 |
(119) |
(3.0)% |
|||||
Interest, net |
(157) |
(141) |
16 |
||||||
Other, net |
2 |
33 |
31 |
||||||
Earnings from continuing operations before income taxes |
3,790 |
3,718 |
(72) |
(1.9)% |
|||||
Provision for income taxes |
1,162 |
1,166 |
(4) |
||||||
Earnings from continuing operations |
$ 2,628 |
$ 2,552 |
$ (76) |
(2.9)% |
|||||
Discontinued operations, net of tax |
(4) |
(26) |
(22) |
||||||
Net earnings |
$ 2,624 |
$ 2,526 |
$ (98) |
(3.7)% |
|||||
Earnings per share - basic |
|||||||||
Continuing operations |
$ 6.89 |
$ 7.01 |
$ 0.12 |
1.7 % |
|||||
Discontinued operations |
$ (0.01) |
$ (0.07) |
$ (0.06) |
||||||
Net earnings |
$ 6.88 |
$ 6.94 |
$ 0.06 |
0.9 % |
|||||
Basic weighted average shares outstanding (in millions) |
381.2 |
364.1 |
|||||||
Earnings per share - diluted |
|||||||||
Continuing operations |
$ 6.82 |
$ 6.94 |
$ 0.12 |
1.8 % |
|||||
Discontinued operations |
$ (0.01) |
$ (0.07) |
$ (0.06) |
||||||
Net earnings |
$ 6.81 |
$ 6.87 |
$ 0.06 |
0.9 % |
|||||
Diluted weighted average shares outstanding (in millions) |
385.2 |
367.5 |
|||||||
EXHIBIT C |
||||||||||
REVENUES AND OPERATING EARNINGS BY SEGMENT (UNAUDITED) |
||||||||||
DOLLARS IN MILLIONS |
||||||||||
Fourth Quarter |
Variance |
|||||||||
2010 |
2011 |
$ |
% |
|||||||
Revenues: |
||||||||||
Aerospace |
$ 1,268 |
$ 1,857 |
$ 589 |
46.5 % |
||||||
Combat Systems |
2,696 |
2,611 |
(85) |
(3.2)% |
||||||
Marine Systems |
1,701 |
1,758 |
57 |
3.4 % |
||||||
Information Systems and Technology |
2,936 |
2,921 |
(15) |
(0.5)% |
||||||
Total |
$ 8,601 |
$ 9,147 |
$ 546 |
6.3 % |
||||||
Operating earnings: |
||||||||||
Aerospace |
$ 210 |
$ 73 |
$ (137) |
(65.2)% |
||||||
Combat Systems |
400 |
388 |
(12) |
(3.0)% |
||||||
Marine Systems |
177 |
190 |
13 |
7.3 % |
||||||
Information Systems and Technology |
311 |
315 |
4 |
1.3 % |
||||||
Corporate |
(22) |
(16) |
6 |
27.3 % |
||||||
Total |
$ 1,076 |
$ 950 |
$ (126) |
(11.7)% |
||||||
Operating margins: |
||||||||||
Aerospace |
16.6 % |
3.9 % |
||||||||
Combat Systems |
14.8 % |
14.9 % |
||||||||
Marine Systems |
10.4 % |
10.8 % |
||||||||
Information Systems and Technology |
10.6 % |
10.8 % |
||||||||
Total |
12.5 % |
10.4 % |
||||||||
EXHIBIT D |
||||||||||
REVENUES AND OPERATING EARNINGS BY SEGMENT (UNAUDITED) |
||||||||||
DOLLARS IN MILLIONS |
||||||||||
Twelve Months |
Variance |
|||||||||
2010 |
2011 |
$ |
% |
|||||||
Revenues: |
||||||||||
Aerospace |
$ 5,299 |
$ 5,998 |
$ 699 |
13.2 % |
||||||
Combat Systems |
8,878 |
8,827 |
(51) |
(0.6)% |
||||||
Marine Systems |
6,677 |
6,631 |
(46) |
(0.7)% |
||||||
Information Systems and Technology |
11,612 |
11,221 |
(391) |
(3.4)% |
||||||
Total |
$ 32,466 |
$ 32,677 |
$ 211 |
0.6 % |
||||||
Operating earnings: |
||||||||||
Aerospace |
$ 860 |
$ 729 |
$ (131) |
(15.2)% |
||||||
Combat Systems |
1,275 |
1,283 |
8 |
0.6 % |
||||||
Marine Systems |
674 |
691 |
17 |
2.5 % |
||||||
Information Systems and Technology |
1,219 |
1,200 |
(19) |
(1.6)% |
||||||
Corporate |
(83) |
(77) |
6 |
7.2 % |
||||||
Total |
$ 3,945 |
$ 3,826 |
$ (119) |
(3.0)% |
||||||
Operating margins: |
||||||||||
Aerospace |
16.2 % |
12.2 % |
||||||||
Combat Systems |
14.4 % |
14.5 % |
||||||||
Marine Systems |
10.1 % |
10.4 % |
||||||||
Information Systems and Technology |
10.5 % |
10.7 % |
||||||||
Total |
12.2 % |
11.7 % |
||||||||
EXHIBIT E |
||||||
PRELIMINARY CONSOLIDATED BALANCE SHEET (UNAUDITED) |
||||||
DOLLARS IN MILLIONS |
||||||
December 31, 2010 |
December 31, 2011 |
|||||
ASSETS |
||||||
Current assets: |
||||||
Cash and equivalents |
$ 2,613 |
$ 2,649 |
||||
Accounts receivable |
3,848 |
4,452 |
||||
Contracts in process |
4,873 |
5,168 |
||||
Inventories |
2,158 |
2,310 |
||||
Other current assets |
694 |
789 |
||||
Total current assets |
14,186 |
15,368 |
||||
Noncurrent assets: |
||||||
Property, plant and equipment, net |
2,971 |
3,284 |
||||
Intangible assets, net |
1,992 |
1,813 |
||||
Goodwill |
12,649 |
13,576 |
||||
Other assets |
747 |
842 |
||||
Total noncurrent assets |
18,359 |
19,515 |
||||
Total assets |
$ 32,545 |
$ 34,883 |
||||
LIABILITIES AND SHAREHOLDERS' EQUITY |
||||||
Current liabilities: |
||||||
Short-term debt and current portion of long-term debt |
$ 773 |
$ 23 |
||||
Accounts payable |
2,736 |
2,895 |
||||
Customer advances and deposits |
4,465 |
5,011 |
||||
Other current liabilities |
3,203 |
3,216 |
||||
Total current liabilities |
11,177 |
11,145 |
||||
Noncurrent liabilities: |
||||||
Long-term debt |
2,430 |
3,907 |
||||
Other liabilities |
5,622 |
6,599 |
||||
Total noncurrent liabilities |
8,052 |
10,506 |
||||
Shareholders' equity: |
||||||
Common stock |
482 |
482 |
||||
Surplus |
1,729 |
1,888 |
||||
Retained earnings |
17,076 |
18,917 |
||||
Treasury stock |
(4,535) |
(5,743) |
||||
Accumulated other comprehensive loss |
(1,436) |
(2,312) |
||||
Total shareholders' equity |
13,316 |
13,232 |
||||
Total liabilities and shareholders' equity |
$ 32,545 |
$ 34,883 |
||||
EXHIBIT F |
||||||
PRELIMINARY CONSOLIDATED STATEMENT OF CASH FLOWS (UNAUDITED) |
||||||
DOLLARS IN MILLIONS |
||||||
Twelve Months Ended |
||||||
Cash flows from operating activities: |
December 31, 2010 |
December 31, 2011 |
||||
Net earnings |
$ 2,624 |
$ 2,526 |
||||
Adjustments to reconcile net earnings to net cash provided by |
||||||
operating activities: |
||||||
Depreciation of property, plant and equipment |
345 |
354 |
||||
Amortization of intangible assets |
224 |
238 |
||||
Intangible asset impairment |
- |
111 |
||||
Stock-based compensation expense |
118 |
128 |
||||
Excess tax benefit from stock-based compensation |
(18) |
(24) |
||||
Deferred income tax provision |
56 |
14 |
||||
Discontinued operations, net of tax |
4 |
26 |
||||
(Increase) decrease in assets, net of effects of business acquisitions: |
||||||
Accounts receivable |
(152) |
(420) |
||||
Contracts in process |
(334) |
(62) |
||||
Inventories |
(23) |
(186) |
||||
Increase (decrease) in liabilities, net of effects of business acquisitions: |
||||||
Accounts payable |
366 |
17 |
||||
Customer advances and deposits |
30 |
629 |
||||
Other current liabilities |
(285) |
86 |
||||
Other, net |
31 |
(199) |
||||
Net cash provided by operating activities |
2,986 |
3,238 |
||||
Cash flows from investing activities: |
||||||
Business acquisitions, net of cash acquired |
(233) |
(1,560) |
||||
Purchases of held-to-maturity securities |
(468) |
(459) |
||||
Maturities of held-to-maturity securities |
605 |
441 |
||||
Capital expenditures |
(370) |
(458) |
||||
Purchases of available-for-sale securities |
(226) |
(373) |
||||
Maturities of available-for-sale securities |
126 |
235 |
||||
Other, net |
158 |
200 |
||||
Net cash used by investing activities |
(408) |
(1,974) |
||||
Cash flows from financing activities: |
||||||
Proceeds from fixed-rate notes |
- |
1,497 |
||||
Purchases of common stock |
(1,185) |
(1,468) |
||||
Repayment of fixed-rate notes |
(700) |
(750) |
||||
Dividends paid |
(631) |
(673) |
||||
Proceeds from option exercises |
277 |
198 |
||||
Other, net |
13 |
(5) |
||||
Net cash used by financing activities |
(2,226) |
(1,201) |
||||
Net cash used by discontinued operations |
(2) |
(27) |
||||
Net increase in cash and equivalents |
350 |
36 |
||||
Cash and equivalents at beginning of period |
2,263 |
2,613 |
||||
Cash and equivalents at end of period |
$ 2,613 |
$ 2,649 |
||||
EXHIBIT G |
||||||||||||
PRELIMINARY FINANCIAL INFORMATION (UNAUDITED) |
||||||||||||
DOLLARS IN MILLIONS EXCEPT PER SHARE AND EMPLOYEE AMOUNTS |
||||||||||||
Fourth Quarter |
Fourth Quarter |
|||||||||||
2010 |
2011 |
|||||||||||
Non-GAAP Financial Measures: |
||||||||||||
Free cash flow from operations: |
Quarter |
Year-to-date |
Quarter |
Year-to-date |
||||||||
Net cash provided by operating activities |
$ 1,419 |
$ 2,986 |
$ 2,026 |
$ 3,238 |
||||||||
Capital expenditures |
(151) |
(370) |
(185) |
(458) |
||||||||
Free cash flow from operations (A) |
$ 1,268 |
$ 2,616 |
$ 1,841 |
$ 2,780 |
||||||||
Return on invested capital: |
||||||||||||
Earnings from continuing operations |
$ 2,628 |
$ 2,552 |
||||||||||
After-tax interest expense |
116 |
106 |
||||||||||
After-tax amortization expense |
155 |
163 |
||||||||||
Net operating profit after taxes |
2,899 |
2,821 |
||||||||||
Average debt and equity |
16,587 |
17,123 |
||||||||||
Return on invested capital (B) |
17.5% |
16.5% |
||||||||||
Other Financial Information: |
||||||||||||
Return on equity (C) |
20.2% |
18.8% |
||||||||||
Debt-to-equity (D) |
24.1% |
29.7% |
||||||||||
Debt-to-capital (E) |
19.4% |
22.9% |
||||||||||
Book value per share (F) |
$ 35.79 |
$ 37.12 |
||||||||||
Total taxes paid |
$ 310 |
$ 279 |
||||||||||
Company-sponsored research and development (G) |
$ 124 |
$ 154 |
||||||||||
Employment |
90,000 |
95,100 |
||||||||||
Sales per employee (H) |
$ 358,100 |
$ 358,600 |
||||||||||
Shares outstanding |
372,052,313 |
356,437,880 |
||||||||||
(A) We believe free cash flow from operations is a measurement that is useful to investors because it portrays our ability to generate cash from our core businesses for such purposes as repaying maturing debt, funding business acquisitions and paying dividends. We use free cash flow from operations to assess the quality of our earnings and as a performance measure in evaluating management. The most directly comparable GAAP measure to free cash flow from operations is net cash provided by operating activities. |
||||||||||||
(B) We believe return on invested capital (ROIC) is a measurement that is useful to investors because it reflects our ability to generate returns from the capital we have deployed in our operations. We use ROIC to evaluate investment decisions and as a performance measure in evaluating management. We define ROIC as net operating profit after taxes for the latest 12-month period divided by the sum of the average debt and shareholders' equity for the same period. Net operating profit after taxes is defined as earnings from continuing operations plus after-tax interest and amortization expense. The most directly comparable GAAP measure to net operating profit after taxes is earnings from continuing operations. |
||||||||||||
(C) Return on equity is calculated by dividing earnings from continuing operations for the latest 12-month period by our average equity during that period. |
||||||||||||
(D) Debt-to-equity ratio is calculated as total debt divided by total equity as of the end of the period. |
||||||||||||
(E) Debt-to-capital ratio is calculated as total debt divided by the sum of total debt plus total equity as of the end of the period. |
||||||||||||
(F) Book value per share is calculated as total equity divided by total outstanding shares as of the end of the period. |
||||||||||||
(G) Includes independent research and development and bid and proposal costs and Gulfstream product-development costs. |
||||||||||||
(H) Sales per employee is calculated by dividing revenues for the latest 12-month period by our average number of employees during that period. |
||||||||||||
EXHIBIT H |
||||||||||||
BACKLOG (UNAUDITED) |
||||||||||||
DOLLARS IN MILLIONS |
||||||||||||
Estimated |
||||||||||||
Total |
Potential |
Total Potential |
||||||||||
Fourth Quarter 2011 |
Funded |
Unfunded |
Backlog |
Contract Value* |
Contract Value |
|||||||
Aerospace |
$ 17,618 |
$ 289 |
$ 17,907 |
$ - |
$ 17,907 |
|||||||
Combat Systems |
10,283 |
1,137 |
11,420 |
3,453 |
14,873 |
|||||||
Marine Systems |
9,364 |
9,140 |
18,504 |
2,163 |
20,667 |
|||||||
Information Systems and Technology |
7,434 |
2,145 |
9,579 |
22,384 |
31,963 |
|||||||
Total |
$ 44,699 |
$ 12,711 |
$ 57,410 |
$ 28,000 |
$ 85,410 |
|||||||
Third Quarter 2011 |
||||||||||||
Aerospace |
$ 18,306 |
$ 318 |
$ 18,624 |
$ - |
$ 18,624 |
|||||||
Combat Systems |
9,078 |
1,304 |
10,382 |
3,763 |
14,145 |
|||||||
Marine Systems |
10,269 |
8,611 |
18,880 |
2,044 |
20,924 |
|||||||
Information Systems and Technology |
8,248 |
2,389 |
10,637 |
21,429 |
32,066 |
|||||||
Total |
$ 45,901 |
$ 12,622 |
$ 58,523 |
$ 27,236 |
$ 85,759 |
|||||||
Fourth Quarter 2010 |
||||||||||||
Aerospace |
$ 17,443 |
$ 378 |
$ 17,821 |
$ 1,361 |
$ 19,182 |
|||||||
Combat Systems |
10,908 |
892 |
11,800 |
4,645 |
16,445 |
|||||||
Marine Systems |
7,050 |
13,069 |
20,119 |
584 |
20,703 |
|||||||
Information Systems and Technology |
7,978 |
1,843 |
9,821 |
15,196 |
25,017 |
|||||||
Total |
$ 43,379 |
$ 16,182 |
$ 59,561 |
$ 21,786 |
$ 81,347 |
|||||||
* The estimated potential contract value represents management's estimate of our future contract value under unfunded indefinite delivery, indefinite quantity (IDIQ) contracts and unexercised options associated with existing firm contracts, including options to purchase new aircraft and long-term agreements with fleet customers. Because the value in the unfunded IDIQ arrangements is subject to the customer's future exercise of an indeterminate quantity of delivery orders, we recognize these contracts in backlog only when they are funded. Unexercised options are recognized in backlog when the customer exercises the option and establishes a firm order. |
||||||||||||
EXHIBIT I |
|
FOURTH QUARTER 2011 SIGNIFICANT ORDERS (UNAUDITED) |
|
DOLLARS IN MILLIONS |
|
We received the following significant defense contract orders during the fourth quarter of 2011:
Combat Systems
- $950 from the Canadian government to modernize 550 LAV III combat vehicles.
- $800 from the U.S. Army under the Stryker program for the production of 277 Stryker vehicles and contractor logistics support.
- $315 from the Army for the production of 125 M1A1 Abrams tank kits for the Egyptian co-production program.
- $125 from the Army to produce 73 Light Armored Vehicles (LAVs) for an international military customer.
- $100 from the U.S. Marine Corps under the mine-resistant, ambush-protected (MRAP) vehicle program for RG-31 upgrade kits.
- $75 from the Swiss Army for the production of 70 Duro Armoured Personnel Carriers.
Marine Systems
- $280 from the U.S. Navy for the conversion of nuclear submarines to moored training ship platforms and associated support yard services.
- $60 from the Navy to operate and maintain large, medium-speed, roll-on/roll-off (LMSR) vessels.
- $35 from the Navy for the fitting-out of the San Antonio-class amphibious assault dock ship (LPD) USS San Diego. The award also includes an option for work on two additional ships.
Information Systems and Technology
- $95 from the Navy for production and support of U.S. and U.K. Trident II submarine weapons systems. The contract has a maximum value of $225 if all options are exercised.
- $60 from the Army for information technology support and modernization at the Alexandria, Virginia, Mark Center.
- $60 from the Army to provide information technology and help desk support to the Army's intelligence and security branch.
- $40 from the U.S. Air Force for networking and computing products and support under the Network-Centric Solutions (NETCENTS) program.
EXHIBIT J |
|||||||||
AEROSPACE SUPPLEMENTAL DATA (UNAUDITED) |
|||||||||
Fourth Quarter |
Twelve Months |
||||||||
2010 |
2011 |
2010 |
2011 |
||||||
Gulfstream Green Deliveries (units): |
|||||||||
Large aircraft |
18 |
30 |
75 |
90 |
|||||
Mid-size aircraft |
2 |
5 |
24 |
17 |
|||||
Total |
20 |
35 |
99 |
107 |
|||||
Gulfstream Outfitted Deliveries (units): |
|||||||||
Large aircraft |
20 |
20 |
74 |
78 |
|||||
Mid-size aircraft |
4 |
7 |
15 |
21 |
|||||
Total |
24 |
27 |
89 |
99 |
|||||
Pre-owned Deliveries (units): |
1 |
1 |
7 |
5 |
|||||
SOURCE General Dynamics


Share this article