General Dynamics Reports Solid Performance in Second Quarter 2010
- Earnings from continuing operations increase by 4.8 percent to $651 million
- Management raises guidance for full-year EPS

FALLS CHURCH, Va., July 28 /PRNewswire-FirstCall/ -- General Dynamics (NYSE: GD) today reported second-quarter 2010 earnings from continuing operations of $651 million, or $1.68 per share on a fully diluted basis, compared to 2009 second-quarter earnings from continuing operations of $621 million, or $1.61 per share fully diluted. Revenues in the quarter were $8.1 billion. Operating earnings grew by 4.2 percent over second-quarter 2009, to $985 million.
Net earnings for the second quarter of 2010 were $648 million, compared to $618 million in the year-ago period. Net earnings on a per-share, fully diluted basis were $1.67 in the current quarter, an increase of 4.4 percent over the year-ago period.
Margins
Company-wide operating margins in the quarter were 12.2 percent, an increase of 50 basis points over second-quarter 2009. Aerospace and Combat Systems margins drove that improvement, increasing 160 and 150 basis points respectively. In comparison to first-quarter 2010, company-wide operating margins increased 40 basis points overall on improvements in Aerospace, Combat Systems and Marine Systems performance. Information Systems and Technology margins remained steady at 10.5 percent.
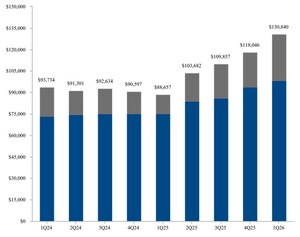
Backlog
The company's funded backlog at the end of the quarter was $45.9 billion and total backlog was $62.5 billion. Orders received in the quarter underscored the continuing global demand for the company's products and services, including Gulfstream business jets; Stryker, LAV III and Scout SV armored vehicles; Hydra-70 rockets, motors and warheads; engineering, support and lead-yard services for several shipbuilding programs; and information technology, communications and computing products and services.
In addition to the backlog, the company's estimated potential contract value -- management's estimate of the value of unfunded indefinite delivery, indefinite quantity (IDIQ) contracts and unexercised options -- grew to $21.7 billion at the end of second-quarter 2010, a 28 percent increase over the prior quarter.
Cash
Net cash provided by operating activities in the second quarter totaled $477 million. Free cash flow from operations, defined as net cash provided by operating activities less capital expenditures, was $414 million for the period.
"General Dynamics' focus on operational excellence is reflected in the operating margins of each of our business groups," said Jay L. Johnson, chairman and chief executive officer. "We continue to increase efficiency, improve productivity and drive cost out of our processes in order to deliver the highest-quality, most-affordable products and services to our customers.
"Based on our performance this quarter and a clearer view of what the second half of the year may hold, we now expect full-year 2010 earnings from continuing operations to be $6.60 to $6.65 per share, fully diluted," Johnson said.
General Dynamics, headquartered in Falls Church, Virginia, employs approximately 91,000 people worldwide. The company is a market leader in business aviation; land and expeditionary combat systems, armaments and munitions; shipbuilding and marine systems; and information systems and technologies. More information about the company is available on the Internet at www.generaldynamics.com.
Certain statements made in this press release, including any statements as to future results of operations and financial projections, may constitute "forward-looking statements" within the meaning of the Private Securities Litigation Reform Act of 1995, as amended. Forward-looking statements are based on management's expectations, estimates, projections and assumptions. These statements are not guarantees of future performance and involve certain risks and uncertainties which are difficult to predict. Actual future results and trends may differ materially from what is forecast in forward-looking statements due to a variety of factors. Additional information regarding these factors is contained in the company's filings with the Securities and Exchange Commission, including, without limitation, its Annual Report on Form 10-K and its Quarterly Reports on Form 10-Q.
All forward-looking statements speak only as of the date they are made. The company does not undertake any obligation to update or publicly release any revisions to any forward-looking statements to reflect events, circumstances or changes in expectations after the date of this press release.
WEBCAST INFORMATION: General Dynamics will webcast its second-quarter securities-analyst conference call at 11:30 a.m. Eastern Time on Wednesday, July 28, 2010. The webcast will be a listen-only audio event, available at www.generaldynamics.com. An on-demand replay of the webcast will be available by 1:30 p.m. July 28 and will continue for 12 months. To hear a recording of the conference call by telephone, please call 888-286-8010 (international: 617-801-6888); passcode 72339413. The phone replay will be available from 1:30 p.m. July 28 until midnight August 4, 2010.
EXHIBIT A |
|||||||||
CONSOLIDATED STATEMENT OF EARNINGS (UNAUDITED) |
|||||||||
DOLLARS IN MILLIONS, EXCEPT PER SHARE AMOUNTS |
|||||||||
Second Quarter |
Variance |
||||||||
2010 |
2009 |
$ |
% |
||||||
Revenues |
$ 8,104 |
$ 8,100 |
$ 4 |
0.0 % |
|||||
Operating costs and expenses |
7,119 |
7,155 |
36 |
||||||
Operating earnings |
985 |
945 |
40 |
4.2 % |
|||||
Interest, net |
(42) |
(38) |
(4) |
||||||
Other, net |
2 |
- |
2 |
||||||
Earnings from continuing operations |
|||||||||
before income taxes |
945 |
907 |
38 |
4.2 % |
|||||
Provision for income taxes |
294 |
286 |
(8) |
||||||
Earnings from continuing operations |
$ 651 |
$ 621 |
$ 30 |
4.8 % |
|||||
Discontinued operations, net of tax |
(3) |
(3) |
- |
||||||
Net earnings |
$ 648 |
$ 618 |
$ 30 |
4.9 % |
|||||
Earnings per share - basic |
|||||||||
Continuing operations |
$ 1.70 |
$ 1.61 |
$ 0.09 |
5.6 % |
|||||
Discontinued operations |
$ (0.01) |
$ (0.01) |
$ - |
||||||
Net earnings |
$ 1.69 |
$ 1.60 |
$ 0.09 |
5.6 % |
|||||
Basic weighted average |
|||||||||
shares outstanding (in millions) |
384.3 |
385.0 |
|||||||
Earnings per share - diluted |
|||||||||
Continuing operations |
$ 1.68 |
$ 1.61 |
$ 0.07 |
4.3 % |
|||||
Discontinued operations |
$ (0.01) |
$ (0.01) |
$ - |
||||||
Net earnings |
$ 1.67 |
$ 1.60 |
$ 0.07 |
4.4 % |
|||||
Diluted weighted average |
|||||||||
shares outstanding (in millions) |
388.5 |
387.0 |
|||||||
EXHIBIT B |
|||||||||
CONSOLIDATED STATEMENT OF EARNINGS (UNAUDITED) |
|||||||||
DOLLARS IN MILLIONS, EXCEPT PER SHARE AMOUNTS |
|||||||||
Six Months |
Variance |
||||||||
2010 |
2009 |
$ |
% |
||||||
Revenues |
$ 15,854 |
$ 16,364 |
$ (510) |
(3.1)% |
|||||
Operating costs and expenses |
13,951 |
14,514 |
563 |
||||||
Operating earnings |
1,903 |
1,850 |
53 |
2.9 % |
|||||
Interest, net |
(86) |
(77) |
(9) |
||||||
Other, net |
2 |
3 |
(1) |
||||||
Earnings from continuing operations |
|||||||||
before income taxes |
1,819 |
1,776 |
43 |
2.4 % |
|||||
Provision for income taxes |
569 |
562 |
(7) |
||||||
Earnings from continuing operations |
$ 1,250 |
$ 1,214 |
$ 36 |
3.0 % |
|||||
Discontinued operations, net of tax |
(5) |
(6) |
1 |
||||||
Net earnings |
$ 1,245 |
$ 1,208 |
$ 37 |
3.1 % |
|||||
Earnings per share - basic |
|||||||||
Continuing operations |
$ 3.25 |
$ 3.15 |
$ 0.10 |
3.2 % |
|||||
Discontinued operations |
$ (0.01) |
$ (0.02) |
$ 0.01 |
||||||
Net earnings |
$ 3.24 |
$ 3.13 |
$ 0.11 |
3.5 % |
|||||
Basic weighted average |
|||||||||
shares outstanding (in millions) |
384.6 |
385.4 |
|||||||
Earnings per share - diluted |
|||||||||
Continuing operations |
$ 3.21 |
$ 3.14 |
$ 0.07 |
2.2 % |
|||||
Discontinued operations |
$ (0.01) |
$ (0.02) |
$ 0.01 |
||||||
Net earnings |
$ 3.20 |
$ 3.12 |
$ 0.08 |
2.6 % |
|||||
Diluted weighted average |
|||||||||
shares outstanding (in millions) |
388.8 |
386.8 |
|||||||
EXHIBIT C |
|||||||||
REVENUES AND OPERATING EARNINGS BY SEGMENT (UNAUDITED) |
|||||||||
DOLLARS IN MILLIONS |
|||||||||
Second Quarter |
Variance |
||||||||
2010 |
2009 |
$ |
% |
||||||
Revenues: |
|||||||||
Aerospace |
$ 1,383 |
$ 1,415 |
$ (32) |
(2.3)% |
|||||
Combat Systems |
2,111 |
2,405 |
(294) |
(12.2)% |
|||||
Marine Systems |
1,637 |
1,625 |
12 |
0.7 % |
|||||
Information Systems and |
|||||||||
Technology |
2,973 |
2,655 |
318 |
12.0 % |
|||||
Total |
$ 8,104 |
$ 8,100 |
$ 4 |
0.0 % |
|||||
Operating earnings: |
|||||||||
Aerospace |
$ 233 |
$ 215 |
$ 18 |
8.4 % |
|||||
Combat Systems |
295 |
300 |
(5) |
(1.7)% |
|||||
Marine Systems |
167 |
168 |
(1) |
(0.6)% |
|||||
Information Systems and |
|||||||||
Technology |
312 |
284 |
28 |
9.9 % |
|||||
Corporate |
(22) |
(22) |
- |
0.0 % |
|||||
Total |
$ 985 |
$ 945 |
$ 40 |
4.2 % |
|||||
Operating margins: |
|||||||||
Aerospace |
16.8 % |
15.2 % |
|||||||
Combat Systems |
14.0 % |
12.5 % |
|||||||
Marine Systems |
10.2 % |
10.3 % |
|||||||
Information Systems and |
|||||||||
Technology |
10.5 % |
10.7 % |
|||||||
Total |
12.2 % |
11.7 % |
|||||||
EXHIBIT D |
|||||||||
REVENUES AND OPERATING EARNINGS BY SEGMENT (UNAUDITED) |
|||||||||
DOLLARS IN MILLIONS |
|||||||||
Six Months |
Variance |
||||||||
2010 |
2009 |
$ |
% |
||||||
Revenues: |
|||||||||
Aerospace |
$ 2,740 |
$ 2,870 |
$ (130) |
(4.5)% |
|||||
Combat Systems |
4,113 |
4,812 |
(699) |
(14.5)% |
|||||
Marine Systems |
3,276 |
3,294 |
(18) |
(0.5)% |
|||||
Information Systems and |
|||||||||
Technology |
5,725 |
5,388 |
337 |
6.3 % |
|||||
Total |
$ 15,854 |
$ 16,364 |
$ (510) |
(3.1)% |
|||||
Operating earnings: |
|||||||||
Aerospace |
$ 451 |
$ 415 |
$ 36 |
8.7 % |
|||||
Combat Systems |
564 |
579 |
(15) |
(2.6)% |
|||||
Marine Systems |
328 |
331 |
(3) |
(0.9)% |
|||||
Information Systems and |
|||||||||
Technology |
602 |
573 |
29 |
5.1 % |
|||||
Corporate |
(42) |
(48) |
6 |
12.5 % |
|||||
Total |
$ 1,903 |
$ 1,850 |
$ 53 |
2.9 % |
|||||
Operating margins: |
|||||||||
Aerospace |
16.5 % |
14.5 % |
|||||||
Combat Systems |
13.7 % |
12.0 % |
|||||||
Marine Systems |
10.0 % |
10.0 % |
|||||||
Information Systems and |
|||||||||
Technology |
10.5 % |
10.6 % |
|||||||
Total |
12.0 % |
11.3 % |
|||||||
EXHIBIT E |
|||||
PRELIMINARY CONSOLIDATED BALANCE SHEET (UNAUDITED) |
|||||
DOLLARS IN MILLIONS |
|||||
July 4, 2010 |
December 31, 2009 |
||||
ASSETS |
|||||
Current assets: |
|||||
Cash and equivalents |
$ 1,853 |
$ 2,263 |
|||
Accounts receivable |
3,545 |
3,678 |
|||
Contracts in process |
4,893 |
4,449 |
|||
Inventories |
1,967 |
2,126 |
|||
Other current assets |
908 |
733 |
|||
Total current assets |
13,166 |
13,249 |
|||
Noncurrent assets: |
|||||
Property, plant and equipment, net |
2,850 |
2,912 |
|||
Intangible assets, net |
2,018 |
2,098 |
|||
Goodwill |
12,316 |
12,269 |
|||
Other assets |
522 |
549 |
|||
Total noncurrent assets |
17,706 |
17,828 |
|||
Total assets |
$ 30,872 |
$ 31,077 |
|||
LIABILITIES AND SHAREHOLDERS' EQUITY |
|||||
Current liabilities: |
|||||
Short-term debt and current portion of long-term debt |
$ 703 |
$ 705 |
|||
Accounts payable |
2,396 |
2,365 |
|||
Customer advances and deposits |
3,740 |
4,313 |
|||
Other current liabilities |
2,956 |
2,988 |
|||
Total current liabilities |
9,795 |
10,371 |
|||
Noncurrent liabilities: |
|||||
Long-term debt |
3,159 |
3,159 |
|||
Other liabilities |
5,079 |
5,124 |
|||
Commitments and contingencies |
|||||
Total noncurrent liabilities |
8,238 |
8,283 |
|||
Shareholders' equity: |
|||||
Common stock |
482 |
482 |
|||
Surplus |
1,631 |
1,518 |
|||
Retained earnings |
16,014 |
15,093 |
|||
Treasury stock |
(3,917) |
(3,463) |
|||
Accumulated other comprehensive loss |
(1,371) |
(1,207) |
|||
Total shareholders' equity |
12,839 |
12,423 |
|||
Total liabilities and shareholders' equity |
$ 30,872 |
$ 31,077 |
|||
EXHIBIT F |
|||||
PRELIMINARY CONSOLIDATED STATEMENT OF CASH FLOWS (UNAUDITED) |
|||||
DOLLARS IN MILLIONS |
|||||
Six Months Ended |
|||||
Cash flows from operating activities: |
July 4, 2010 |
July 5, 2009 |
|||
Net earnings |
$ 1,245 |
$ 1,208 |
|||
Adjustments to reconcile net earnings to net cash provided by |
|||||
operating activities: |
|||||
Depreciation of property, plant and equipment |
171 |
171 |
|||
Amortization of intangible assets |
112 |
108 |
|||
Stock-based compensation expense |
58 |
58 |
|||
Excess tax benefit from stock-based compensation |
(19) |
(1) |
|||
Deferred income tax provision |
30 |
86 |
|||
Discontinued operations, net of tax |
5 |
6 |
|||
(Increase) decrease in assets, net of effects of business acquisitions: |
|||||
Accounts receivable |
151 |
(149) |
|||
Contracts in process |
(414) |
(77) |
|||
Inventories |
161 |
(115) |
|||
Increase (decrease) in liabilities, net of effects of business acquisitions: |
|||||
Accounts payable |
26 |
(18) |
|||
Customer advances and deposits |
(633) |
(430) |
|||
Other current liabilities |
(207) |
(163) |
|||
Other, net |
1 |
79 |
|||
Net cash provided by operating activities |
687 |
763 |
|||
Cash flows from investing activities: |
|||||
Purchases of held-to-maturity securities |
(304) |
- |
|||
Maturities of held-to-maturity securities |
264 |
- |
|||
Business acquisitions, net of cash acquired |
(237) |
(165) |
|||
Purchases of available-for-sale securities |
(170) |
(107) |
|||
Capital expenditures |
(123) |
(170) |
|||
Other, net |
124 |
155 |
|||
Net cash used by investing activities |
(446) |
(287) |
|||
Cash flows from financing activities: |
|||||
Purchases of common stock |
(511) |
(109) |
|||
Dividends paid |
(310) |
(283) |
|||
Proceeds from option exercises |
157 |
30 |
|||
Repayments of commercial paper |
- |
(853) |
|||
Proceeds from fixed-rate notes |
- |
747 |
|||
Other, net |
16 |
(6) |
|||
Net cash used by financing activities |
(648) |
(474) |
|||
Net cash used by discontinued operations - operating activities |
(3) |
(9) |
|||
Net decrease in cash and equivalents |
(410) |
(7) |
|||
Cash and equivalents at beginning of period |
2,263 |
1,621 |
|||
Cash and equivalents at end of period |
$ 1,853 |
$ 1,614 |
|||
EXHIBIT G |
|||||||||
PRELIMINARY FINANCIAL INFORMATION (UNAUDITED) |
|||||||||
DOLLARS IN MILLIONS EXCEPT PER SHARE AND EMPLOYEE AMOUNTS |
|||||||||
Second Quarter |
Second Quarter |
||||||||
2010 |
2009 |
||||||||
Non-GAAP Financial Measures: |
|||||||||
Free cash flow from operations: |
Quarter |
Year-to-date |
Quarter |
Year-to-date |
|||||
Net cash provided by operating activities |
$ 477 |
$ 687 |
$ 609 |
$ 763 |
|||||
Capital expenditures |
(63) |
(123) |
(89) |
(170) |
|||||
Free cash flow from operations (A) |
$ 414 |
$ 564 |
$ 520 |
$ 593 |
|||||
Return on invested capital: |
|||||||||
Earnings from continuing operations |
$ 2,443 |
$ 2,478 |
|||||||
After-tax interest expense |
122 |
100 |
|||||||
After-tax amortization expense |
153 |
128 |
|||||||
Net operating profit after taxes |
2,718 |
2,706 |
|||||||
Average debt and equity |
16,026 |
14,378 |
|||||||
Return on invested capital (B) |
17.0% |
18.8% |
|||||||
Other Financial Information: |
|||||||||
Return on equity (C) |
20.1% |
22.3% |
|||||||
Debt-to-equity (D) |
30.1% |
35.6% |
|||||||
Debt-to-capital (E) |
23.1% |
26.2% |
|||||||
Book value per share (F) |
$ 33.75 |
$ 28.57 |
|||||||
Total taxes paid |
$ 488 |
$ 429 |
|||||||
Company-sponsored research |
|||||||||
and development (G) |
$ 122 |
$ 119 |
|||||||
Employment |
90,700 |
92,000 |
|||||||
Sales per employee (H) |
$ 343,400 |
$ 349,300 |
|||||||
Shares outstanding |
380,374,362 |
385,090,596 |
|||||||
(A) We believe free cash flow from operations is a measurement that is useful to investors, because it portrays our ability to generate |
|||||||||
(B) We believe return on invested capital is a measurement that is useful to investors, because it reflects our ability to generate returns from |
|||||||||
(C) Return on equity is calculated by dividing earnings from continuing operations for the latest 12-month period by our average equity |
|||||||||
(D) Debt-to-equity ratio is calculated as total debt divided by total equity as of the end of the period. |
|||||||||
(E) Debt-to-capital ratio is calculated as total debt divided by the sum of total debt plus total equity as of the end of the period. |
|||||||||
(F) Book value per share is calculated as total equity divided by total outstanding shares as of the end of the period. |
|||||||||
(G) Includes independent research and development and bid and proposal costs and Gulfstream product development costs. |
|||||||||
(H) Sales per employee is calculated by dividing revenues for the latest 12-month period by our average number of employees during that |
|||||||||
EXHIBIT H |
||||||||||||
BACKLOG (UNAUDITED) |
||||||||||||
DOLLARS IN MILLIONS |
||||||||||||
Estimated |
||||||||||||
Total |
Potential |
Total Potential |
||||||||||
Second Quarter 2010 |
Funded |
Unfunded |
Backlog |
Contract Value* |
Contract Value |
|||||||
Aerospace |
$ 17,393 |
$ 408 |
$ 17,801 |
$ 1,361 |
$ 19,162 |
|||||||
Combat Systems |
11,070 |
1,695 |
12,765 |
4,744 |
17,509 |
|||||||
Marine Systems |
8,757 |
12,541 |
21,298 |
768 |
22,066 |
|||||||
Information Systems and |
||||||||||||
Technology |
8,658 |
1,996 |
10,654 |
14,848 |
25,502 |
|||||||
Total |
$ 45,878 |
$ 16,640 |
$ 62,518 |
$ 21,721 |
$ 84,239 |
|||||||
First Quarter 2010 |
||||||||||||
Aerospace |
$ 18,123 |
$ 425 |
$ 18,548 |
$ 1,361 |
$ 19,909 |
|||||||
Combat Systems |
11,201 |
1,694 |
12,895 |
2,079 |
14,974 |
|||||||
Marine Systems |
9,634 |
12,457 |
22,091 |
340 |
22,431 |
|||||||
Information Systems and |
||||||||||||
Technology |
8,452 |
1,880 |
10,332 |
13,207 |
23,539 |
|||||||
Total |
$ 47,410 |
$ 16,456 |
$ 63,866 |
$ 16,987 |
$ 80,853 |
|||||||
Second Quarter 2009 |
||||||||||||
Aerospace |
$ 19,306 |
$ 570 |
$ 19,876 |
$ 1,633 |
$ 21,509 |
|||||||
Combat Systems |
11,494 |
1,364 |
12,858 |
2,451 |
15,309 |
|||||||
Marine Systems |
8,645 |
15,724 |
24,369 |
1,241 |
25,610 |
|||||||
Information Systems and |
||||||||||||
Technology |
8,208 |
2,297 |
10,505 |
12,372 |
22,877 |
|||||||
Total |
$ 47,653 |
$ 19,955 |
$ 67,608 |
$ 17,697 |
$ 85,305 |
|||||||
* The estimated potential contract value represents management's estimate of our future contract value under unfunded indefinite delivery, |
||||||||||||
EXHIBIT I |
|
SECOND QUARTER 2010 SIGNIFICANT ORDERS (UNAUDITED) |
|
DOLLARS IN MILLIONS |
|
We received the following significant contract orders during the second quarter of 2010:
Combat Systems
- Approximately $380 from the U.S. Army under the Stryker wheeled armored vehicle program for "double-V" hull design and engineering, and contractor logistics and vehicle support.
- Approximately $280 from the Army for the production of Hydra-70 rockets, motors and warheads. This award has a maximum potential value of nearly $1 billion if all options are exercised.
- Approximately $90 from the Army to provide Stabilized Commander's Weapon Stations (SCWS) for Abrams main battle tanks under the Tank Urban Survivability Kit (TUSK) program. This award brings the total contract value to over $450.
- Approximately $85 from the U.S. Marine Corps under the mine-resistant, ambush-protected (MRAP) vehicle program for RG-31 vehicle field support and engineering upgrades.
- Approximately $50 from Germany to produce Eagle IV armored vehicles. This contract has a maximum potential value of over $500 if all options are exercised.
- Approximately $35 from the Canadian government for design work on the LAV III upgrade program. Combat Systems was selected as the prime contractor and systems integrator for the program in 2009.
Marine Systems
- Approximately $170 from the U.S. Navy for lead-yard services for Virginia-class submarines. The award has a maximum potential value of approximately $880 if all options are exercised.
- Over $100 from the Navy for engineering and support services for the DDG-1000 program, long-lead construction for the second DDG-1000 and long-lead material for the third ship.
Information Systems and Technology
- Approximately $775 from the U.K. Ministry of Defence for the demonstration phase of the Scout Specialist Vehicle program. The contract includes options for future vehicle production, which will be added to the backlog upon successful testing of seven prototype vehicles. Work under this contract will be shared with the Combat Systems group, including a significant portion of the future production effort.
- Approximately $220 of orders for ruggedized computing equipment under the Common Hardware/Software III (CHS-3) program, bringing the total contract value to nearly $2.3 billion.
- Approximately $100 in orders for networking communications products under the Network-Centric Solutions (NETCENTS) program, bringing the total contract value to over $1.1 billion.
- An indefinite delivery, indefinite quantity (IDIQ) contract from the National Aeronautics and Space Administration (NASA) for the Space Network Ground Segment Sustainment (SGSS) project. The contract has a maximum potential value of approximately $640 over seven years.
- One of several awards from the National Geospatial-Intelligence Agency to develop satellite-based intelligence-gathering technology for the Total Application Services for Enterprise Requirements (TASER) IDIQ program. The program has a maximum potential value of $1 billion among all awardees over five years.
- One of several IDIQ contracts under the Defense Intelligence Agency's (DIA) Solutions for the Information Technology Enterprise (SITE) contract. The program has a maximum potential value of $6.6 billion among all awardees over five years.
- One of three awards under the Federal Aviation Administration's (FAA) System Engineering 2020 Research and Development/Mission Analysis Support program. Our award under this program has a maximum potential value of $1.2 billion over 10 years.
- One of three awards under the Navy's Common Afloat Local Area Network Infrastructure (CALI) IDIQ program to provide ships and submarines with secure hardware, software and networking equipment. The program has a maximum potential value of approximately $500 among all awardees.
EXHIBIT J |
|||||||||
AEROSPACE SUPPLEMENTAL DATA (UNAUDITED) |
|||||||||
Second Quarter |
Six Months |
||||||||
2010 |
2009 |
2010 |
2009 |
||||||
Gulfstream Green Deliveries (units): |
|||||||||
Large aircraft |
20 |
20 |
40 |
42 |
|||||
Mid-size aircraft |
8 |
6 |
16 |
15 |
|||||
Total |
28 |
26 |
56 |
57 |
|||||
Gulfstream Outfitted Deliveries (units): |
|||||||||
Large aircraft |
19 |
22 |
35 |
40 |
|||||
Mid-size aircraft |
5 |
9 |
6 |
25 |
|||||
Total |
24 |
31 |
41 |
65 |
|||||
Pre-owned Deliveries (units): |
1 |
2 |
4 |
2 |
|||||
SOURCE General Dynamics


Share this article