Realty Income Announces Operating Results For The Three And Nine Months Ended September 30, 2021
SAN DIEGO, Nov. 1, 2021 /PRNewswire/ -- Realty Income Corporation (Realty Income, NYSE: O), The Monthly Dividend Company®, today announced operating results for the three and nine months ended September 30, 2021. All per share amounts presented in this press release are on a diluted per common share basis unless stated otherwise.
COMPANY HIGHLIGHTS:
For the three months ended September 30, 2021:
- Net income per share increased to $0.34, compared to $0.07 for the three months ended September 30, 2020
- Normalized FFO per share increased 8.5% to $0.89, compared to the three months ended September 30, 2020
- AFFO per share increased 12.3% to $0.91, compared to the three months ended September 30, 2020
- Invested $1.61 billion in 308 properties and properties under development or expansion, including $532.5 million in Europe
- Net debt to annualized EBITDAre ratio was 5.0x
- Net debt to annualized pro forma adjusted EBITDAre was 4.9x
Events subsequent to September 30, 2021:
- Completed the merger with VEREIT, Inc. and commenced consent solicitations and offers to exchange outstanding notes issued by VEREIT, Inc. for new notes issued by Realty Income
CEO Comments
"I continue to be inspired by the dynamic talent of our Realty Income team, who remains committed to executing across our strategic growth initiatives while undertaking integration efforts. We are pleased with the growth trajectory of our business and sustained health of our portfolio, as illustrated through our strong third quarter results," said Sumit Roy, Realty Income's President and Chief Executive Officer. "Our position as a global consolidator continues to build as we invested a record $3.78 billion year to date across three countries, including our debut transaction in Continental Europe. In addition, we are proud to announce today's closing of our merger with VEREIT, further establishing ourselves as a leading net lease REIT and we look forward to integrating the capabilities of many talented colleagues into our 'One Team'."
"The closing of the merger with VEREIT and our anticipated subsequent spin-off of substantially all of the combined companies' office properties allows us to provide enhanced clarity on our anticipated near-term earnings run rate, demonstrating what we believe is a compelling risk/reward proposition for investors. To that end, assuming the consummation of the spin-off as anticipated on November 12th, we are increasing our 2021 AFFO per share guidance to $3.55 - $3.60, representing 5.5% annual growth based on the midpoint, which includes increased acquisition guidance of over $5 billion, as well as introducing 2022 AFFO per share guidance of $3.84 - $3.97, representing 9.2% annual growth based on the midpoint."
Select Financial Results
The following summarizes our select financial results (dollars in millions, except per share data):
Three Months Ended September 30, | Nine Months Ended September 30, | |||||||||||
2021 | 2020 | 2021 | 2020 | |||||||||
Total revenue | $ | 491.9 | $ | 404.6 | $ | 1,399.0 | $ | 1,233.5 | ||||
Net income available to common stockholders (1)(2) | $ | 135.0 | $ | 22.9 | $ | 355.4 | $ | 277.6 | ||||
Net income per share | $ | 0.34 | $ | 0.07 | $ | 0.94 | $ | 0.81 | ||||
Funds from operations available to common stockholders (FFO) (2)(3) | $ | 332.3 | $ | 283.0 | $ | 914.4 | $ | 848.4 | ||||
FFO per share | $ | 0.85 | $ | 0.82 | $ | 2.41 | $ | 2.48 | ||||
Normalized funds from operations available to common stockholders (Normalized FFO) (3) | $ | 349.1 | $ | 283.0 | $ | 944.5 | $ | 848.4 | ||||
Normalized FFO per share | $ | 0.89 | $ | 0.82 | $ | 2.49 | $ | 2.48 | ||||
Adjusted funds from operations available to common stockholders (AFFO) (3) | $ | 356.8 | $ | 282.5 | $ | 1,002.7 | $ | 875.0 | ||||
AFFO per share | $ | 0.91 | $ | 0.81 | $ | 2.64 | $ | 2.55 | ||||
(1) | The calculation to determine net income attributable to common stockholders includes provisions for impairment, gains on sales of real estate, and foreign currency gains and losses. These items can vary from quarter to quarter and can significantly impact net income available to common stockholders and period to period comparisons. |
(2) | Our financial results during the nine months ended September 30, 2021 were impacted by the following transactions: (i) a $50.5 million loss on extinguishment of debt, primarily due to the January 2021 early redemption of the 3.250% notes due October 2022 recorded in the three months ended March 31, 2021, (ii) $30.1 million of merger-related costs related to our merger with VEREIT, of which $16.8 million related to the three months ended September 30, 2021, (iii) $31.0 million of provisions for impairment, of which $11.0 million related to the three months ended September 30, 2021, and (iv) $13.9 million in reserves, net of reserve reversals, recorded as a reduction of rental revenue. Our financial results during the nine months ended September 30, 2020 were impacted by the following transactions: (i) $123.4 million of provisions for impairment, of which $105.1 million related to the three months ended September 30, 2020, (ii) $34.4 million in reserves recorded as a reduction of rental revenue, of which $24.1 million related to the three months ended September 30, 2020, (iii) a $9.8 million loss on extinguishment of debt due to the January 2020 early redemption of the 5.750% notes due 2021 recorded in the three months ended March 31, 2020, and (iv) a $3.5 million executive severance charge for our former chief financial officer also recorded in the three months ended March 31, 2020. |
(3) | FFO, Normalized FFO, and AFFO are non-GAAP financial measures. Normalized FFO is based on FFO and adjusted to exclude merger-related costs related to our merger with VEREIT and AFFO further adjusts Normalized FFO for unique revenue and expense items, such as losses on extinguishment of debt and executive severance costs. Please see the Glossary in the Supplemental Operating and Financial Data for the three months ended September 30, 2021 for our definitions and explanations of how we utilize these metrics. See pages 10 and 11 herein for reconciliations to the most directly comparable GAAP measure. |
Rent Collections Update
Percentages of Contractual Rent Collected as of September 30, 2021
Month Ended July 31, 2021 | Month Ended August 31, 2021 | Month Ended September 30, 2021 | Quarter Ended September 30, 2021 | ||||
Contractual rent collected(1) across total portfolio | 99.4% | 99.5% | 99.7% | 99.5% | |||
Contractual rent collected(1) from our top 20 clients (2) | 99.6% | 99.8% | 99.9% | 99.8% | |||
Contractual rent collected(1) from our investment grade clients (3) | 100.0% | 100.0% | 100.0% | 100.0% | |||
Contractual rent collected from our theater clients | 99.6% | 99.6% | 99.6% | 99.6% | |||
Contractual rent collected from our health and fitness clients | 92.4% | 95.9% | 96.6% | 95.0% |
(1) | Collection rates are calculated as the aggregate contractual rent collected for the applicable period from the beginning of that applicable period through September 30, 2021, divided by the contractual rent charged for the applicable period. Rent collection percentages are calculated based on contractual rents (excluding percentage rents and contractually obligated reimbursements by our clients). Charged amounts have not been adjusted for any COVID-19 related rent relief granted and include contractual rents from any clients in bankruptcy. Due to differences in applicable foreign currency conversion rates and rent conventions, the percentages above may differ from percentages calculated utilizing our total portfolio annualized contractual rent. |
(2) | We define our top 20 clients as our 20 largest clients based on percentage of total portfolio annualized contractual rent as of September 30, 2021 for all periods. |
(3) | Please see the Glossary in the Supplemental Operating and Financial Data for the three months ended September 30, 2021 for our definition of investment grade clients. |
We either have executed deferral agreements or maintain ongoing deferral discussions with clients that account for a majority of the unpaid contractual rent for each of the periods referenced in the table above.
Rental Revenue Reserves and Reserve Reversals (1)
The following table summarizes reserves and reserve reversals to rental revenue across the entire portfolio (dollars in millions):
Three Months Ended | Nine Months Ended | ||||||||
September 30, 2021 | September 30, 2021 | ||||||||
Rental revenue reserves (reserve reversals) | |||||||||
Theater industry | $ | (1.0) | $ | 12.8 | |||||
Other | 0.2 | 2.2 | |||||||
Total rental revenue reserves | $ | (0.8) | $ | 15.0 | |||||
Straight-line rent reserves (reserve reversals) | |||||||||
Theater industry | $ | — | $ | 0.2 | |||||
Other | (2.3) | (1.3) | |||||||
Total straight-line rent reserves | $ | (2.3) | $ | (1.1) | |||||
Total reserves (reserve reversals) | |||||||||
Theater industry | $ | (1.0) | $ | 13.0 | |||||
Other | (2.1) | 0.9 | |||||||
Total reserves | $ | (3.1) | $ | 13.9 | |||||
(1) | Unless otherwise specified, references to reserves recorded as a reduction of rental revenue include amounts reserved for in the current period, as well as unrecognized contractual rental revenue and unrecognized straight-line rental revenue for leases accounted for on a cash basis. References to reserve reversals recorded as increases to rental revenue include amounts where the accounting for recognition of rental revenue and straight-line rental revenue has been moved from the cash to the accrual basis. |
Theater Industry Update
As of September 30, 2021, the theater industry represented 5.2% of annualized contractual rental revenue. As of September 30, 2021, we were fully reserved for the outstanding receivable balances for 34 theater properties. At September 30, 2021, the receivables outstanding for our 79 theater properties totaled $72.8 million, inclusive of $9.8 million of straight-line rent receivables, and net of $39.0 million of reserves, inclusive of $2.0 million of straight-line rent reserves.
For the nine months ended September 30, 2021 and the year ended 2020, we recorded $11.3 million and $22.1 million, respectively, in reserves on contractual base rent for theater properties. Contractual rents exclude contractually obligated reimbursements by our clients, which was equivalent to $1.5 million and $1.6 million, respectively, and percentage rent.
At September 30, 2021, the receivables outstanding across the portfolio totaled $341.7 million, net of $56.7 million of reserves, and includes $211.5 million of straight-line rent receivable, net of $6.2 million of reserves.
We did not record any provisions for impairment on theater properties for the nine months ended September 30, 2021. See "Item 1A—Risk Factors" in Part I of our Annual Report on Form 10-K for the year ended December 31, 2020 for more information regarding the actual and potential future impacts of the COVID-19 pandemic and the measures taken to limit its spread on our clients and our business, results of operations, financial condition and liquidity.
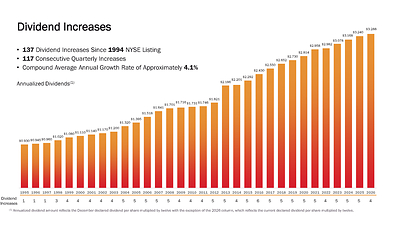
Dividend Increases
In September 2021, we announced the 96th consecutive quarterly dividend increase, which is the 112th increase in the amount of the dividend since our listing on the New York Stock Exchange (NYSE) in 1994. The annualized dividend amount as of September 30, 2021 was $2.8320 per share. The amount of monthly dividends paid per share increased 0.9% to $0.707 for the three months ended September 30, 2021, as compared to $0.701 for the three months ended September 30, 2020. During the three months ended September 30, 2021, we distributed $273.8 million in common dividends to stockholders, representing 76.7% of our AFFO of $356.8 million.
Real Estate Portfolio Update
As of September 30, 2021, our portfolio consisted of 7,018 properties located in all 50 U.S. states, Puerto Rico, the U.K. and Spain, and leased to approximately 650 clients doing business in 60 separate industries. The properties are primarily freestanding and leased under long-term net lease agreements with a weighted average remaining lease term of approximately 8.8 years. Our portfolio of commercial real estate has historically provided dependable rental revenue supporting the payment of monthly dividends. As of September 30, 2021, portfolio occupancy was 98.8% with 86 properties available for lease or sale out of 7,018, as compared to 98.5% as of June 30, 2021 and 98.6% as of September 30, 2020.
Changes in Occupancy
Three months ended September 30, 2021 | ||
Properties available for lease at June 30, 2021 | 103 | |
Lease expirations (1) | 49 | |
Re-leases to same client | (35) | |
Re-leases to new client | (8) | |
Vacant dispositions | (23) | |
Properties available for lease at September 30, 2021 | 86 | |
Nine months ended September 30, 2021 | ||
Properties available for lease at December 31, 2020 | 140 | |
Lease expirations (1) | 175 | |
Re-leases to same client | (126) | |
Re-leases to new client | (23) | |
Vacant dispositions | (80) | |
Properties available for lease at September 30, 2021 | 86 | |
(1) | Includes scheduled and unscheduled expirations (including leases rejected in bankruptcy), as well as future expirations resolved in the periods indicated above. |
During the three months ended September 30, 2021, the annual new rent on re-leases was $18.172 million, as compared to the previous annual rent of $16.948 million on the same units, representing a rent recapture rate of 107.2% on the units re-leased. We re-leased four units to new clients without a period of vacancy, and seven units to new clients after a period of vacancy.
During the nine months ended September 30, 2021, the annual new rent on re-leases was $40.145 million, as compared to the previous annual rent of $38.068 million on the same units, representing a rent recapture rate of 105.5% on the units re-leased. We re-leased seven units to new clients without a period of vacancy, and 24 units to new clients after a period of vacancy.
Investments in Real Estate
The following table summarizes our acquisitions in the U.S. and Europe for the periods indicated below:
Number of Properties | Leasable Square Feet | Investment ($ in thousands) | Weighted Average Lease Term (Years) | Initial Average Cash Lease Yield (1) | |||||||||||
Three months ended September 30, 2021 | |||||||||||||||
Acquisitions - U.S. (in 32 states) | 242 | 4,741,648 | $ | 1,020,768 | 13.9 | 5.5 | % | ||||||||
Acquisitions - Europe (U.K. and Spain) | 30 | 2,083,732 | 526,033 | 11.9 | 5.4 | % | |||||||||
Total acquisitions | 272 | 6,825,380 | 1,546,801 | 13.2 | 5.5 | % | |||||||||
Properties under development (2) | 36 | 1,983,960 | 67,160 | 16.2 | 6.1 | % | |||||||||
Total (3) | 308 | 8,809,340 | $ | 1,613,961 | 13.4 | 5.5 | % | ||||||||
Nine months ended September 30, 2021 | |||||||||||||||
Acquisitions - U.S. (in 38 states) | 415 | 9,226,363 | $ | 2,073,101 | 13.8 | 5.5 | % | ||||||||
Acquisitions - Europe (U.K. and Spain) | 71 | 5,217,192 | 1,520,816 | 10.5 | 5.5 | % | |||||||||
Total acquisitions | 486 | 14,443,555 | $ | 3,593,917 | 12.4 | 5.5 | % | ||||||||
Properties under development (2) | 50 | 2,126,955 | 181,957 | 15.8 | 5.9 | % | |||||||||
Total (4) | 536 | 16,570,510 | $ | 3,775,874 | 12.6 | 5.5 | % | ||||||||
(1) | Initial average cash lease yield is a supplemental operating measure. Please see the Glossary in the Supplemental Operating and Financial Data for the three months ended September 30, 2021 for our definition of this metric. Contractual net operating income used in the calculation of initial average cash yield includes approximately $2.4 million received as settlement credits for 31 properties as reimbursement of free rent periods for the three months ended September 30, 2021 and approximately $3.2 million received as settlement credits for 35 properties as reimbursement of free rent periods for the nine months ended September 30, 2021. |
(2) | Includes one U.K. development property that represents an investment of £4.7 million Sterling during the three and nine months ended September 30, 2021, converted at the applicable exchange rate on the funding date. |
(3) | Our clients occupying the new properties are 86.2% retail and 13.8% industrial, based on rental revenue. Approximately 38% of the rental revenue generated from acquisitions during the three months ended September 30, 2021 is from our investment grade rated clients, their subsidiaries or affiliated companies. |
(4) | Our clients occupying the new properties are 80.2% retail and 19.8% industrial, based on rental revenue. Approximately 43% of the rental revenue generated from acquisitions during the nine months ended September 30, 2021 is from our investment grade rated clients, their subsidiaries or affiliated companies. |
Same Store Rental Revenue
The following summarizes our same store rental revenue on 6,099 properties under lease (dollars in millions):
Three Months Ended September 30, | Nine Months Ended September 30, | Increase | |||||||||||||||
2021 | 2020 | 2021 | 2020 | Three Months | Nine Months | ||||||||||||
Rental revenue | $ | 380.3 | $ | 358.9 | $ | 1,127.3 | $ | 1,105.3 | 6.0 | % | 2.0 | % | |||||
For purposes of comparability, same store rental revenue is presented on a constant currency basis using the exchange rate as of September 30, 2021 of 1.35 GBP/USD. None of the properties in Spain met our same store pool definition for the periods presented.
Our calculation of same store rental revenue includes rent deferred for future payment as a result of lease concessions we granted in response to the COVID-19 pandemic and recognized under the practical expedient provided by the Financial Accounting Standards Board (FASB). Same store rental income was impacted by (reserve reversals) and reserves to rental revenue of $(313,000) for the three months ended September 30, 2021 compared to $18.0 million for the three months ended September 30, 2020, and $12.7 million for the nine months ended September 30, 2021 compared to $21.7 million for the nine months ended September 30, 2020. Our calculation of same store rental revenue also includes uncollected rent for which we have not granted a lease concession. If these applicable amounts of rent deferrals and uncollected rent were excluded from our calculation of same store rental revenue, the increases for the three and nine months ended September 30, 2021 relative to the comparable periods for 2020 would have been 8.5% and 6.1%, respectively.
Property Dispositions
The following summarizes our property dispositions (dollars in millions):
Three Months Ended | Nine Months Ended | |||||
Properties sold | 27 | 96 | ||||
Net sales proceeds | $ | 31.9 | $ | 123.5 | ||
Gain on sales of real estate | $ | 12.1 | $ | 35.4 | ||
Liquidity and Capital Markets
Capital Raising
During the three months ended September 30, 2021, we raised $1.63 billion from the sale of common stock at a weighted average price of $67.93 per share, primarily through proceeds from the sale of common stock through our At-The-Market-Program and the July 2021 raising of $594.1 million from the issuance of 9,200,000 shares of common stock in an underwritten public offering, inclusive of 1,200,000 shares purchased by the underwriters upon the exercise of their option to purchase additional shares.
In July 2021, we issued £400 million of 1.125% senior unsecured notes due 2027 (the "2027" Notes) and £350 million of 1.750% senior unsecured notes due 2033 (the "2033" Notes). The public offering price for the 2027 Notes was 99.305% of the principal amount, for an effective semi-annual yield to maturity of 1.242%, and the public offering price for the 2033 Notes was 99.842% of the principal amount, for an effective semi-annual yield to maturity of 1.757%. Combined, the new issues of the 2027 Notes and 2033 Notes have a weighted average term of 8.8 years and a weighted average effective semi-annual yield to maturity of 1.48%. The issuances represented our debut green bond offering.
Revolving Credit Facility and Commercial Paper Program
We have a $3.0 billion unsecured revolving credit facility, with an initial term that expires in March 2023 (subject to two six-month options to extend). The revolving credit facility also has a $1.0 billion accordion feature, which is subject to obtaining lender commitments. As of September 30, 2021, there were no borrowings on our revolving credit facility. In addition, we had a cash balance of $517.0 million.
Additionally, we have a U.S. dollar-denominated unsecured commercial paper program. Under the terms of this program, we may issue unsecured commercial paper notes up to a maximum aggregate amount outstanding of $1.0 billion, with proceeds used for general corporate purposes. We use our unsecured revolving credit facility as a liquidity backstop for the repayment of the notes issued under this program. As of September 30, 2021, we had $405.0 million in commercial paper borrowings.
Earnings Guidance
Normalized FFO per share and AFFO per share exclude the merger-related costs associated with the VEREIT merger. Net income and Normalized FFO guidance does not include any one-time charges associated with future debt redemptions. Summarized below are approximate estimates of the key components of our 2021 and preliminary 2022 earnings guidance:
Prior 2021 Guidance | Revised 2021 Guidance | |
(Excluding VEREIT merger) | (Including VEREIT merger) | |
Net income per share (1) | $1.32 to $1.41 | $1.39 to $1.44 |
Real estate depreciation and impairments per share | $2.11 | $2.06 |
Gains on sales of properties per share | $(0.09) | $(0.10) |
Merger-related costs (actual) (1) | $0.03 | $0.08 |
Normalized FFO per share | $3.37 to $3.46 | $3.43 to $3.48 |
AFFO per share | $3.53 to $3.59 | $3.55 to $3.60 |
Same store rent growth (2) | 1.5% - 2.0% | ~ 2.0% |
Occupancy | Over 98% | Over 98% |
Cash G&A expenses (% of revenues) (3)(4) | ~ 4.5% | 4.0% - 4.5% |
Property expenses (non-reimbursable) (% of revenues) (3) | 1.5% - 1.8% | 1.5% - 1.8% |
Income tax expenses | ~ $25 million | ~ $30 million |
Acquisition volume | ~ $4.5 billion | Over $5.0 billion |
Preliminary 2022 Guidance | ||
AFFO per share | $3.84 to $3.97 | |
Cash G&A expenses (% of revenues) (3) | 3.5% - 4.0% | |
Acquisition volume | Over $5.0 billion | |
(1) | Does not include any estimated merger-related costs for the remainder of 2021. | |
(2) | Includes rent deferred for future payment as a result of lease concessions we granted in response to the COVID-19 pandemic. | |
(3) | Revenue excludes contractually obligated reimbursements by our clients. Cash G&A excludes stock-based compensation expense. | |
(4) | G&A inclusive of stock-based compensation expense as a percentage of rental revenue, excluding reimbursements, is expected to be approximately 5.0% in 2021 and 4.0% - 4.5% in 2022. | |
Conference Call Information
In conjunction with the release of our operating results, we will host a conference call on November 2, 2021 at 11:30 a.m. PT to discuss the results. To access the conference call, dial (888) 440-5675 (United States) or (646) 960-0268 (International). When prompted, provide the conference ID 9982808.
A telephone replay of the conference call can also be accessed by calling (800) 770-2030 and entering the conference ID 9982808. The telephone replay will be available through November 16, 2021.
A live webcast will be available in listen-only mode by clicking on the webcast link on our home page or in the investors section at www.realtyincome.com. A replay of the conference call webcast will be available approximately one hour after the conclusion of the live broadcast. No access code is required for this replay.
Supplemental Materials and Sustainability Report
Supplemental Operating and Financial Data for the three months ended September 30, 2021, including reconciliations for non-GAAP measures within the Glossary, are available on our corporate website at www.realtyincome.com/investors/financial-information/quarterly-results.
The Sustainability Report for the year ended December 31, 2020 is available on our corporate website at www.realtyincome.com/corporate-responsibility. During June 2021, we established our Green Financing Framework, which is also available on our corporate website at www.realtyincome.com/corporate-responsibility/Green-Financing-Framework.
About Realty Income
Realty Income, The Monthly Dividend Company®, is an S&P 500 company and member of the S&P 500 Dividend Aristocrats® index. We invest in people and places to deliver dependable monthly dividends that increase over time. The company is structured as a REIT, and its monthly dividends are supported by the cash flow from over 7,000 real estate properties owned under long-term lease agreements with our commercial clients. To date, the company has declared 616 consecutive common stock monthly dividends throughout its 52-year operating history and increased the dividend 112 times since Realty Income's public listing in 1994 (NYSE: O). Additional information about the company can be obtained from the corporate website at www.realtyincome.com.
Forward-Looking Statements
Statements in this press release that are not strictly historical are "forward-looking" statements. Forward-looking statements involve known and unknown risks, which may cause our actual future results to differ materially from expected results. These risks include, among others, general economic conditions, domestic and foreign real estate conditions, client financial health, the availability of capital to finance planned growth, volatility and uncertainty in the credit markets and broader financial markets, changes in foreign currency exchange rates, property acquisitions and the timing of these acquisitions, the structure, timing and completion of the anticipated spin-off of the office properties of Realty Income, Inc., and any effects of the announcement, pendency or completion of the spin-off, including the anticipated benefits therefrom, the anticipated benefits of the completed merger with VEREIT, charges for property impairments, the effects of the COVID-19 pandemic and the measures taken to limit its impact, the effects of pandemics or global outbreaks of contagious diseases or fear of such outbreaks, the ability of clients to adequately manage their properties and fulfill their respective lease obligations to Realty Income, and the outcome of any legal proceedings to which Realty Income is a party. Consequently, forward-looking statements should be regarded solely as reflections of Realty Income's or VEREIT's current operating plans and estimates. Actual operating results may differ materially from what is expressed or forecast in this press release. Neither Realty Income nor VEREIT undertake any obligation to publicly release the results of any revisions to these forward-looking statements that may be made to reflect events or circumstances after the date these statements were made.
CONSOLIDATED STATEMENTS OF INCOME | ||||||||||||||||
(dollars in thousands, except per share amounts) (unaudited) | ||||||||||||||||
Three Months | Three Months | Nine Months | Nine Months | |||||||||||||
Ended 9/30/21 | Ended 9/30/20 | Ended 9/30/21 | Ended 9/30/20 | |||||||||||||
REVENUE | ||||||||||||||||
Rental (including reimbursable) (1) | $ | 486,337 | $ | 401,869 | $ | 1,385,958 | $ | 1,224,227 | ||||||||
Other | 5,538 | 2,703 | 13,003 | 9,322 | ||||||||||||
Total revenue | 491,875 | 404,572 | 1,398,961 | 1,233,549 | ||||||||||||
EXPENSES | ||||||||||||||||
Depreciation and amortization | 198,832 | 169,084 | 564,606 | 501,997 | ||||||||||||
Interest | 76,156 | 76,806 | 222,905 | 230,572 | ||||||||||||
Property (including reimbursable) | 29,662 | 25,410 | 89,895 | 77,468 | ||||||||||||
General and administrative | 23,813 | 16,514 | 66,458 | 56,541 | ||||||||||||
Provisions for impairment | 11,011 | 105,095 | 30,977 | 123,442 | ||||||||||||
Merger-related costs | 16,783 | — | 30,081 | — | ||||||||||||
Total expenses | 356,257 | 392,909 | 1,004,922 | 990,020 | ||||||||||||
Gain on sales of real estate | 12,094 | 13,736 | 35,396 | 53,565 | ||||||||||||
Foreign currency and derivative gains (losses), net | (2,374) | 2,336 | (1,170) | 1,274 | ||||||||||||
Loss on extinguishment of debt | (3,983) | — | (50,456) | (9,819) | ||||||||||||
Income before income taxes | 141,355 | 27,735 | 377,809 | 288,549 | ||||||||||||
Income taxes | (6,079) | (4,592) | (21,529) | (10,193) | ||||||||||||
Net income | 135,276 | 23,143 | 356,280 | 278,356 | ||||||||||||
Net income attributable to noncontrolling interests | (280) | (239) | (865) | (801) | ||||||||||||
Net income available to common stockholders | $ | 134,996 | $ | 22,904 | $ | 355,415 | $ | 277,555 | ||||||||
Funds from operations available to common stockholders (FFO) | $ | 332,335 | $ | 282,978 | $ | 914,417 | $ | 848,419 | ||||||||
Normalized funds from operations available to common stockholders (Normalized FFO) | $ | 349,118 | $ | 282,978 | $ | 944,498 | $ | 848,419 | ||||||||
Adjusted funds from operations available to common stockholders (AFFO) | $ | 356,837 | $ | 282,509 | $ | 1,002,706 | $ | 874,972 | ||||||||
Per share information for common stockholders: | ||||||||||||||||
Net income, basic and diluted | $ | 0.34 | $ | 0.07 | $ | 0.94 | $ | 0.81 | ||||||||
FFO, basic and diluted | $ | 0.85 | $ | 0.82 | $ | 2.41 | $ | 2.48 | ||||||||
Normalized FFO, basic and diluted | $ | 0.89 | $ | 0.82 | $ | 2.49 | $ | 2.48 | ||||||||
AFFO: | ||||||||||||||||
Basic | $ | 0.91 | $ | 0.82 | $ | 2.64 | $ | 2.56 | ||||||||
Diluted | $ | 0.91 | $ | 0.81 | $ | 2.64 | $ | 2.55 | ||||||||
Cash dividends paid per common share | $ | 0.707 | $ | 0.701 | $ | 2.115 | $ | 2.092 | ||||||||
(1) | We recorded (reserve reversals) and reserves to rental revenue of $(3.1) million (of which $(2.3) million was related to straight-line rent receivables) for the three months ended September 30, 2021 and $24.1 million (of which $2.3 million was related to straight-line receivables) for the three months ended September 30, 2020, $13.9 million (of which $(1.1) million was related to straight-line rent receivables) for the nine months ended September 30, 2021 and $34.4 million (of which $5.1 million was related to straight-line receivables) for the nine months ended September 30, 2020. Unless otherwise specified, references to reserves recorded as a reduction of rental revenue include amounts reserved for in the current period, as well as unrecognized contractual rental revenue and unrecognized straight-line rental revenue for leases accounted for on a cash basis. References to reserve reversals recorded as increases to rental revenue include amounts where the accounting for recognition of rental revenue and straight-line rental revenue has been moved from the cash to the accrual basis. |
FUNDS FROM OPERATIONS (FFO) AND NORMALIZED FUNDS FROM OPERATIONS (Normalized FFO)
(dollars in thousands, except per share amounts)
FFO and Normalized FFO are non-GAAP financial measures. Please see the Glossary in the Supplemental Operating and Financial Data for the three months ended September 30, 2021 for our definitions and explanations of how we utilize these metrics.
Three Months | Three Months | Nine Months | Nine Months | |||||||||||||
Ended 9/30/21 | Ended 9/30/20 | Ended 9/30/21 | Ended 9/30/20 | |||||||||||||
Net income available to common stockholders | $ | 134,996 | $ | 22,904 | $ | 355,415 | $ | 277,555 | ||||||||
Depreciation and amortization | 198,832 | 169,084 | 564,606 | 501,997 | ||||||||||||
Depreciation of furniture, fixtures and equipment | (230) | (157) | (674) | (435) | ||||||||||||
Provisions for impairment | 11,011 | 105,095 | 30,977 | 123,442 | ||||||||||||
Gain on sales of real estate | (12,094) | (13,736) | (35,396) | (53,565) | ||||||||||||
FFO adjustments allocable to noncontrolling interests | (180) | (212) | (511) | (575) | ||||||||||||
FFO available to common stockholders | $ | 332,335 | $ | 282,978 | $ | 914,417 | $ | 848,419 | ||||||||
FFO allocable to dilutive noncontrolling interests | 356 | 345 | 1,062 | 1,063 | ||||||||||||
Diluted FFO | $ | 332,691 | $ | 283,323 | $ | 915,479 | $ | 849,482 | ||||||||
FFO available to common stockholders | $ | 332,335 | $ | 282,978 | $ | 914,417 | $ | 848,419 | ||||||||
Merger-related costs | 16,783 | — | 30,081 | — | ||||||||||||
Normalized FFO available to common stockholders | $ | 349,118 | $ | 282,978 | $ | 944,498 | $ | 848,419 | ||||||||
Normalized FFO allocable to dilutive noncontrolling interests | 356 | 345 | 1,062 | 1,063 | ||||||||||||
Diluted Normalized FFO | $ | 349,474 | $ | 283,323 | $ | 945,560 | $ | 849,482 | ||||||||
FFO per common share, basic and diluted | $ | 0.85 | $ | 0.82 | $ | 2.41 | $ | 2.48 | ||||||||
Normalized FFO per common share, basic and diluted | $ | 0.89 | $ | 0.82 | $ | 2.49 | $ | 2.48 | ||||||||
Distributions paid to common stockholders | $ | 273,791 | $ | 242,241 | $ | 797,847 | $ | 716,535 | ||||||||
FFO available to common stockholders in excess of distributions paid to common stockholders | $ | 58,544 | $ | 40,737 | $ | 116,570 | $ | 131,884 | ||||||||
Normalized FFO available to common stockholders in excess of distributions paid to common stockholders | $ | 75,327 | $ | 40,737 | $ | 146,651 | $ | 131,884 | ||||||||
Weighted average number of common shares used for FFO and Normalized FFO: | ||||||||||||||||
Basic | 391,913,478 | 346,476,217 | 379,291,782 | 342,214,164 | ||||||||||||
Diluted | 392,513,520 | 347,212,593 | 379,872,546 | 342,946,337 | ||||||||||||
ADJUSTED FUNDS FROM OPERATIONS (AFFO)
(dollars in thousands, except per share amounts)
AFFO is a non-GAAP financial measure. Please see the Glossary in the Supplemental Operating and Financial Data for the three months ended September 30, 2021 for our definition and an explanation of how we utilize this metric.
Three Months | Three Months | Nine Months | Nine Months | |||||||||||||
Ended 9/30/21 | Ended 9/30/20 | Ended 9/30/21 | Ended 9/30/20 | |||||||||||||
Net income available to common stockholders (1) | $ | 134,996 | $ | 22,904 | $ | 355,415 | $ | 277,555 | ||||||||
Cumulative adjustments to calculate Normalized FFO (2) | 214,122 | 260,074 | 589,083 | 570,864 | ||||||||||||
Normalized FFO available to common stockholders | 349,118 | 282,978 | 944,498 | 848,419 | ||||||||||||
Executive severance charge (3) | — | — | — | 3,463 | ||||||||||||
Loss on extinguishment of debt | 3,983 | — | 50,456 | 9,819 | ||||||||||||
Amortization of share-based compensation | 4,315 | 3,020 | 12,484 | 11,644 | ||||||||||||
Amortization of deferred financing costs (4) | 2,067 | 956 | 5,442 | 3,792 | ||||||||||||
Amortization of net mortgage premiums | (673) | (310) | (1,158) | (1,020) | ||||||||||||
Loss on interest rate swaps | 733 | 1,123 | 2,179 | 3,115 | ||||||||||||
Straight-line payments from cross-currency swaps (5) | 513 | 614 | 1,715 | 1,960 | ||||||||||||
Leasing costs and commissions | (1,199) | 98 | (2,026) | (1,013) | ||||||||||||
Recurring capital expenditures | (365) | (105) | (415) | (126) | ||||||||||||
Straight-line rent | (14,801) | (6,445) | (36,268) | (20,469) | ||||||||||||
Amortization of above and below-market leases, net | 10,312 | 2,408 | 23,546 | 14,925 | ||||||||||||
Other adjustments (6) | 2,834 | (1,828) | 2,253 | 463 | ||||||||||||
AFFO available to common stockholders | $ | 356,837 | $ | 282,509 | $ | 1,002,706 | $ | 874,972 | ||||||||
AFFO allocable to dilutive noncontrolling interests | 351 | 347 | 1,047 | 1,079 | ||||||||||||
Diluted AFFO | $ | 357,188 | $ | 282,856 | $ | 1,003,753 | $ | 876,051 | ||||||||
AFFO per common share: | ||||||||||||||||
Basic | $ | 0.91 | $ | 0.82 | $ | 2.64 | $ | 2.56 | ||||||||
Diluted | $ | 0.91 | $ | 0.81 | $ | 2.64 | $ | 2.55 | ||||||||
Distributions paid to common stockholders | $ | 273,791 | $ | 242,241 | $ | 797,847 | $ | 716,535 | ||||||||
AFFO available to common stockholders in excess of distributions paid to common stockholders | $ | 83,046 | $ | 40,268 | $ | 204,859 | $ | 158,437 | ||||||||
Weighted average number of common shares used for AFFO: | ||||||||||||||||
Basic | 391,913,478 | 346,476,217 | 379,291,782 | 342,214,164 | ||||||||||||
Diluted | 392,513,520 | 347,212,593 | 379,872,546 | 342,946,337 | ||||||||||||
(1) | As of September 30, 2021, there was $35.2 million of uncollected rent deferred as a result of lease concessions we granted in response to the COVID-19 pandemic and recognized under the practical expedient provided by the Financial Accounting Standards Board (FASB) and $62.0 million of uncollected rent for which we have not granted a lease concession. |
(2) | See Normalized FFO calculations on page ten for reconciling items. |
(3) | The executive severance charge represents the incremental costs incurred upon our former CFO's departure in March 2020, consisting of $1.6 million of cash, $1.8 million of share-based compensation expense and $58,000 of professional fees. |
(4) | Includes the amortization of costs incurred and capitalized upon issuance of our notes payable, assumption of our mortgages payable and issuance of our current and previous term loans. The deferred financing costs are being amortized over the lives of the respective notes payable, mortgages and term loan. No costs associated with our credit facility agreements or annual fees paid to credit rating agencies have been included. |
(5) | Straight-line payments from cross-currency swaps represent quarterly payments in U.S. dollars received by us from counterparties in exchange for associated foreign currency payments. These USD payments are fixed and determinable for the duration of the associated hedging transaction. |
(6) | Includes adjustments allocable to noncontrolling interests, obligations related to financing lease liabilities, mark-to-market adjustments on derivatives that do not qualify for hedge accounting, and foreign currency gains and losses as a result of intercompany debt and remeasurement transactions. |
HISTORICAL FFO AND AFFO | ||||||||||||||||||||
(dollars in thousands, except per share amounts) | ||||||||||||||||||||
For the three months ended September 30, | 2021 | 2020 | 2019 | 2018 | 2017 | |||||||||||||||
Net income available to common stockholders | $ | 134,996 | $ | 22,904 | $ | 101,049 | $ | 98,999 | $ | 87,940 | ||||||||||
Depreciation and amortization, net of furniture, fixtures and equipment | 198,602 | 168,927 | 149,288 | 136,801 | 127,436 | |||||||||||||||
Provisions for impairment | 11,011 | 105,095 | 13,503 | 6,862 | 365 | |||||||||||||||
Gain on sales of real estate | (12,094) | (13,736) | (1,674) | (7,813) | (4,319) | |||||||||||||||
FFO adjustments allocable to noncontrolling interests | (180) | (212) | (135) | (299) | (230) | |||||||||||||||
FFO available to common stockholders | $ | 332,335 | $ | 282,978 | $ | 262,031 | $ | 234,550 | $ | 211,192 | ||||||||||
Merger-related costs | 16,783 | — | — | — | — | |||||||||||||||
Normalized FFO available to common stockholders | $ | 349,118 | $ | 282,978 | $ | 262,031 | $ | 234,550 | $ | 211,192 | ||||||||||
FFO per diluted share | $ | 0.85 | $ | 0.82 | $ | 0.82 | $ | 0.81 | $ | 0.77 | ||||||||||
Normalized FFO per diluted share | $ | 0.89 | $ | 0.82 | $ | 0.82 | $ | 0.81 | $ | 0.77 | ||||||||||
AFFO available to common stockholders | $ | 356,837 | $ | 282,509 | $ | 265,355 | $ | 236,195 | $ | 213,601 | ||||||||||
AFFO per diluted share | $ | 0.91 | $ | 0.81 | $ | 0.83 | $ | 0.81 | $ | 0.77 | ||||||||||
. | ||||||||||||||||||||
Cash dividends paid per share | $ | 0.707 | $ | 0.701 | $ | 0.680 | $ | 0.660 | $ | 0.635 | ||||||||||
Weighted average diluted shares outstanding - FFO and Normalized FFO | 392,513,520 | 347,212,593 | 320,726,136 | 291,207,186 | 276,050,671 | |||||||||||||||
Weighted average diluted shares outstanding - AFFO | 392,513,520 | 347,212,593 | 320,726,136 | 291,207,186 | 276,138,853 | |||||||||||||||
For the nine months ended September 30, | 2021 | 2020 | 2019 | 2018 | 2017 | |||||||||||||||
Net income available to common stockholders | $ | 355,415 | $ | 277,555 | $ | 307,185 | $ | 278,542 | $ | 240,662 | ||||||||||
Depreciation and amortization, net of furniture, fixtures and equipment | 563,932 | 501,562 | 436,929 | 401,576 | 371,315 | |||||||||||||||
Provisions for impairment | 30,977 | 123,442 | 31,236 | 25,034 | 8,072 | |||||||||||||||
Gain on sales of real estate | (35,396) | (53,565) | (15,828) | (18,818) | (17,689) | |||||||||||||||
FFO adjustments allocable to noncontrolling interests | (511) | (575) | (327) | (820) | (683) | |||||||||||||||
FFO available to common stockholders | $ | 914,417 | $ | 848,419 | $ | 759,195 | $ | 685,514 | $ | 601,677 | ||||||||||
Merger-related costs | 30,081 | — | — | — | — | |||||||||||||||
Normalized FFO available to common stockholders | $ | 944,498 | $ | 848,419 | $ | 759,195 | $ | 685,514 | $ | 601,677 | ||||||||||
FFO per diluted share | $ | 2.41 | $ | 2.48 | $ | 2.43 | $ | 2.39 | $ | 2.22 | ||||||||||
Normalized FFO per diluted share | $ | 2.49 | $ | 2.48 | $ | 2.43 | $ | 2.39 | $ | 2.22 | ||||||||||
AFFO available to common stockholders | $ | 1,002,706 | $ | 874,972 | $ | 768,026 | $ | 687,744 | $ | 623,327 | ||||||||||
AFFO per diluted share | $ | 2.64 | $ | 2.55 | $ | 2.46 | $ | 2.40 | $ | 2.30 | ||||||||||
. | ||||||||||||||||||||
Cash dividends paid per share | $ | 2.115 | $ | 2.092 | $ | 2.030 | $ | 1.969 | $ | 1.891 | ||||||||||
Weighted average diluted shares outstanding - FFO and Normalized FFO | 379,872,546 | 342,946,337 | 312,300,391 | 287,105,285 | 271,126,114 | |||||||||||||||
Weighted average diluted shares outstanding - AFFO | 379,872,546 | 342,946,337 | 312,300,391 | 287,105,285 | 271,214,296 | |||||||||||||||
REALTY INCOME CORPORATION AND SUBSIDIARIES | ||||||||
CONSOLIDATED BALANCE SHEETS | ||||||||
(dollars in thousands, except per share and share count data) (unaudited) | ||||||||
September 30, 2021 | December 31, 2020 | |||||||
ASSETS | ||||||||
Real estate held for investment, at cost: | ||||||||
Land | $ | 7,308,046 | $ | 6,318,926 | ||||
Buildings and improvements | 16,374,061 | 14,696,712 | ||||||
Total real estate held for investment, at cost | 23,682,107 | 21,015,638 | ||||||
Less accumulated depreciation and amortization | (3,904,327) | (3,549,486) | ||||||
Real estate held for investment, net | 19,777,780 | 17,466,152 | ||||||
Real estate and lease intangibles held for sale, net | 44,939 | 19,004 | ||||||
Cash and cash equivalents | 516,983 | 824,476 | ||||||
Accounts receivable, net | 341,729 | 285,701 | ||||||
Lease intangible assets, net | 2,156,008 | 1,710,655 | ||||||
Other assets, net | 873,655 | 434,297 | ||||||
Total assets | $ | 23,711,094 | $ | 20,740,285 | ||||
LIABILITIES AND EQUITY | ||||||||
Distributions payable | $ | 96,280 | $ | 85,691 | ||||
Accounts payable and accrued expenses | 269,587 | 241,336 | ||||||
Lease intangible liabilities, net | 341,675 | 321,198 | ||||||
Other liabilities | 385,077 | 256,863 | ||||||
Line of credit payable and commercial paper | 405,000 | — | ||||||
Term loan, net | 249,507 | 249,358 | ||||||
Mortgages payable, net | 285,617 | 300,360 | ||||||
Notes payable, net | 8,309,238 | 8,267,749 | ||||||
Total liabilities | 10,341,981 | 9,722,555 | ||||||
Commitments and contingencies | ||||||||
Stockholders' equity: | ||||||||
Common stock and paid in capital, par value $0.01 per share, 740,200,000 shares authorized, 404,206,076 and 361,303,445 shares issued and outstanding as of September 30, 2021 and December 31, 2020, respectively | 17,449,122 | 14,700,050 | ||||||
Distributions in excess of net income | (4,112,953) | (3,659,933) | ||||||
Accumulated other comprehensive loss | (1,076) | (54,634) | ||||||
Total stockholders' equity | 13,335,093 | 10,985,483 | ||||||
Noncontrolling interests | 34,020 | 32,247 | ||||||
Total equity | 13,369,113 | 11,017,730 | ||||||
Total liabilities and equity | $ | 23,711,094 | $ | 20,740,285 | ||||
Realty Income Performance vs. Major Stock Indices | |||||||||||||||||||
Equity | NASDAQ | ||||||||||||||||||
Realty Income | REIT Index (1) | DJIA | S&P 500 | Composite | |||||||||||||||
Dividend | Total | Dividend | Total | Dividend | Total | Dividend | Total | Dividend | Total | ||||||||||
yield | return (2) | yield | return (3) | yield | return (3) | yield | return (3) | yield | return (4) | ||||||||||
10/18 to 12/31/1994 | 10.5% | 10.8% | 7.7% | 0.0% | 2.9% | (1.6%) | 2.9% | (1.2%) | 0.5% | (1.7%) | |||||||||
1995 | 8.3% | 42.0% | 7.4% | 15.3% | 2.4% | 36.9% | 2.3% | 37.6% | 0.6% | 39.9% | |||||||||
1996 | 7.9% | 15.4% | 6.1% | 35.3% | 2.2% | 28.9% | 2.0% | 23.0% | 0.2% | 22.7% | |||||||||
1997 | 7.5% | 14.5% | 5.5% | 20.3% | 1.8% | 24.9% | 1.6% | 33.4% | 0.5% | 21.6% | |||||||||
1998 | 8.2% | 5.5% | 7.5% | (17.5%) | 1.7% | 18.1% | 1.3% | 28.6% | 0.3% | 39.6% | |||||||||
1999 | 10.5% | (8.7%) | 8.7% | (4.6%) | 1.3% | 27.2% | 1.1% | 21.0% | 0.2% | 85.6% | |||||||||
2000 | 8.9% | 31.2% | 7.5% | 26.4% | 1.5% | (4.7%) | 1.2% | (9.1%) | 0.3% | (39.3%) | |||||||||
2001 | 7.8% | 27.2% | 7.1% | 13.9% | 1.9% | (5.5%) | 1.4% | (11.9%) | 0.3% | (21.1%) | |||||||||
2002 | 6.7% | 26.9% | 7.1% | 3.8% | 2.6% | (15.0%) | 1.9% | (22.1%) | 0.5% | (31.5%) | |||||||||
2003 | 6.0% | 21.0% | 5.5% | 37.1% | 2.3% | 28.3% | 1.8% | 28.7% | 0.6% | 50.0% | |||||||||
2004 | 5.2% | 32.7% | 4.7% | 31.6% | 2.2% | 5.6% | 1.8% | 10.9% | 0.6% | 8.6% | |||||||||
2005 | 6.5% | (9.2%) | 4.6% | 12.2% | 2.6% | 1.7% | 1.9% | 4.9% | 0.9% | 1.4% | |||||||||
2006 | 5.5% | 34.8% | 3.7% | 35.1% | 2.5% | 19.0% | 1.9% | 15.8% | 0.8% | 9.5% | |||||||||
2007 | 6.1% | 3.2% | 4.9% | (15.7%) | 2.7% | 8.8% | 2.1% | 5.5% | 0.8% | 9.8% | |||||||||
2008 | 7.3% | (8.2%) | 7.6% | (37.7%) | 3.6% | (31.8%) | 3.2% | (37.0%) | 1.3% | (40.5%) | |||||||||
2009 | 6.6% | 19.3% | 3.7% | 28.0% | 2.6% | 22.6% | 2.0% | 26.5% | 1.0% | 43.9% | |||||||||
2010 | 5.1% | 38.6% | 3.5% | 27.9% | 2.6% | 14.0% | 1.9% | 15.1% | 1.2% | 16.9% | |||||||||
2011 | 5.0% | 7.3% | 3.8% | 8.3% | 2.8% | 8.3% | 2.3% | 2.1% | 1.3% | (1.8%) | |||||||||
2012 | 4.5% | 20.1% | 3.5% | 19.7% | 3.0% | 10.2% | 2.5% | 16.0% | 2.6% | 15.9% | |||||||||
2013 | 5.8% | (1.8%) | 3.9% | 2.9% | 2.3% | 29.6% | 2.0% | 32.4% | 1.4% | 38.3% | |||||||||
2014 | 4.6% | 33.7% | 3.6% | 28.0% | 2.3% | 10.0% | 2.0% | 13.7% | 1.3% | 13.4% | |||||||||
2015 | 4.4% | 13.0% | 3.9% | 2.8% | 2.6% | 0.2% | 2.2% | 1.4% | 1.4% | 5.7% | |||||||||
2016 | 4.2% | 16.0% | 4.0% | 8.6% | 2.5% | 16.5% | 2.1% | 12.0% | 1.4% | 7.5% | |||||||||
2017 | 4.5% | 3.6% | 3.9% | 8.7% | 2.2% | 28.1% | 1.9% | 21.8% | 1.1% | 28.2% | |||||||||
2018 | 4.2% | 15.2% | 4.4% | (4.0%) | 2.5% | (3.5%) | 2.2% | (4.4%) | 1.4% | (3.9%) | |||||||||
2019 | 3.7% | 21.1% | 3.7% | 28.7% | 2.4% | 25.3% | 1.9% | 31.5% | 1.1% | 35.2% | |||||||||
2020 | 4.5% | (11.8%) | 3.6% | (5.1%) | 1.9% | 9.7% | 1.5% | 18.4% | 0.9% | 43.6% | |||||||||
YTD 2021 | 4.4% | 7.7% | 2.9% | 21.6% | 1.9% | 12.1% | 1.4% | 15.9% | 0.7% | 12.1% | |||||||||
Compound Average Annual Total Return (5) | 15.1% | 10.7% | 10.9% | 10.7% | 11.5% | ||||||||||||||
Note: All of these dividend yields are calculated as annualized dividends based on the last dividend paid in applicable time period divided by the closing price as of period end. Dividend yield sources: Nareit website and Bloomberg, except for the 1994 NASDAQ dividend yield which was sourced from Datastream / Thomson Financial. | |
(1) | FTSE Nareit US Equity REIT Index, as per Nareit website. |
(2) | Calculated as the difference between the closing stock price as of period end less the closing stock price as of previous period, plus dividends paid in period, divided by closing stock price as of end of previous period. Does not include reinvestment of dividends for the annual percentages. |
(3) | Includes reinvestment of dividends. Source: Nareit website and Factset. |
(4) | Price only index, does not include dividends as NASDAQ did not report total return metrics for the entirety of the measurement period. Source: Factset. |
(5) | All of these Compound Average Annual Total Return rates are calculated in the same manner for each period from Realty Income's NYSE listing on October 18, 1994 through September 30, 2021, and (except for NASDAQ) assume reinvestment of dividends. Past performance does not guarantee future performance. Realty Income presents this data for informational purposes only and makes no representation about its future performance or how it will compare in performance to other indices in the future. |
SOURCE Realty Income Corporation






Share this article