Realty Income Announces Operating Results for the Three Months Ended March 31, 2026

SAN DIEGO, May 6, 2026 /PRNewswire/ -- Realty Income Corporation (Realty Income, NYSE: O), The Monthly Dividend Company®, today announced operating results for the three months ended March 31, 2026. All per share amounts presented in this press release are on a diluted per common share basis unless stated otherwise.
COMPANY HIGHLIGHTS:
For the three months ended March 31, 2026:
- Net income available to common stockholders was $311.8 million, or $0.33 per share
- Adjusted Funds from Operations ("AFFO") per share increased 6.6% to $1.13 per share, compared to the three months ended March 31, 2025
- Invested $2.8 billion; our Pro-Rata Share was $2.6 billion at an initial weighted average cash yield of 7.1%
- Net Debt to Annualized Pro Forma Adjusted EBITDAre was 5.2x
- Achieved a rent recapture rate of 103.4% on properties re-leased
- Formed a strategic partnership with Apollo, with initial investment of $1.0 billion in existing portfolio of retail assets
Events subsequent to March 31, 2026:
- In April 2026, issued $800 million of 4.750% senior unsecured notes due April 2033. In connection with the offering, we executed a $500 million U.S. Dollar-to-Euro 7-year cross currency swap, resulting in approximately €436 million of proceeds and a blended coupon rate of 4.16%.
CEO Comments
"Our first quarter results underscore the strength and resiliency of our global investment and operating platforms. Importantly, we demonstrated significant progress towards a key strategic goal of diversifying our sources of permanent equity beyond the public markets. These new private capital vehicles allow us to grow with deep and stable pockets of capital, enhancing our financial returns for shareholders and expanding our ability to invest in an ever-broadening range of high-quality net lease opportunities and geographies," said Sumit Roy, Realty Income's Chief Executive Officer. "The partnerships with Apollo and GIC, together with the completion of the $1.7 billion cornerstone capital raise for our U.S. Core Plus fund during the quarter, represent very meaningful advancements in our private capital strategy and establish new programmatic capital relationships with leading institutions.
During the quarter, we invested approximately $2.8 billion, $2.6 billion of which was our share, and our pipeline remains very active. As a result, we are increasing our full-year investment guidance to $9.5 billion from $8 billion.
Given the strong momentum across the business, we are increasing our 2026 AFFO per share guidance range to $4.41 to $4.44, reflecting projected annual per share growth of 3.0% to 3.7%. Our outlook is a testament to the unmatched scale, track record and operating capabilities of our global net lease enterprise."
Select Financial Results
The following summarizes our select financial results (dollars in millions, except per share data):
Three months ended |
||||
2026 |
2025 |
|||
Total revenue |
$ |
1,548.7 |
$ |
1,380.5 |
Net income available to common stockholders (1) |
$ |
311.8 |
$ |
249.8 |
Net income per share |
$ |
0.33 |
$ |
0.28 |
Funds from operations available to common stockholders (FFO) (2) |
$ |
993.6 |
$ |
937.7 |
FFO per share |
$ |
1.06 |
$ |
1.05 |
Normalized funds from operations available to common stockholders |
||||
(Normalized FFO) (2) |
$ |
1,004.4 |
$ |
937.9 |
Normalized FFO per share |
$ |
1.07 |
$ |
1.05 |
Adjusted funds from operations available to common stockholders |
||||
(AFFO) (2) |
$ |
1,057.6 |
$ |
949.7 |
AFFO per share |
$ |
1.13 |
$ |
1.06 |
(1) |
The calculation to determine net income available to common stockholders includes provisions for impairment, gain on sales of real estate, and foreign currency gain and loss. These items can vary from quarter to quarter and can significantly impact net income available to common stockholders and period to period comparisons. |
(2) |
FFO, Normalized FFO, and AFFO are non-GAAP financial measures. Normalized FFO is based on FFO and adjusted to exclude merger, transaction, and other costs, net and AFFO further adjusts Normalized FFO for unique revenue and expense items. Please see the Glossary for our definitions and explanations of how we utilize these metrics. Please see pages 9 and 10 herein for reconciliations to the most directly comparable GAAP measure. |
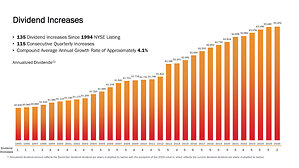
Dividend Increases
In March 2026, we announced the 114th consecutive quarterly dividend increase, which is the 134th increase since our listing on the New York Stock Exchange ("NYSE") in 1994. The annualized dividend amount as of March 31, 2026 was $3.246 per share. The amount of monthly dividends paid per share increased 1.8% to $0.810 in the three months ended March 31, 2026, as compared to $0.796 during the three months ended March 31, 2025, representing 71.7% of our diluted AFFO per share of $1.13 during the three months ended March 31, 2026.
Real Estate Portfolio Update
As of March 31, 2026, we owned or held interests in 15,571 properties, which were leased to 1,786 clients doing business in 92 industries. Our diversified portfolio of commercial properties under long-term, net lease agreements is actively managed with a weighted average remaining lease term of approximately 8.7 years. Our portfolio of commercial real estate has historically provided dependable rental revenue supporting the payment of monthly dividends. As of March 31, 2026, portfolio occupancy was 98.9% with 172 properties available for lease or sale, as compared to 98.9% as of December 31, 2025 and 98.5% as of March 31, 2025. Our property-level occupancy rates exclude properties with ancillary leases only, such as cell towers and billboards, and properties with possession pending, and include properties owned by unconsolidated joint ventures. Below is a summary of our portfolio activity for the period indicated below:
Changes in Occupancy
Three months ended March 31, 2026 |
|
Properties available for lease as of December 31, 2025 |
173 |
Lease expirations (1) |
320 |
Re-leases to same client |
(220) |
Re-leases to new client |
(23) |
Vacant dispositions |
(78) |
Properties available for lease as of March 31, 2026 |
172 |
(1) |
Includes scheduled and unscheduled expirations (including leases rejected in bankruptcy), as well as future expirations resolved in the period indicated above. |
During the three months ended March 31, 2026, the new Annualized Base Rent on re-leased units was $73.3 million, as compared to the previous annual rent of $70.9 million on the same units, representing a rent recapture rate of 103.4% on the re-leased units. Please see the Glossary for our definition of Annualized Base Rent.
Investment Summary
The following table summarizes our investments in the U.S. and Europe for the period indicated below (dollars in millions):
Three months ended March 31, 2026 |
||||||||
Investment |
Pro-Rata |
Weighted |
Number of |
|||||
Acquisitions |
||||||||
U.S. wholly-owned |
$ 372.4 |
$ 372.4 |
10.0 |
83 |
||||
U.S. Core Plus Fund |
171.4 |
65.9 |
9.7 |
21 |
||||
Europe wholly-owned |
756.1 |
756.1 |
5.8 |
42 |
||||
Non-wholly owned(2) |
280.1 |
238.5 |
14.1 |
6 |
||||
Total real estate acquisitions(3) |
$ 1,580.0 |
$ 1,432.9 |
8.3 |
152 |
||||
Initial weighted average cash yield(4) |
6.7 % |
|||||||
Real estate properties under development |
||||||||
U.S. wholly-owned |
$ 30.3 |
$ 30.3 |
17.7 |
19 |
||||
Europe wholly-owned |
34.1 |
34.1 |
14.8 |
8 |
||||
Non-wholly owned(2) |
91.4 |
90.8 |
9.6 |
15 |
||||
Total real estate properties under |
||||||||
development(3) |
$ 155.8 |
$ 155.2 |
12.4 |
42 |
||||
Initial weighted average cash yield(4) |
7.4 % |
|||||||
Other investments(5) |
||||||||
U.S. wholly-owned |
$ 719.8 |
$ 719.8 |
3.6 |
— |
||||
Europe wholly-owned |
251.7 |
251.7 |
3.8 |
— |
||||
Other wholly-owned |
60.0 |
60.0 |
2.0 |
— |
||||
Total other investments |
$ 1,031.5 |
$ 1,031.5 |
3.5 |
— |
||||
Initial weighted average cash yield(4) |
7.8 % |
|||||||
Total investments |
$ 2,767.3 |
$ 2,619.6 |
6.5 |
194 |
||||
Initial weighted average cash yield(4) |
7.1 % |
|||||||
Supplementary Information: |
||||||||
Total U.S. and other volume |
$ 1,333.5 |
|||||||
Initial weighted average cash yield(4) |
7.3 % |
|||||||
Total Europe volume |
$ 1,286.1 |
|||||||
Initial weighted average cash yield(4) |
7.0 % |
|||||||
Investment Grade Clients(6) |
41 % |
|||||||
(1) |
Reflects adjustments for our Pro-Rata Share based on our proportionate economic ownership of our joint ventures (which adds our economic ownership percentage of unconsolidated entities and deducts noncontrolling interests). Please see the Glossary for our definition of Pro-Rata Share for more information. |
(2) |
Non-wholly owned represents U.S. and European investments not 100% owned by Realty Income, excluding the U.S. Core Plus Fund. |
(3) |
For the three months ended March 31, 2026, our clients occupying the new properties are 63.9% retail, 33.6% industrial, and 2.5% other property types based on Cash Income. Please see the Glossary for our definition of Cash Income. |
(4) |
Initial Weighted Average Cash Yield is a supplemental operating measure. Cash Income used in the calculation of Initial Weighted Average Cash Yield for investments for the three months ended March 31, 2026 includes $2.4 million received as settlement credits related to the reimbursement of free rent period. Please see the Glossary for our definitions of Initial Weighted Average Cash Yield and Cash Income. |
(5) |
Represents various loans across the U.S. and Europe as well as construction loans in Mexico related to Realty Income's strategic partnership with GIC. |
(6) |
Represents approximate percentage of annualized cash income generated by investments from Investment Grade Clients at the date of acquisition. Please see the Glossary for our definition of Investment Grade Clients. |
Same Store Rental Revenue
The following summarizes our same store rental revenue for 14,738 properties under lease for the three months ended March 31, 2026 and 2025 (dollars in millions):
Three months ended |
|||||
2026 |
2025 |
% Increase |
|||
Same Store Rental Revenue |
$ 1,192.6 |
$ 1,182.6 |
0.8 % |
||
For purposes of comparability, Same Store Rental Revenue is presented on a constant currency basis using the applicable exchange rate as of March 31, 2026. Same Store Rental Revenue also includes our Pro-Rata Share of rental revenue from properties owned by unconsolidated joint ventures and amounts attributable to noncontrolling interests based on their respective ownership percentages. Please see the Glossary to see definitions of our Same Store Pool and Same Store Rental Revenue.
Property Dispositions The following summarizes our property dispositions (dollars in millions): |
||
Three months ended March 31, 2026 |
||
Properties sold |
97 |
|
Net sales proceeds |
$ |
188.0 |
Gain on sales of real estate |
$ |
35.6 |
Liquidity and Capital Markets
Liquidity
As of March 31, 2026, we had $3.9 billion total available liquidity at our Pro-Rata Share(1), comprised of the components summarized below (dollars in millions):
Cash and cash equivalents (2) |
$ |
388.4 |
Availability under credit facilities (3) |
2,714.0 |
|
Unsettled At-the-Market ("ATM") forwards |
1,218.1 |
|
Less: commercial paper borrowings |
(414.9) |
|
Total available liquidity at our Pro-Rata Share |
$ |
3,905.6 |
(1) |
Please see the Glossary for our definition of Pro-Rata Share for more information. |
(2) |
Reflects adjustments for our share based on our proportionate economic ownership of our joint ventures. Calculated as cash and cash equivalents per the consolidated balance sheet of $373.5 million, plus our Pro-Rata Share of unconsolidated entities cash of $23.6 million, less adjustments allocable to noncontrolling interests of $8.7 million. |
(3) |
Represents our availability under the Realty Income revolving credit facilities ("RI Revolving Credit Facilities") with a total capacity of $4.0 billion and our Pro-Rata Share of availability under the Fund Revolving Credit Facilities with a total capacity of $1.38 billion. |
Capital Raising
As of May 6, 2026, approximately 23.6 million shares of common stock subject to ATM forward sale agreements remain unsettled, of which 2.8 million shares were sold in April 2026, representing approximately $1.4 billion in expected net proceeds and a weighted average initial gross price of $60.33 per share. ATM net sale proceed amounts assume full physical settlement of all outstanding shares of common stock, subject to such forward sale agreements and certain assumptions made with respect to settlement dates.
In April 2026, we issued $800.0 million of 4.750% senior unsecured notes due April 2033 (the "April 2033 Notes"). The public offering price for the April 2033 Notes was 98.261% of the principal amount for an effective yield to maturity of 5.047%. Interest is paid semi-annually. In connection with the issuance, we executed a $500 million U.S. Dollar-to-Euro 7-year cross currency swap, resulting in approximately €436 million of proceeds and an effective fixed-rate, Euro-denominated yield to maturity of approximately 4.07% and coupon rate of 3.81%. On a combined basis, the Notes and related swap resulted in an effective blended yield to maturity of approximately 4.44% and blended coupon rate of 4.16%.
In March 2026, we established our Managed Insurance and Retirement Annuity investment platform as a vehicle to pursue various co-investment opportunities with institutional investors. In connection with this initiative, on March 31, 2026, we closed a $1.0 billion strategic investment from Apollo in exchange for a 49% interest in a newly formed joint venture which owns an existing portfolio of 492 retail properties contributed by the Company.
In March 2026, we closed a $693.9 million unsecured term loan due January 2036 with an affiliate of The Goldman Sachs Group, Inc. at a 4.91% fixed rate and executed a cross-currency swap on $500 million of proceeds for approximately €431 million, achieving an effective blended borrowing rate of 4.34%.
On January 1, 2026, within our U.S. Core Plus Fund, we called $638.0 million of capital from third-party investors and redeemed $408.2 million of the Company's units, resulting in an indirect ownership of 38.5% in the Fund. On April 1, 2026, we called an additional $310.0 million of capital from third-party investors and redeemed $183.8 million of the Company's units, resulting in an indirect ownership of 26.8% in the Fund.
In January 2026, we issued $862.5 million principal amount of 3.500% convertible senior notes due January 2029 in a private offering, resulting in net proceeds of approximately $845.1 million. We used approximately $101.9 million of the net proceeds to repurchase approximately 1.8 million shares of our common stock concurrently with the pricing of the offering.
Guidance
Summarized below are approximate estimates of the key components of our 2026 earnings guidance (with 2026 actual results for comparison):
Revised 2026 |
Prior 2026 |
YTD Actuals at |
|
Net income per share(2) |
$1.60 - $1.63 |
$1.65 - $1.69 |
$0.33 |
Real estate depreciation per share |
$2.65 |
$2.68 |
$0.67 |
Other adjustments per share(3) |
$0.16 |
$0.05 |
$0.13 |
AFFO per share |
$4.41 - $4.44 |
$4.38 - $4.42 |
$1.13 |
Same store rent growth |
1.0% - 1.3% |
1.0% - 1.3% |
0.8 % |
Occupancy |
Approx 98.5% |
Approx 98.5% |
98.9 % |
Cash G&A expenses (% of total gross asset value)(4)(5) |
20 - 23 bps |
20 - 23 bps |
6 bps |
Property expenses (non-reimbursable) (% of total revenue)(6) |
Approx 1.5% |
Approx 1.5% |
1.3 % |
Income tax expenses |
$100 - $110 million |
$100 - $110 million |
$26 million |
Investment volume (at 100%) |
$9.5 billion |
$8.0 billion |
$2.8 billion |
Lease termination income |
$45 - $50 million |
$30 - $40 million |
$40 million |
(1) |
As issued on February 24, 2026. |
(2) |
Net income per share excludes future impairment and foreign currency or derivative gains or losses due to the inherent unpredictability of forecasting these items. |
(3) |
Includes net adjustments for gains or losses on sales of properties, impairments, and merger, transaction, and other non-recurring costs. |
(4) |
Cash G&A represents 'General and administrative' expenses as presented in our consolidated statements of income, less share-based compensation costs. |
(5) |
Please see the Glossary for our definition of Gross Asset Value. |
(6) |
Total revenue excludes client reimbursements. |
Conference Call Information
In conjunction with the release of our operating results, we will host a conference call on May 6, 2026 at 2:00 p.m. PDT to discuss the operating results. To access the conference call, dial (833) 816-1264 (United States) or (412) 317-5632 (International). When prompted, please ask for the Realty Income conference call.
A telephone replay of the conference call can also be accessed by calling (855) 669-9658 (United States) or (412) 317-0088 (International) and entering the conference ID 5227110. The telephone replay will be available through May 13, 2026.
A live webcast will be available in listen-only mode by clicking on the webcast link on the company's home page at www.realtyincome.com. A replay of the conference call webcast will be available approximately one hour after the conclusion of the live broadcast. No access code is required for this replay.
Supplemental Materials
Supplemental Operating and Financial Data for the three months ended March 31, 2026 is available on our corporate website at www.realtyincome.com/investors/quarterly-and-annual-results.
About Realty Income
Realty Income (NYSE: O), an S&P 500 company, is real estate partner to the world's leading companies®. Founded in 1969, we serve our clients as a full-service real estate capital provider. As of March 31, 2026, we have a portfolio of over 15,500 properties in all 50 U.S. states, the United Kingdom ("U.K."), and eight other countries in Europe. We are known as "The Monthly Dividend Company®" and have a mission to invest in people and places to deliver dependable monthly dividends that increase over time. Since our founding, we have declared 670 consecutive monthly dividends and are a member of the S&P 500 Dividend Aristocrats® index for having increased our dividend for over 31 consecutive years. Additional information about the company can be found at www.realtyincome.com. Investors and others should note that we announce material financial and operational information to our investors using our investor relations website (www.realtyincome.com/investors), press releases, SEC filings and public conference calls and webcasts.
Forward-Looking Statements
This press release contains forward-looking statements within the meaning of the Private Securities Litigation Reform Act of 1995, Section 27A of the Securities Act of 1933, as amended, and Section 21E of the Securities Exchange Act of 1934, as amended. When used in this press release, the words "estimate," "anticipate," "assume," "expect," "believe," "intend," "continue," "should," "may," "likely," "plan," "seek," and similar expressions are intended to identify forward-looking statements. Forward-looking statements include discussions of our business, strategy, plans, and the intentions of management; joint ventures, partnerships, and portfolio including management thereof; our platform; growth and capital strategies including our private capital business, investment pipeline and intentions to acquire or dispose of properties (including geographies, timing, partners, clients and terms); re-leases, re-development and speculative development of properties and expenditures related thereto; operations and results; guidance; our share repurchase program; settlement of shares of common stock sold pursuant to forward sale confirmations under our ATM program; dividends, including the amount, timing and payments of dividends; and macroeconomic and other business trends, including interest rates and trends in the market for long-term leases of freestanding, single-client properties. Forward-looking statements are subject to risks, uncertainties, and assumptions about us which may cause our actual future results to differ materially from expected results. Some of the factors that could cause actual results to differ materially are, among others, our continued qualification as a real estate investment trust; general domestic and foreign business, economic, or financial conditions; competition; fluctuating interest and currency rates; inflation and its impact on our clients and us; access to debt and equity capital markets and other sources of funding (including the terms, structure and partners of such funding); volatility and uncertainty in the credit and financial markets; other risks inherent in real estate, private capital, credit and mezzanine investments, and joint ventures or co-investment ventures, including solvency, defaults under leases, bankruptcies, potential liability relating to environmental matters, illiquidity of real estate investments (including rights of first refusal or rights of first offer), and potential damages from natural disasters; impairments in the value of our real estate assets; volatility and changes in domestic and foreign laws and the application, enforcement or interpretation thereof (including with respect to tax laws and rates); property ownership through co-investment ventures, funds, joint ventures, partnerships and other arrangements which, among other things, may transfer or limit our control of the underlying investments; epidemics or pandemics; the loss of key personnel; the threat and outcome of any legal proceedings to which we are a party or which may occur in the future; acts of terrorism and war; and the anticipated benefits from mergers, acquisitions, co-investment ventures, funds, joint ventures, partnerships and other arrangements; and those additional risks and factors discussed in our reports filed with the U.S. Securities and Exchange Commission. Readers are cautioned not to place undue reliance on forward-looking statements. Forward-looking statements are not guarantees of future plans and performance and speak only as of the date of this press release. Past operating results and performance are provided for informational purposes and are not a guarantee of future results. There can be no assurance that historical trends will continue. Actual plans and results may differ materially from what is expressed or forecasted in this press release and forecasts made in the forward-looking statements discussed in this press release may not materialize. We do not undertake any obligation to update forward-looking statements or publicly release the results of any forward-looking statements that may be made to reflect events or circumstances after the date these statements were made or to reflect the occurrence of unanticipated events.
CONSOLIDATED STATEMENTS OF INCOME (in thousands, except per share amounts) (unaudited)
|
||||
Three months ended March 31, |
||||
2026 |
2025 |
|||
REVENUE |
||||
Rental (including reimbursements) (1) |
$ |
1,440,817 |
$ |
1,313,057 |
Interest income on financing receivables |
32,130 |
32,635 |
||
Interest and dividend income on loans and preferred equity investments |
70,110 |
34,736 |
||
Other |
5,670 |
77 |
||
Total revenue |
1,548,727 |
1,380,505 |
||
EXPENSES |
||||
Depreciation and amortization |
630,275 |
608,935 |
||
Interest |
291,940 |
268,374 |
||
Property (including reimbursements) |
116,843 |
106,681 |
||
General and administrative |
58,885 |
44,044 |
||
Provisions for impairment |
129,268 |
116,589 |
||
Merger, transaction, and other costs, net |
10,787 |
279 |
||
Total expenses |
1,237,998 |
1,144,902 |
||
Gain on sales of real estate |
35,642 |
22,537 |
||
Foreign currency and derivative loss, net |
(17,020) |
(2,545) |
||
Equity in earnings of unconsolidated entities |
2,669 |
4,357 |
||
Other income, net |
15,110 |
7,167 |
||
Income before income taxes |
347,130 |
267,119 |
||
Income taxes |
(26,195) |
(15,657) |
||
Net income |
320,935 |
251,462 |
||
Net income attributable to noncontrolling interests |
(9,169) |
(1,647) |
||
Net income available to common stockholders |
$ |
311,766 |
$ |
249,815 |
Funds from operations available to common stockholders (FFO) |
$ |
993,601 |
$ |
937,655 |
Normalized funds from operations available to common stockholders (Normalized FFO) |
$ |
1,004,388 |
$ |
937,934 |
Adjusted funds from operations available to common stockholders (AFFO) |
$ |
1,057,553 |
$ |
949,716 |
Amounts available to common stockholders per common share: |
||||
Net income per common share, basic and diluted |
$ |
0.33 |
$ |
0.28 |
FFO per common share: |
||||
Basic |
$ |
1.07 |
$ |
1.05 |
Diluted |
$ |
1.06 |
$ |
1.05 |
Normalized FFO per common share: |
||||
Basic |
$ |
1.08 |
$ |
1.05 |
Diluted |
$ |
1.07 |
$ |
1.05 |
AFFO per common share: |
||||
Basic |
$ |
1.13 |
$ |
1.07 |
Diluted |
$ |
1.13 |
$ |
1.06 |
Cash dividends paid per common share |
$ |
0.8100 |
$ |
0.7960 |
(1) |
Includes client reimbursements of $97.5 million and $87.4 million for the three months ended March 31, 2026 and 2025, respectively; reserves to rental revenue, exclusive of non-cash reserves, of $6.4 million and $6.2 million for the three months ended March 31, 2026 and 2025, respectively. |
FUNDS FROM OPERATIONS (FFO) AND NORMALIZED FUNDS FROM OPERATIONS (Normalized FFO) (in thousands, except per share amounts) (unaudited)
|
||||
FFO and Normalized FFO are non-GAAP financial measures. Please see the Glossary for our definitions and |
||||
Three months ended |
||||
2026 |
2025 |
|||
Net income available to common stockholders |
$ |
311,766 |
$ |
249,815 |
Depreciation and amortization |
630,275 |
608,935 |
||
Depreciation of furniture, fixtures and equipment |
(787) |
(538) |
||
Provisions for impairment of real estate |
90,165 |
97,418 |
||
Gain on sales of real estate |
(35,642) |
(22,537) |
||
Proportionate share of adjustments for unconsolidated entities |
9,478 |
6,255 |
||
FFO adjustments allocable to noncontrolling interests |
(11,654) |
(1,693) |
||
FFO available to common stockholders |
$ |
993,601 |
$ |
937,655 |
FFO allocable to dilutive noncontrolling interests |
2,033 |
2,425 |
||
Diluted FFO |
$ |
995,634 |
$ |
940,080 |
FFO available to common stockholders |
$ |
993,601 |
$ |
937,655 |
Merger, transaction, and other costs, net (1) |
10,787 |
279 |
||
Normalized FFO available to common stockholders |
$ |
1,004,388 |
$ |
937,934 |
Normalized FFO allocable to dilutive noncontrolling interests |
2,033 |
2,425 |
||
Diluted Normalized FFO |
$ |
1,006,421 |
$ |
940,359 |
FFO per common share: |
||||
Basic |
$ |
1.07 |
$ |
1.05 |
Diluted |
$ |
1.06 |
$ |
1.05 |
Normalized FFO per common share: |
||||
Basic |
$ |
1.08 |
$ |
1.05 |
Diluted |
$ |
1.07 |
$ |
1.05 |
Distributions paid to common stockholders |
$ |
758,032 |
$ |
711,824 |
FFO after distributions |
$ |
235,569 |
$ |
225,831 |
Normalized FFO after distributions |
$ |
246,356 |
$ |
226,110 |
Weighted average number of common shares used for FFO and Normalized FFO: |
||||
Basic |
931,977 |
891,666 |
||
Diluted |
937,128 |
895,033 |
||
(1) |
During the three months ended March 31, 2026, we incurred $10.8 million of merger, transaction, and other costs, net, primarily consisting of costs incurred directly attributable to acquisitions during the quarter and placement fees incurred in fundraising for the U.S. Core Plus Fund. |
ADJUSTED FUNDS FROM OPERATIONS (AFFO) (in thousands, except per share amounts) (unaudited)
|
||||
AFFO is a non-GAAP financial measure. Please see the Glossary for our definition and an explanation of how we utilize this metric.
|
||||
Three months ended March 31, |
||||
2026 |
2025 |
|||
Net income available to common stockholders |
$ |
311,766 |
$ |
249,815 |
Cumulative adjustments to calculate Normalized FFO (1) |
692,622 |
688,119 |
||
Normalized FFO available to common stockholders |
1,004,388 |
937,934 |
||
Debt-related non-cash items: |
||||
Amortization of net debt discounts and deferred financing costs |
15,378 |
6,633 |
||
Amortization of acquired interest rate swap value (2) |
1,531 |
3,711 |
||
Capital expenditures from operating properties: |
||||
Leasing costs and commissions |
(1,354) |
(880) |
||
Recurring capital expenditures |
(170) |
(19) |
||
Other non-cash items: |
||||
Non-cash change in allowance for credit losses |
39,103 |
19,171 |
||
Amortization of share-based compensation |
11,383 |
5,899 |
||
Straight-line rent and expenses, net |
(39,510) |
(43,812) |
||
Amortization of above and below-market leases, net |
13,880 |
15,326 |
||
Deferred tax expense (benefit) |
1,437 |
(104) |
||
Proportionate share of adjustments for unconsolidated entities |
(454) |
37 |
||
Executive severance charge (3) |
1,591 |
— |
||
Other adjustments (4) |
10,350 |
5,820 |
||
AFFO available to common stockholders |
$ |
1,057,553 |
$ |
949,716 |
AFFO allocable to dilutive noncontrolling interests |
2,434 |
2,401 |
||
Diluted AFFO |
$ |
1,059,987 |
$ |
952,117 |
AFFO per common share: |
||||
Basic |
$ |
1.13 |
$ |
1.07 |
Diluted |
$ |
1.13 |
$ |
1.06 |
Distributions paid to common stockholders |
$ |
758,032 |
$ |
711,824 |
AFFO after distributions |
$ |
299,521 |
$ |
237,892 |
Weighted average number of common shares used for AFFO: |
||||
Basic |
931,977 |
891,666 |
||
Diluted |
937,128 |
895,033 |
||
(1) |
See Normalized FFO calculations on page 9 for reconciling items. |
(2) |
Includes the amortization of the purchase price allocated to interest rate swaps acquired in our merger with Spirit Realty Capital, Inc. |
(3) |
The executive severance charge reflects certain benefits related to our Chief Legal Officer's expected departure in September 2026. |
(4) |
Includes primarily non-cash foreign currency losses (gains) from remeasurement to USD, mark-to-market adjustments on investments and derivatives that are non-cash in nature, obligations related to financing lease liabilities, and adjustments allocable to noncontrolling interests. |
HISTORICAL FFO AND AFFO (in thousands, except per share amounts) (unaudited)
|
|||||
For the three months ended March 31, |
2026 |
2025 |
2024 |
2023 |
2022 |
Net income available to common stockholders |
$ 311,766 |
$ 249,815 |
$ 129,696 |
$ 225,016 |
$ 199,369 |
Depreciation and amortization, net of furniture, fixtures |
|||||
and equipment |
629,488 |
608,397 |
580,441 |
450,935 |
403,284 |
Provisions for impairment of real estate |
90,165 |
97,418 |
88,197 |
13,178 |
7,038 |
Gain on sales of real estate |
(35,642) |
(22,537) |
(16,574) |
(4,279) |
(10,156) |
Proportionate share of adjustments for unconsolidated |
|||||
entities |
9,478 |
6,255 |
4,674 |
— |
2,235 |
FFO adjustments allocable to noncontrolling interests |
(11,654) |
(1,693) |
(751) |
(559) |
(354) |
FFO available to common stockholders |
$ 993,601 |
$ 937,655 |
$ 785,683 |
$ 684,291 |
$ 601,416 |
Merger, transaction, and other costs, net |
10,787 |
279 |
94,104 |
1,307 |
6,519 |
Normalized FFO available to common stockholders |
$ 1,004,388 |
$ 937,934 |
$ 879,787 |
$ 685,598 |
$ 607,935 |
FFO per diluted share |
$ 1.06 |
$ 1.05 |
$ 0.94 |
$ 1.03 |
$ 1.01 |
Normalized FFO per diluted share |
$ 1.07 |
$ 1.05 |
$ 1.05 |
$ 1.04 |
$ 1.02 |
AFFO available to common stockholders |
$ 1,057,553 |
$ 949,716 |
$ 862,871 |
$ 650,728 |
$ 580,098 |
AFFO per diluted share |
$ 1.13 |
$ 1.06 |
$ 1.03 |
$ 0.98 |
$ 0.98 |
Cash dividends paid per common share |
$ 0.8100 |
$ 0.7960 |
$ 0.7695 |
$ 0.7515 |
$ 0.7395 |
Weighted average diluted shares outstanding - FFO, Normalized FFO, and AFFO |
937,128 |
895,033 |
837,037 |
663,034 |
595,103 |
ADJUSTED EBITDAre (dollars in thousands) (unaudited)
|
||
Adjusted EBITDAre, Annualized Adjusted EBITDAre, Annualized Pro Forma Adjusted EBITDAre, and Net Debt/Annualized Pro Forma Adjusted EBITDAre are non-GAAP financial measures. Please see the Glossary for our definition and an explanation of how we utilize these metrics. |
||
Three months ended |
||
2026 |
||
Net income |
$ |
320,935 |
Interest |
291,940 |
|
Income taxes |
26,195 |
|
Depreciation and amortization |
630,275 |
|
Executive severance charge (1) |
1,591 |
|
Provisions for impairment |
129,268 |
|
Merger, transaction, and other costs, net |
10,787 |
|
Gain on sales of real estate |
(35,642) |
|
Foreign currency and derivative loss, net |
17,020 |
|
Equity in earnings of unconsolidated entities |
(2,669) |
|
Adjusted EBITDAre |
$ |
1,389,700 |
Annualized Adjusted EBITDAre (2) |
$ |
5,558,800 |
Annualized Pro Forma Adjustments |
$ |
143,520 |
Annualized Pro Forma Adjusted EBITDAre |
$ |
5,702,320 |
Total debt per the consolidated balance sheet, excluding deferred financing costs and net discounts |
$ |
29,958,566 |
Less: Cash and cash equivalents |
(373,543) |
|
Net Debt (3) |
$ |
29,585,023 |
Net Debt/Annualized Pro Forma Adjusted EBITDAre |
5.2x |
|
(1) |
The executive severance charge reflects certain benefits related to our Chief Legal Officer's expected departure in September 2026. |
(2) |
We calculate Annualized Adjusted EBITDAre by multiplying the Adjusted EBITDAre for the applicable quarter by four. |
(3) |
Net Debt is total debt, excluding deferred financing costs and net discounts, less consolidated cash and cash equivalents. |
The Annualized Pro Forma Adjustments, which include transaction accounting adjustments in accordance with U.S. GAAP, consist of adjustments to incorporate Adjusted EBITDAre from investments we acquired or stabilized during the applicable quarter and Adjusted EBITDAre from investments we disposed of during the applicable quarter, giving pro forma effect to all transactions as if they occurred at the beginning of the applicable quarter. Our calculation includes all adjustments consistent with the requirements to present Adjusted EBITDAre on a pro forma basis in accordance with Article 11 of Regulation S-X. The following table summarizes our Annualized Pro Forma Adjustments related to our Annualized Pro Forma Adjusted EBITDAre calculation for the period indicated below (in thousands):
Three months ended |
||
2026 |
||
Annualized pro forma adjustments from investments acquired or stabilized |
$ |
155,758 |
Annualized pro forma adjustments from investments disposed |
(12,238) |
|
Annualized Pro Forma Adjustments |
$ |
143,520 |
Adjusted Free Cash Flow (in thousands) (unaudited)
|
||||
Adjusted Free Cash Flow and Annualized Adjusted Free Cash Flow are non-GAAP financial measures. Please see the |
||||
Three months ended March 31, |
||||
2026 |
2025 |
|||
Net cash provided by operating activities |
$ |
874,502 |
$ |
787,516 |
Changes in net working capital |
154,324 |
153,834 |
||
Capital expenditures (1) |
(25,237) |
(16,181) |
||
Distributions paid to common stockholders |
(758,032) |
(711,824) |
||
Distributions paid to noncontrolling interests |
(10,951) |
(2,999) |
||
Merger, transaction, and other costs, net |
10,787 |
279 |
||
Adjusted Free Cash Flow |
$ |
245,393 |
$ |
210,625 |
Annualized Adjusted Free Cash Flow |
$ |
981,572 |
$ |
842,500 |
(1) Excludes capital expenditures which directly generate incremental rental revenue on our leases. |
| Reconciliation of Same Store Rental Revenue to Rental Revenue (Including Reimbursements) (in thousands) (unaudited)
|
||||
Same store rental revenue is a non-GAAP financial measure. Please see the Glossary for our definition and an |
||||
Three months ended March 31, |
||||
2026 |
2025 |
|||
Rental revenue (including reimbursements) |
$ |
1,440,817 |
$ |
1,313,057 |
Constant currency adjustment (1) |
(5,106) |
11,324 |
||
Straight-line rent and other non-cash adjustments |
(41) |
(976) |
||
Contractually obligated reimbursements by our clients |
(95,320) |
(86,951) |
||
Revenue from excluded properties (2) |
(106,201) |
(55,408) |
||
Other excluded revenue (3) |
(40,326) |
(1,398) |
||
Revenue from unconsolidated entities (4) |
26,771 |
25,759 |
||
Revenue attributable to noncontrolling interests (5) |
(28,011) |
(22,849) |
||
Same Store Rental Revenue |
$ |
1,192,583 |
$ |
1,182,558 |
(1) |
For purposes of comparability, Same Store Rental Revenue is presented on a constant currency basis using the applicable exchange rate as of March 31, 2026. |
(2) |
Please see the Glossary for our definitions of Same Store Pool and Same Store Rental Revenue. |
(3) |
"Other excluded revenue" primarily consists of reimbursements related to lease termination fees and other settlement income. |
(4) |
Represents our Pro-Rata Share of rental revenue from properties owned by unconsolidated joint ventures. |
(5) |
Represents the portion of rental revenue attributable to noncontrolling interest based on their pro-rata ownership. |
CONSOLIDATED BALANCE SHEETS (in thousands, except per share amounts) (unaudited)
|
||||
March 31, 2026 |
December 31, 2025 |
|||
ASSETS |
||||
Real estate held for investment, at cost: |
||||
Land |
$ |
18,628,769 |
$ |
18,368,029 |
Buildings and improvements |
44,464,843 |
43,824,410 |
||
Total real estate held for investment, at cost |
63,093,612 |
62,192,439 |
||
Less accumulated depreciation and amortization |
(9,092,291) |
(8,778,536) |
||
Real estate held for investment, net |
54,001,321 |
53,413,903 |
||
Real estate and lease intangibles held for sale, net |
139,939 |
91,784 |
||
Cash and cash equivalents |
373,543 |
434,842 |
||
Accounts receivable, net |
1,117,143 |
1,053,487 |
||
Lease intangible assets, net |
5,648,504 |
5,717,241 |
||
Goodwill |
4,932,199 |
4,932,199 |
||
Investment in unconsolidated entities |
1,320,826 |
1,256,456 |
||
Other assets, net |
7,021,229 |
5,895,700 |
||
Total assets |
$ |
74,554,704 |
$ |
72,795,612 |
LIABILITIES AND EQUITY |
||||
Distributions payable |
$ |
254,736 |
$ |
255,171 |
Accounts payable and accrued expenses |
953,204 |
1,060,969 |
||
Lease intangible liabilities, net |
1,478,512 |
1,493,958 |
||
Other liabilities |
1,003,644 |
1,066,809 |
||
Revolving credit facilities and commercial paper |
2,309,059 |
2,023,414 |
||
Term loans, net |
2,370,548 |
1,701,615 |
||
Mortgages payable, net |
37,420 |
37,761 |
||
Notes payable, net |
24,911,912 |
25,031,947 |
||
Total liabilities |
$ |
33,319,035 |
$ |
32,671,644 |
Stockholders' equity: |
||||
Common stock and paid in capital, par value $0.01 per share, 1,300,000 shares authorized, 932,474 and 933,975 shares issued and outstanding as of March 31, 2026 and December 31, 2025, respectively |
$ |
49,984,064 |
$ |
49,861,660 |
Distributions in excess of net income |
(10,973,813) |
(10,527,984) |
||
Accumulated other comprehensive income |
137,234 |
105,019 |
||
Total stockholders' equity |
$ |
39,147,485 |
$ |
39,438,695 |
Noncontrolling interests |
2,088,184 |
685,273 |
||
Total equity |
$ |
41,235,669 |
$ |
40,123,968 |
Total liabilities and equity |
$ |
74,554,704 |
$ |
72,795,612 |
GLOSSARY
Adjusted EBITDAre. The National Association of Real Estate Investment Trusts ("Nareit") established an EBITDA metric for real estate companies (i.e., EBITDA for real estate, or EBITDAre) it believed would provide investors with a consistent measure to help make investment decisions among certain REITs. Our definition of "Adjusted EBITDAre" is generally consistent with the Nareit definition, other than our adjustment to remove foreign currency and derivative gain and loss and merger, transaction, and other costs, net. We define Adjusted EBITDAre, a non-GAAP financial measure, for the most recent quarter as earnings (net income) before (i) interest expense, (ii) income taxes, (iii) depreciation and amortization, (iv) executive severance charge, (v) provisions for impairment, (vi) merger, transaction, and other costs, net, (vii) gain on sales of real estate, (viii) foreign currency and derivative gain and loss, net, and (ix) equity in earnings of unconsolidated entities. Our Adjusted EBITDAre may not be comparable to Adjusted EBITDAre reported by other companies or as defined by Nareit, and other companies may interpret or define Adjusted EBITDAre differently than we do. Management believes Adjusted EBITDAre to be a meaningful measure of a REIT's performance because it provides a view of our operating performance, analyzes our ability to meet interest payment obligations before the effects of income tax, depreciation and amortization expense, provisions for impairment, gain on sales of real estate and other items, as defined above, that affect comparability, including the removal of non-recurring and non-cash items that industry observers believe are less relevant to evaluating the operating performance of a company. In addition, EBITDAre is widely followed by industry analysts, lenders, investors, rating agencies, and others as a means of evaluating the operating performance of business activities prior to servicing debt obligations. Adjusted EBITDAre should be considered along with, but not as an alternative to, net income as a measure of our operating performance.
Adjusted Free Cash Flow, a non-GAAP financial measure, is defined as net cash provided by operating activities, less certain capital expenditures, distributions paid to common stockholders and noncontrolling interests, merger, transaction, and other costs, net, and changes in net working capital. We believe adjusted free cash flow to be a useful liquidity measure for us and our investors by helping to evaluate our ability to generate cash beyond what is needed to fund capital expenditures, debt service and other obligations. Notwithstanding cash on hand and incremental borrowing capacity, adjusted free cash flow reflects our ability to grow our business through investments and acquisitions, as well as our ability to return cash to shareholders through dividends. Adjusted free cash flow is not considered under generally accepted accounting principles to be a primary measure of an entity's residual cash flow available for discretionary spending, and accordingly should not be considered an alternative to operating income, net income, or amounts shown in our consolidated statements of cash flows.
Adjusted Funds From Operations (AFFO), a non-GAAP financial measure, is defined as FFO adjusted for unique revenue and expense items, which we believe are not as pertinent to the measurement of our ongoing operating performance. Most companies in our industry use a similar measurement to AFFO, but they may use the term "CAD" (for Cash Available for Distribution) or "FAD" (for Funds Available for Distribution). We believe AFFO provides useful information to investors because it is a widely accepted industry measure of the operating performance of real estate companies used by the investment community. In particular, AFFO provides an additional measure to compare the operating performance of different REITs without having to account for differing depreciation assumptions and other unique revenue and expense items which are not pertinent to measuring a particular company's ongoing operating performance. Therefore, we believe that AFFO is an appropriate supplemental performance metric, and that the most appropriate GAAP performance metric to which AFFO should be reconciled is net income available to common stockholders.
Annualized Adjusted EBITDAre, a non-GAAP financial measure, is calculated by multiplying Adjusted EBITDAre for the applicable quarter by four. Management believes the use of an Annualized Adjusted EBITDAre metric is meaningful because it represents our run rate operating performance for the period presented.
Annualized Adjusted Free Cash Flow, a non-GAAP financial measure, is calculated by annualizing Adjusted Free Cash Flow.
Annualized Base Rent represents our Pro-Rata Share of contractual monthly base rent for all leases in place and exchange rates as of the balance sheet date, multiplied by 12, and excludes percentage rent and income on loans and preferred equity investments. If there is a rent abatement, we annualize the first monthly contractual base rent following the free rent period. Total annualized base rent has not been reduced to reflect reserves recorded as reductions to GAAP rental revenue in the periods presented. We believe total annualized base rent is a useful supplemental operating measure, as it excludes properties that were no longer owned at the balance sheet date and includes the annualized rent from properties acquired during the quarter.
Annualized Pro Forma Adjusted EBITDAre, a non-GAAP financial measure, is defined as Annualized Adjusted EBITDAre, which includes transaction accounting adjustments in accordance with U.S. GAAP, adjusted to incorporate Adjusted EBITDAre from investments we acquired or stabilized during the applicable quarter and Adjusted EBITDAre from investments we disposed of during the applicable quarter, giving pro forma effect to all transactions as if they occurred at the beginning of the applicable quarter. Our calculation includes all adjustments consistent with the requirements to present Annualized Adjusted EBITDAre on a pro forma basis in accordance with Article 11 of Regulation S-X. The ratio of our net debt to our Annualized Pro Forma Adjusted EBITDAre is also used to determine the vesting of performance share awards granted to our executive officers.
Cash Income represents expected rent for real estate acquisitions as well as rent to be received upon completion of the properties under development. For unconsolidated entities and consolidated entities with noncontrolling interests, this represents our Pro-Rata Share of the cash income. For loans receivable and preferred equity investments, this represents earned interest income and preferred dividend income, respectively.
Funds From Operations (FFO), a non-GAAP financial measure, consistent with the Nareit definition, is net income available to common stockholders, plus depreciation and amortization of real estate assets, plus provisions for impairments of depreciable real estate assets, and reduced by gain on property sales. Presentation of the information regarding FFO and AFFO is intended to assist the reader in comparing the operating performance of different REITs, although it should be noted that not all REITs calculate FFO and AFFO in the same way, so comparisons with other REITs may not be meaningful. FFO and AFFO should not be considered alternatives to reviewing our cash flows from operating, investing, and financing activities. In addition, FFO and AFFO should not be considered measures of liquidity, of our ability to make cash distributions, or of our ability to pay interest payments. We consider FFO to be an appropriate supplemental measure of a REIT's operating performance as it is based on a net income analysis of property portfolio performance that adds back items such as depreciation and impairments for FFO. The historical accounting convention used for real estate assets requires straight-line depreciation of buildings and improvements, which implies that the value of real estate assets diminishes predictably over time. Since real estate values historically rise and fall with market conditions, presentations of operating results for a REIT using historical accounting for depreciation could be less informative. The use of FFO is recommended by the REIT industry as a supplemental performance measure. In addition, FFO is used as a measure of our compliance with the financial covenants of our credit facility.
Gross Asset Value is total assets before accumulated depreciation and amortization.
Initial Weighted Average Cash Yield for acquisitions and properties under development is computed as Cash Income for the first twelve months following the acquisition date, divided by the total cost of the property (including all expenses borne by us), and includes our Pro-Rata Share of Cash Income from unconsolidated joint ventures and consolidated entities with noncontrolling interests. Initial weighted average cash yield for loans receivable and preferred equity investments is computed using the Cash Income for the first twelve months following the acquisition date, divided by the total cost of the investment.
Investment Grade Clients are our clients, our clients that are subsidiaries or affiliates of companies, and credit investments secured with a real estate property leased to a tenant, that as of the balance sheet date, have a credit rating of Baa3/BBB- or higher from one of the three major rating agencies (Moody's/S&P/Fitch).
Net Debt/Annualized Pro Forma Adjusted EBITDAre, a ratio used by management as a measure of leverage, is calculated as net debt (which we define as total debt, excluding deferred financing costs and net discounts, less cash and cash equivalents), divided by Annualized Pro Forma Adjusted EBITDAre.
Normalized Funds from Operations Available to Common Stockholders (Normalized FFO), a non-GAAP financial measure, is FFO excluding merger, transaction, and other costs, net.
Pro-Rata Share represents our proportionate economic ownership of our joint ventures, which is derived by applying our economic ownership percentage of each such joint venture to calculate our proportionate share of the relevant line item information being presented, and aggregating that information for all such joint ventures. For balance sheet information and other capital-based metrics, we apply our economic ownership percentage as of the end of the applicable period being presented, and for activity- and earnings-based metrics, we apply our weighted average economic ownership percentage for the applicable period being presented, unless otherwise specified.
We believe this form of presentation offers insights into the financial performance and condition of our company as a whole, given the significance of our joint ventures that are accounted for either under the equity method or consolidated with the third parties' share included in noncontrolling interest, although the presentation of such information may not accurately depict the legal and economic implications of holding a noncontrolling interest in the joint venture. We do not control the unconsolidated joint ventures in which we are invested for purposes of GAAP and do not represent legal claim to such items.
The operating agreements of the joint ventures may contain provisions that would cause us to receive a different economic percentage of distributions from the joint venture under certain circumstances, such as the amount of capital contributed by each investor and whether any contributions are entitled to priority distributions. Similarly, upon a liquidation of any such joint venture, subject to the applicable terms of the operating agreement of such joint venture, we generally would be entitled to the applicable percentage of residual cash or other assets that remain only after repayment of all liabilities, priority distributions, and initial equity contributions. In addition, the economic interests in any joint venture may be different than our other legal interests or rights in such joint venture.
We provide pro-rata financial information because we believe it assists investors and analysts in estimating our economic interest in our joint ventures when read in conjunction with our reported results under GAAP. Other companies may calculate their proportionate interest differently than we do, limiting the usefulness as a comparative measure. Due to these limitations, the non-GAAP pro-rata financial information should not be considered in isolation or as a substitute for our consolidated financial statements as reported under GAAP.
Same Store Pool, for purposes of determining the properties used to calculate our same store rental revenue, includes all properties that we owned for the entire year-to-date period, for both the current and prior year except for properties during the current or prior year that were: (i) vacant at any time, (ii) under development or redevelopment, or (iii) involved in eminent domain and rent was reduced.
Same Store Rental Revenue excludes straight-line rent, the amortization of above and below-market leases, and reimbursements from clients for recoverable real estate taxes and operating expenses. For purposes of comparability, same store rental revenue is presented on a constant currency basis by applying the exchange rate as of the balance sheet date to base currency rental revenue. We present same store rental revenue on a pro-rata basis to account for our share of same store rental revenue related to unconsolidated and consolidated joint ventures. For purposes of comparability, we calculate our Pro-Rata Share using our ownership percentage as of March 31, 2026 to same store rental revenue throughout the three months ended period in both 2025 and 2026.
SOURCE Realty Income Corporation


Share this article