Aritzia Reports Second Quarter Fiscal 2020 Financial Results
Net Revenue Increased 17.4%
Comparable Sales Increased 8.4%
Adjusted EBITDA Increased 10.1%
Net Income Increased 18.6%
VANCOUVER, Oct. 15, 2019 /PRNewswire/ - Aritzia Inc. ("Aritzia" or the "Company") (TSX: ATZ), a vertically integrated, innovative design house of exclusive fashion brands, today announced financial results for the second quarter of fiscal 2020.

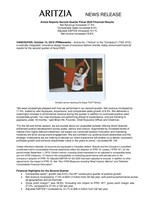
"We were exceedingly pleased with how we performed in our second quarter. Net revenue increased by 17.4%, fueled by new boutiques, expansions, and comparable sales growth of 8.4%. We delivered a meaningful increase in eCommerce revenue during the quarter in addition to continued positive retail comparable growth. Our new boutiques are performing ahead of expectations, and are trending to paybacks under 18 months," said Brian Hill, Founder, Chief Executive Officer and Chairman.
"For the fall and winter season, we are excited about our expanded outwear offering which features enhanced product development across styles, fabrics and colours. Augmented by increased levels of interest from highly relevant celebrities, we expect our continued product innovation and marketing initiatives will drive strong brand engagement. We are confident our growing brand awareness and the strategic investments we are making to elevate our client experience will enable us to deliver consistent, profitable growth and enhance shareholder value in the years to come," concluded Mr. Hill.
Unless otherwise indicated, all amounts are expressed in Canadian dollars. Results and the Company's unaudited condensed interim consolidated financial statements reflect the adoption of IFRS 16, Leases ("IFRS 16"), for the period ended September 1, 2019. Certain metrics, including those expressed on an adjusted or comparable basis, are non-IFRS measures. To improve the comparability of underlying performance with periods prior to the Company's adoption of IFRS 16, Adjusted EBITDA for Q2 2020 has been adjusted to exclude, in addition to other adjustments, the impact of IFRS 16. See "Non-IFRS Measures including Retail Industry Metrics" and "Selected Consolidated Financial Information".
Financial Highlights for the Second Quarter
- Comparable sales(1) growth was 8.4%, the 20th consecutive quarter of positive growth
- Net revenue increased by 17.4% to $241.2 million from Q2 last year, with positive performance across all geographies and all channels
- Gross profit margin(1) was 39.6%. Excluding the impact of IFRS 16(2), gross profit margin was 37.2%, compared to 37.4% in Q2 last year
- Adjusted EBITDA(1) increased by 10.1% to $36.4 million from Q2 last year
- Net income increased by 18.6% to $17.9 million from Q2 last year
- Adjusted Net Income(1) increased by 8.0% to $19.8 million from Q2 last year
- Adjusted Net Income per diluted share(1) increased by 12.5% to $0.18 from Q2 last year
Strategic Accomplishments for the Second Quarter
- Expanded boutique network with the opening of Mall of America in Minneapolis, Minnesota
- Achieved meaningful eCommerce revenue growth through increases in both traffic and transactions in Canada and the U.S.
- Advanced influencer marketing and VIP programs designed to accelerate brand awareness, particularly in the U.S.
- Initiated development of integrated and expansive digital platform to enhance the client experience in partnership with SAP
Financial Results for the Second Quarter
All comparative figures below are for the 13-week period ended September 1, 2019, compared to the 13-week period ended August 26, 2018.
Net revenue increased by 17.4% to $241.2 million compared to $205.4 million in the second quarter last year. Comparable sales(1) growth of 8.4% was driven by momentum in the Company's eCommerce business as well as positive performance across the Company's boutique network. Net revenue growth also reflects the addition of four new boutiques and two expanded or repositioned boutiques since the second quarter of fiscal 2019. In addition, the Company's annual warehouse sale contributed low single digit percentage growth to net revenue in the second quarter this year. The Company's annual warehouse sale occurred in the third quarter last year.
Gross profit increased by 24.4% to $95.4 million. Excluding the impact of IFRS 16(2), gross profit increased by 16.9% to $89.7 million compared to $76.7 million in the second quarter last year. Gross profit margin, excluding the impact of IFRS 16(2), decreased 20 basis points to 37.2% compared to 37.4% in the second quarter last year. Leverage from occupancy costs, a higher mix of exclusive brand product and improvements from ongoing sourcing initiatives were partially offset by markdowns associated with higher-than-usual levels of spring/summer inventory and the weakening of the Canadian dollar. In addition, gross profit margin in the second quarter this year was marginally negatively impacted by the shift in timing of the annual warehouse sale.
Selling, general and administrative ("SG&A") expenses increased by 14.7% to $60.6 million. Excluding the impact of IFRS 16(2), SG&A expenses increased by 14.8% to $60.7 million compared to $52.8 million in the second quarter last year. Excluding the impact of IFRS 16(2), SG&A expenses were 25.2% of net revenue. The decrease of 50 basis points from the second quarter of last year is primarily due to leverage on SG&A expenses and timing of marketing spend, partially offset by investments in the Company's digital client experience platform.
Other expenses were $0.7 million compared to other (income) of ($0.9) million in the second quarter last year. Other expenses this quarter primarily relate to unrealized and realized operational foreign exchange losses of $0.9 million, partially offset by interest income of ($0.1) million. Other (income) in the prior year primarily related to realized foreign exchange gains on the settlement of U.S. dollar forward contracts of ($1.5) million and interest income of ($0.3) million, partially offset by unrealized foreign exchange losses on U.S. dollar forward contracts of $1.0 million.
Adjusted EBITDA(1) increased by 10.1% to $36.4 million, or 15.1% of net revenue, compared to $33.0 million, or 16.1% of net revenue, in the second quarter last year. Adjusted EBITDA excludes the favorable impact of IFRS 16, stock-based compensation expense, unrealized foreign exchange losses on U.S. dollar forward contracts and secondary offering transaction costs. Adjusted EBITDA in the second quarter this year was negatively impacted by $0.7 million of other expenses, compared to a benefit of ($1.9) million of other (income) in the second quarter last year.
Net income increased by 18.6% to $17.9 million, compared to net income of $15.1 million in the second quarter last year. The increase in net income during the quarter was primarily driven by the factors described above.
Adjusted Net Income(1) increased by 8.0% to $19.8 million compared to $18.3 million in the second quarter last year. Adjusted Net Income excludes the impact of stock-based compensation expense, unrealized foreign exchange losses on U.S. dollar forward contracts and secondary offering transaction costs, net of related tax effects. Adjusted Net Income in the second quarter this year was negatively impacted by $0.7 million of other expenses, net of related tax effects, compared to a benefit of ($1.9) million of other (income), net of related tax effects in the second quarter last year.
Adjusted Net Income per diluted share(1) increased by 12.5% to $0.18 from $0.16 in the second quarter last year.
Cash and cash equivalents at the end of the second quarter totaled $30.0 million, compared to $55.0 million at the end of the second quarter last year. Since the end of the second quarter last year, the Company used free cash flow to repurchase $107.0 million of subordinate and multiple voting shares concurrent with the March 2019 Secondary Offering and repurchase $5.6 million in subordinate voting shares for cancellation under its prior normal course issuer bid, which was suspended in March 2019. The Company had $20.0 million drawn on its revolving line of credit at the end of the second quarter.
Inventory at end of the second quarter was $136.5 million, compared to $112.1 million at the end of the second quarter last year. The increase reflects the growth in our business and strategic investments made in outerwear for our fall/winter season. Inventory at the end of the second quarter represented an increase of 21.8% year over year.
Year-to-Date Results
All comparative figures below are for the 26-week period ended September 1, 2019, compared to the 26-week period ended August 26, 2018.
Net revenue increased by 17.6% to $437.9 million from $372.4 million in the prior year. Comparable sales(1) growth of 8.2% was driven by momentum in the Company's eCommerce business as well as positive performance across the Company's boutique network. The increase in net revenue was also driven by the revenue from new, expanded and repositioned boutiques.
Gross profit increased by 25.4% to $181.0 million. Excluding the impact of IFRS 16(2), gross profit increased by 17.5% to $169.5 million compared to $144.3 million in the prior year. Gross profit margin, excluding the impact of IFRS 16(2), remained flat at 38.7% compared to the prior year.
SG&A expenses increased by 15.2% to $115.0 million. Excluding the impact of IFRS 16(2), SG&A expenses increased by 15.4% to $115.2 million compared to $99.8 million in the prior year. Excluding the impact of IFRS 16(2), SG&A expenses were 26.3% of net revenue, a decrease of 50 basis points from the prior year primarily due to leverage on SG&A expenses and timing of marketing spend, partially offset by investments in the Company's digital client experience platform.
Other (income) was ($0.6) million compared to ($3.8) million in the prior year. Other (income) this year primarily relates to interest income of ($0.2) million and realized and unrealized operational foreign exchange gains of ($0.2) million. Other (income) in the prior year primarily related to realized foreign exchange gains on the settlement of U.S. dollar forward contracts of ($1.5) million, unrealized and realized operational foreign exchange gains of ($1.4) million and interest income of ($0.7) million.
Adjusted EBITDA increased by 16.9% to $71.8 million, or 16.4% of net revenue, compared to $61.4 million, or 16.5% of net revenue, in the prior year. Adjusted EBITDA excludes the favorable impact of IFRS 16, stock-based compensation expense, unrealized foreign exchange gains on U.S. dollar forward contracts and secondary offering transaction costs. Adjusted EBITDA was positively impacted by ($0.6) million of other (income), compared to ($3.6) million in the prior year.
Net income increased by 24.3% to $34.1 million, compared to net income of $27.4 million in the prior year. The increase in net income during the year was primarily driven by the factors described above.
Adjusted Net Income increased by 14.0% to $38.2 million compared to $33.5 million in the prior year. Adjusted Net Income excludes the impact of stock-based compensation expense, unrealized foreign exchange gains/losses on U.S. dollar forward contracts and secondary offering transaction costs, net of related tax effects. Adjusted Net Income was positively impacted by ($0.6) million of other (income), net of related tax effects, compared to a benefit of ($3.6) million of other (income), net of related tax effects in the prior year.
Adjusted Net Income per diluted share(1) increased by 17.2% to $0.34 from $0.29 in the prior year.
(1) | See "Non-IFRS Measures including Retail Industry Metrics" and "Selected Consolidated Financial Information" below, including for a reconciliation of the non-IFRS measures used in this release to the most comparable IFRS measures. See also sections entitled "How We Assess the Performance of our Business", "Non-IFRS Measures including Retail Industry Metrics" and "Selected Consolidated Financial Information" in the Management's Discussion and Analysis for further details concerning comparable sales growth, Adjusted EBITDA, Adjusted Net Income and Adjusted Net Income per diluted share, including definitions and reconciliations to the relevant reported IFRS measure. |
(2) | See "Adoption of IFRS 16, Leases" and "Selected Consolidated Financial Information" below for more information regarding the financial impact of IFRS 16 on the second quarter of fiscal 2020 results. |
Normal Course Issuer Bid
On July 11, 2019, the Company announced the commencement of a normal course issuer bid ("NCIB") to purchase and cancel up to 3,624,915 subordinate voting shares over the 12-month period commencing July 16, 2019 and ending July 15, 2020. No shares were repurchased for cancellation under the Company's NCIB during the 13-week period ended September 1, 2019.
On August 30, 2019, the Company entered into an automatic share purchase plan ("ASPP") with a designated broker for the purpose of permitting the purchase of subordinate voting shares under the NCIB during self-imposed blackout periods. Such purchases are determined by the broker in its sole discretion based on parameters established by Aritzia. All purchases made under the ASPP will be included in computing the number of subordinate voting shares purchased under the NCIB.
Adoption of IFRS 16, Leases
The Company adopted IFRS 16, Leases ("IFRS 16"), replacing IAS 17, Leases ("IAS 17") and related interpretations, using the modified retrospective approach, effective for the annual reporting period beginning on March 4, 2019. As a result, the Company's results for the second quarter of fiscal 2020 reflect lease accounting under IFRS 16. Comparative figures for the second quarter of fiscal 2019 have not been restated and continue to be reported under IAS 17.
The Company's financial reporting is impacted by the adoption of IFRS 16. Certain lease-related expenses previously recorded as occupancy costs are now recorded as depreciation expense for right-of-use assets and as interest expense for related lease liabilities. The depreciation expense is recognized on a straight-line basis over the term of the lease, while the interest expense declines over the life of the lease, as the liability is paid off.
(Unaudited, in thousands of | Q2 2020 13 weeks | Q2 2020 13 weeks | Q2 2019 13 weeks | |||||||||
As reported | Excluding IFRS 16(i) | As reported (IAS 17) | Change | |||||||||
(A) | (B) | (C) | (B) - (C) | |||||||||
Gross profit | $ | 95,427 | $ | 89,705 | $ | 76,734 | $ | 12,971 | ||||
As a percentage of net revenue | 39.6% | 37.2% | 37.4% | (0.2%) | ||||||||
SG&A | $ | 60,567 | $ | 60,664 | $ | 52,824 | $ | 7,840 | ||||
As a percentage of net revenue | 25.1% | 25.2% | 25.7% | (0.5%) | ||||||||
Adjusted EBITDA(ii) | $ | 36,372 | $ | 36,372 | $ | 33,032 | $ | 3,340 | ||||
As a percentage of net revenue | 15.1% | 15.1% | 16.1% | (1.0%) | ||||||||
Adjusted Net Income | $ | 19,757 | $ | 19,885 | $ | 18,295 | $ | 1,590 | ||||
As a percentage of net revenue | 8.2% | 8.2% | 8.9% | (0.7%) | ||||||||
Adjusted Net Income per Diluted | ||||||||||||
Share | $ | 0.18 | $ | 0.18 | $ | 0.16 | $ | 0.02 | ||||
(Unaudited, in thousands of | YTD 2020 26 weeks | YTD 2020 26 weeks | YTD 2019 26 weeks | |||||||||
As reported | Excluding IFRS 16(i) | As reported (IAS 17) | Change | |||||||||
(A) | (B) | (C) | (B) - (C) | |||||||||
Gross profit | $ | 180,988 | $ | 169,501 | $ | 144,277 | $ | 25,224 | ||||
As a percentage of net revenue | 41.3% | 38.7% | 38.7% | 0.0% | ||||||||
SG&A | $ | 114,996 | $ | 115,198 | $ | 99,817 | $ | 15,381 | ||||
As a percentage of net revenue | 26.3% | 26.3% | 26.8% | (0.5%) | ||||||||
Adjusted EBITDA(ii) | $ | 71,751 | $ | 71,751 | $ | 61,384 | $ | 10,367 | ||||
As a percentage of net revenue | 16.4% | 16.4% | 16.5% | (0.1%) | ||||||||
Adjusted Net Income | $ | 38,241 | $ | 38,446 | $ | 33,538 | $ | 4,908 | ||||
As a percentage of net revenue | 8.7% | 8.8% | 9.0% | (0.2%) | ||||||||
Adjusted Net Income per Diluted | ||||||||||||
Share | $ | 0.34 | $ | 0.34 | $ | 0.29 | $ | 0.05 | ||||
Notes: | |
i) | Presented using IAS 17, as if IFRS 16 had not been adopted, for comparative purposes only. |
ii) | To improve the comparability of underlying performance with periods prior to our adoption of IFRS 16, Adjusted EBITDA for Q2 2020 and YTD 2020 have been adjusted to exclude, in addition to other adjustments, the impact of IFRS 16. |
Outlook
The Company is pleased with its new fall/winter product launch, which has been well-received by its clients. The Company expects comparable sales in the third quarter to be in the low to mid-single digits, following exceptionally strong comp growth of 12.9% in the third quarter last year.
For fiscal 2020, the Company currently expects the following, which excludes the impact of IFRS 16 adoption:
- Net revenue growth in the low double digits.
- Five new boutiques in the U.S., including the two new boutiques that opened in the first and second quarters (Hudson Yards in Manhattan, New York and Mall of America in Minneapolis, Minnesota) and one new boutique that already opened in the third quarter (Cherry Creek in Denver, Colorado).
- Since the end of the second quarter, the Company has also opened two pop-up locations, one in Greenwich, Connecticut and the other in Orchard Park, Kelowna, B.C.
- Three boutique expansions or repositions in Canada, including the repositioning of the Mapleview boutique in Greater Toronto that opened in the first quarter, the expansion of the Rideau boutique in Ottawa, Ontario that already opened in the third quarter and the repositioning of the Coquitlam Centre boutique, in Greater Vancouver scheduled to open in November.
- Gross profit margin to be flat to slightly lower than fiscal 2019 due to ongoing higher raw material costs and the effect of new tariffs from the ongoing trade dispute between the USA and China.
- SG&A to grow faster than revenue, as the Company continues to make strategic investments in technology and infrastructure to support its long term growth. A majority of the investments related to the Company's eCommerce platform improvements, omni-channel capabilities, digital selling tools and data analytics platforms are cloud-based and will be expensed in SG&A. Incremental SG&A expenses in fiscal 2020 related to these initiatives are expected to total $7 million to $8 million, with $5 million to $6 million expected to occur in the second half of the fiscal year.
- Net capital expenditures in the range of $45 million to $50 million.
Overall, the Company remains on track to meet or exceed its stated fiscal 2021 performance targets.
See "Forward-Looking Information" below, and for additional information, please see the "Outlook" section of the Management's Discussion and Analysis for the second quarter of fiscal 2020.
A conference call to discuss second quarter results is scheduled for Tuesday, October 15, 2019, at 1:30 p.m. PDT / 4:30 p.m. EDT. A replay of the conference call can be accessed shortly after the conclusion of the call. To access the replay, please dial 1-855-669-9658 and use replay access code 3645. A replay of the webcast will be available at the conclusion of the call and will remain on Aritzia's investor relations website.
About Aritzia
Aritzia is a vertically integrated, innovative design house of fashion brands. The Company designs apparel and accessories for its collection of exclusive brands. The Company's expansive and diverse range of women's fashion apparel and accessories addresses a broad range of style preferences and lifestyle requirements. Aritzia is well known and deeply loved by its clients in Canada with growing client awareness and affinity in the United States and outside of North America. Aritzia aims to delight its clients through an aspirational omni-channel shopping experience and exceptional client service that extends across its more than 90 boutiques and eCommerce business, aritzia.com.
Non-IFRS Measures including Retail Industry Metrics
This press release makes reference to certain non-IFRS measures including certain retail industry metrics. These measures are not recognized measures under IFRS, do not have a standardized meaning prescribed by IFRS, and are therefore unlikely to be comparable to similar measures presented by other companies. Rather, these measures are provided as additional information to complement those IFRS measures by providing further understanding of our results of operations from management's perspective. Accordingly, these measures should not be considered in isolation nor as a substitute for analysis of our financial information reported under IFRS. We use non-IFRS measures including "EBITDA", "Adjusted EBITDA", "Adjusted Net Income", "Adjusted Net Income per diluted share", and "gross profit margin". This press release also makes reference to "comparable sales growth", which is a commonly used operating metric in the retail industry but may be calculated differently compared to other retailers. These non-IFRS measures including retail industry metrics are used to provide investors with supplemental measures of our operating performance and thus highlight trends in our core business that may not otherwise be apparent when relying solely on IFRS measures. We believe that securities analysts, investors and other interested parties frequently use non-IFRS measures including retail industry metrics in the evaluation of issuers. Our management also uses non-IFRS measures including retail industry metrics in order to facilitate operating performance comparisons from period to period, to prepare annual operating budgets and forecasts and to determine components of management compensation. Definitions and reconciliations of non-IFRS measures to the relevant reported measures can be found in our MD&A. Such reconciliations can also be found in this press release under the heading "Selected Consolidated Financial Information".
Forward-Looking Information
Certain statements made in this press release may constitute forward-looking information under applicable securities laws. These statements may relate to our future financial outlook and anticipated events or results and include, but are not limited to, expectations regarding the quality of our products and our channel-agnostic client experience, expectations regarding our technology and infrastructure, outlook for revenue growth and gross profit margin in fiscal 2020 as further described below, expectations regarding the Company meeting or exceeding its stated fiscal 2021 performance targets, and other statements that are not historical facts. Particularly, information regarding our expectations of future results, targets, performance achievements, prospects or opportunities is forward-looking information. As the context requires, this may include certain targets as disclosed in the prospectus for our initial public offering, which are based on the factors and assumptions, and subject to the risks, as set out therein and herein. Often but not always, forward-looking statements can be identified by the use of forward-looking terminology such as "may", "will", "expect", "believe", "estimate", "plan", "could", "should", "would", "outlook", "forecast", "anticipate", "foresee", "continue" or the negative of these terms or variations of them or similar terminology.
Implicit in forward-looking statements in respect of the Company's expectations for fiscal 2020 to deliver low double digit revenue growth, as compared to fiscal 2019, are certain current assumptions, including, among others, comparable sales in the third quarter to be in the low to mid-single digits, the opening of five new boutiques in the U.S. including the two new boutiques that opened in the first and second quarters (Hudson Yards in Manhattan, New York and Mall of America in Minneapolis, Minnesota) and one new boutique that already opened in the third quarter (Cherry Creek in Denver, Colorado), two pop-up locations already opened in the second quarter (Greenwich in Connecticut and Orchard Park in Kelowna, B.C.), three boutique expansions or repositions in Canada including the repositioning of the Mapleview boutique in Greater Toronto that opened in the first quarter, the expansion of the Rideau boutique, in Ottawa, Ontario that already opened in the third quarter and the repositioning of the Coquitlam Centre boutique, in Greater Vancouver scheduled to open in November, gross profit margin is expected to be flat to slightly lower than fiscal 2019 due to ongoing higher raw material costs and the effect of new tariffs from the ongoing trade dispute between the U.S. and China, SG&A to grow faster than revenue, as the Company continues to make strategic investments in technology and infrastructure to support its long term growth, a majority of the investments related to the Company's eCommerce platform improvements, omni-channel capabilities, digital selling tools and data analytics platforms will be expensed in SG&A, incremental SG&A expenses related to these initiatives in fiscal 2020 are expected to be approximately $7 million to $8 million, with $5 million to $6 million expected to occur in the second half of the fiscal year, net capital expenditures in the range of $45 million to $50 million, assumptions regarding the overall retail environment and currency exchange rates for fiscal 2020. Specifically, we have assumed the following exchange rates for fiscal 2020: USD:CAD = 1:1.33.
This forward-looking information and other forward-looking information are based on our opinions, estimates and assumptions in light of our experience and perception of historical trends, current conditions and expected future developments, as well as other factors that we currently believe are appropriate and reasonable in the circumstances. Despite a careful process to prepare and review the forward-looking information, there can be no assurance that the underlying opinions, estimates and assumptions will prove to be correct. Certain assumptions in respect of the expansion and enhancement of our boutique network; the growth of our eCommerce business; our ability to drive comparable sales growth; our ability to maintain, enhance, and grow our appeal within our addressable market; our ability to drive ongoing development and innovation of our exclusive brands and product categories; our ability to continue directly sourcing from third party mills, trim suppliers and manufacturers for our exclusive brands; our ability to build our international presence; our ability to retain key personnel; our ability to maintain and expand distribution capabilities; our ability to continue investing in infrastructure to support our growth; our ability to obtain and maintain existing financing on acceptable terms; currency exchange and interest rates; the impact of competition; the changes and trends in our industry or the global economy; and the changes in laws, rules, regulations, and global standards are material factors made in preparing forward-looking information and management's expectations.
Many factors could cause our actual results, level of activity, performance or achievements or future events or developments to differ materially from those expressed or implied by the forward-looking statements, including, without limitation, the factors discussed in the "Risk Factors" section of the Company's annual information form dated May 9, 2019 for the fiscal year ended March 3, 2019 (the "AIF"). A copy of the AIF and the Company's other publicly filed documents can be accessed under the Company's profile on the System for Electronic Document Analysis and Retrieval ("SEDAR") at www.sedar.com. The Company cautions that the list of risk factors and uncertainties described in the AIF is not exhaustive and other factors could also adversely affect its results. Readers are urged to consider the risks, uncertainties and assumptions carefully in evaluating the forward-looking information and are cautioned not to place undue reliance on such information.
Selected Consolidated Financial Information
CONDENSED INTERIM CONSOLIDATED STATEMENTS OF OPERATIONS: | |||||||||||||
| Q2 2020 13 weeks | Q2 2019 13 weeks | |||||||||||
As reported (IFRS 16) | IFRS 16 | Excluding | As reported (IAS 17) | ||||||||||
Net revenue | $ | 241,178 | 100.0% | $ | - | $ | 241,178 | 100.0% | $ | 205,359 | 100.0% | ||
Cost of goods sold | 145,751 | 60.4% | 5,722 | 151,473 | 62.8% | 128,625 | 62.6% | ||||||
Gross profit | 95,427 | 39.6% | (5,722) | 89,705 | 37.2% | 76,734 | 37.4% | ||||||
Operating expenses | |||||||||||||
Selling, general and administrative | 60,567 | 25.1% | 97 | 60,664 | 25.2% | 52,824 | 25.7% | ||||||
Stock-based compensation expense | 1,942 | 0.8% |
- | 1,942 | 0.8% | 2,229 | 1.1% | ||||||
Income from operations | 32,918 | 13.6% | (5,819) | 27,099 | 11.2% | 21,681 | 10.6% | ||||||
Finance expense | 7,157 | 3.0% | (5,996) | 1,161 | 0.5% | 1,110 | 0.5% | ||||||
Other expenses (income) | 664 | 0.3% | - | 664 | 0.3% | (876) | (0.4%) | ||||||
Income before income taxes | 25,097 | 10.4% | 177 | 25,274 | 10.5% | 21,447 | 10.4% | ||||||
Income tax expense | 7,177 | 3.0% | 49 | 7,226 | 3.0% | 6,332 | 3.1% | ||||||
Net income | $ | 17,920 | 7.4% | $ | 128 | $ | 18,048 | 7.5% | $ | 15,115 | 7.4% | ||
Other Performance Measures: | |||||||||||||
Year-over-year net revenue growth | 17.4% | 17.4% | 18.0% | ||||||||||
Comparable sales growth | 8.4% | 8.4% | 11.5% | ||||||||||
Capital cash expenditures | |||||||||||||
(excluding proceeds from | $ | 11,971 | $ | 11,971 | $ | 19,118 | |||||||
Number of boutiques, end of period | 93 | 93 | 90 | ||||||||||
New boutiques added | 1 | 1 | 3 | ||||||||||
Boutiques expanded or repositioned | - | - | 1 | ||||||||||
Note: | |
i) | Presented using IAS 17, as if IFRS 16 had not been adopted, for comparative purposes only. |
CONDENSED INTERIM CONSOLIDATED STATEMENTS OF OPERATIONS: | |||||||||||||
| YTD 2020 | YTD 2019 26 weeks | |||||||||||
As reported (IFRS 16) | IFRS 16 | Excluding | As reported (IAS 17) | ||||||||||
Net revenue | $ | 437,877 | 100.0% | $ | - | $ | 437,877 | 100.0% | $ | 372,370 | 100.0% | ||
Cost of goods sold | 256,889 | 58.7% | 11,487 | 268,376 | 61.3% | 228,093 | 61.3% | ||||||
Gross profit | 180,988 | 41.3% | (11,487) | 169,501 | 38.7% | 144,277 | 38.7% | ||||||
Operating expenses | |||||||||||||
Selling, general and administrative | 114,996 | 26.3% | 202 | 115,198 | 26.3% | 99,817 | 26.8% | ||||||
Stock-based compensation expense | 4,316 | 1.0% | - | 4,316 | 1.0% | 6,048 | 1.6% | ||||||
Income from operations | 61,676 | 14.1% | (11,689) | 49,987 | 11.4% | 38,412 | 10.3% | ||||||
Finance expense | 14,384 | 3.3% | (11,972) | 2,412 | 0.6% | 2,501 | 0.7% | ||||||
Other expenses (income) | (615) | (0.1%) | - | (615) | (0.1%) | (3,831) | (1.0%) | ||||||
Income before income taxes | 47,907 | 10.9% | 283 | 48,190 | 11.0% | 39,742 | 10.7% | ||||||
Income tax expense | 13,831 | 3.2% | 78 | 13,909 | 3.2% | 12,337 | 3.3% | ||||||
Net income | $ | 34,076 | 7.8% | $ | 205 | $ | 34,281 | 7.8% | $ | 27,405 | 7.4% | ||
Other Performance Measures: Year-over-year net revenue growth | 17.6% | 17.6% | 16.7% | ||||||||||
Comparable sales growth | 8.2% | 8.2% | 11.2% | ||||||||||
Capital cash expenditures | |||||||||||||
(excluding proceeds from | $ | 22,137 | $ | 22,137 | $ | 34,260 | |||||||
Number of boutiques, end of period | 93 | 93 | 90 | ||||||||||
New boutiques added | 2 | 2 | 5 | ||||||||||
Boutiques expanded or | |||||||||||||
repositioned | 1 | 1 | 3 | ||||||||||
Note: | |
ii) | Presented using IAS 17, as if IFRS 16 had not been adopted, for comparative purposes only. |
RECONCILIATION OF NET INCOME TO EBITDA, ADJUSTED EBITDA AND ADJUSTED NET INCOME: | |||||||||||
| Q2 2020 13 weeks | Q2 2019 13 weeks | YTD 2020 26 weeks | YTD 2019 26 weeks | |||||||
Reconciliation of Net Income to | |||||||||||
Net income | $ | 17,920 | $ | 15,115 | $ | 34,076 | $ | 27,405 | |||
Depreciation and amortization | 22,666 | 6,821 | 45,864 | 12,852 | |||||||
Finance expense | 7,157 | 1,110 | 14,384 | 2,501 | |||||||
Income tax expense | 7,177 | 6,332 | 13,831 | 12,337 | |||||||
EBITDA | 54,920 | 29,378 | 108,155 | 55,095 | |||||||
Adjustments to EBITDA: | |||||||||||
Stock-based compensation expense | 1,942 | 2,229 | 4,316 | 6,048 | |||||||
Rent impact from IFRS 16, Leases(i) | (20,490) | - | (40,720) | - | |||||||
Unrealized foreign exchange loss | |||||||||||
(gain) on forward contracts | - | 1,002 | - | (182) | |||||||
Other non-recurring items (ii) | - | 423 | - | 423 | |||||||
Adjusted EBITDA | $ | 36,372 | $ | 33,032 | $ | 71,751 | $ | 61,384 | |||
Adjusted EBITDA as a Percentage of | |||||||||||
Net Revenue | 15.1% | 16.1% | 16.4% | 16.5% | |||||||
Reconciliation of Net Income to | |||||||||||
Adjusted Net Income: | |||||||||||
Net income | $ | 17,920 | $ | 15,115 | $ | 34,076 | $ | 27,405 | |||
Adjustments to net income: | |||||||||||
Stock-based compensation expense | 1,942 | 2,229 | 4,316 | 6,048 | |||||||
Unrealized foreign exchange loss (gain) on forward contracts | - | 1,002 | - | (182) | |||||||
Other non-recurring items (ii) | - | 423 | - | 423 | |||||||
Related tax effects | (105) | (474) | (151) | (156) | |||||||
Adjusted Net Income | $ | 19,757 | $ | 18,295 | $ | 38,241 | $ | 33,538 | |||
Adjusted Net Income as a | |||||||||||
Percentage of Net Revenue | 8.2% | 8.9% | 8.7% | 9.0% | |||||||
Weighted Average Number of Diluted | |||||||||||
Shares Outstanding (thousands) | 111,537 | 117,410 | 111,696 | 117,140 | |||||||
Adjusted Net Income per Diluted Share | $ | 0.18 | $ | 0.16 | $ | 0.34 | $ | 0.29 | |||
Note i) | |||||||||||
Rent Impact from IFRS 16, Leases | |||||||||||
Q2 2020 13 weeks | YTD 2020 26 weeks | ||||||||||
Net income | $ | 128 | $ | 205 | |||||||
Depreciation and amortization | (14,671) | (29,031) | |||||||||
Finance expense | (5,996) | (11,972) | |||||||||
Income tax expense | 49 | 78 | |||||||||
Rent impact from IFRS 16, Leases | $ | (20,490) | $ | (40,720) | |||||||
Note ii) |
Other non-recurring items in Q2 2019 and YTD 2019 relate to transaction costs relating to the Company's secondary offering of subordinate voting shares. |
RECONCILIATION OF COMPARABLE SALES TO NET REVENUE: | |||||||||||
(Unaudited, in thousands of Canadian dollars) | Q2 2020 13 weeks | Q2 2019 13 weeks | YTD 2020 26 weeks | YTD 2019 | |||||||
Comparable sales(i) | $ | 206,500 | $ | 145,650 | $ | 367,794 | $ | 266,792 | |||
Non-comparable sales | 34,678 | 59,709 | 70,083 | 105,578 | |||||||
Net revenue | $ | 241,178 | $ | 205,359 | $ | 437,877 | $ | 372,370 | |||
Note: | |
i) | The comparable sales for a given period represents revenue (net of sales tax, returns and discounts) from boutiques that have been opened for at least 56 weeks including eCommerce revenue (net of sales tax, returns and discounts) within that given period. This information is provided to give context for comparable sales in such given period as compared to net revenue reported in our financial statements. Our comparable sales growth calculation excludes the impact of foreign currency fluctuations. For more details, please see the "Comparable Sales Growth" subsection of the "How We Assess the Performance of Our Business" section of the Management's Discussion and Analysis. |
CONDENSED INTERIM CONSOLIDATED CASH FLOWS: | |||||||||||
(Unaudited, in thousands of Canadian dollars) |
13 weeks | Q2 2019 13 weeks | YTD 2020 26 weeks | YTD 2019 26 weeks | |||||||
Cash Flows: | |||||||||||
Net cash generated from (used in) operating activities | $ | 24,578 | $ | (3,055) | $ | 65,257 | $ | 22,100 | |||
Net cash used in financing activities | (17,943) | (45,140) | (113,942) | (45,505) | |||||||
Net cash used in investing activities | (11,971) | (19,118) | (22,137) | (34,260) | |||||||
Effect of exchange rate changes on | |||||||||||
cash and cash equivalents | (435) | 26 | (89) | 185 | |||||||
(Decrease) in cash and cash equivalents | $ | (5,771) | $ | (67,287) | $ | (70,911) | $ | (57,480) | |||
CONDENSED CONSOLIDATED STATEMENTS OF FINANCIAL POSITION: | ||||||
|
| As at | ||||
Assets | ||||||
Current assets | ||||||
Cash and cash equivalents | $ | 29,986 | $ | 100,897 | ||
Accounts receivable | 2,892 | 4,355 | ||||
Income taxes recoverable | 6,129 | - | ||||
Inventory | 136,500 | 112,183 | ||||
Prepaid expenses and other current assets | 10,299 | 18,422 | ||||
Total current assets | 185,806 | 235,857 | ||||
Property and equipment | 175,279 | 167,593 | ||||
Intangible assets | 63,876 | 64,427 | ||||
Goodwill | 151,682 | 151,682 | ||||
Right-of-use assets | 373,599 | - | ||||
Other assets | 2,608 | 2,209 | ||||
Deferred tax assets | 22,418 | 7,606 | ||||
Total assets | $ | 975,268 | $ | 629,374 | ||
Liabilities | ||||||
Current liabilities | ||||||
Bank indebtedness | $ | 19,736 | $ | - | ||
Accounts payable and accrued liabilities | 62,520 | 62,736 | ||||
Income taxes payable | - | 3,644 | ||||
Current portion of lease liabilities | 57,005 | - | ||||
Deferred revenue | 25,262 | 24,231 | ||||
Total current liabilities | 164,523 | 90,611 | ||||
Lease liabilities | 442,298 | - | ||||
Other non-current liabilities | 6,942 | 69,828 | ||||
Deferred tax liabilities | 21,577 | 20,002 | ||||
Long-term debt | 74,682 | 74,624 | ||||
Total liabilities | 710,022 | 255,065 | ||||
Shareholders' equity | ||||||
Share capital | 200,016 | 199,517 | ||||
Contributed surplus | 65,418 | 65,806 | ||||
Retained earnings | 408 | 109,339 | ||||
Accumulated other comprehensive loss | (596) | (353) | ||||
Total shareholders' equity | 265,246 | 374,309 | ||||
Total liabilities and shareholders' equity | $ | 975,268 | $ | 629,374 | ||
SOURCE Aritzia Inc.







Share this article