Brookdale Announces First Quarter 2012 Results

NASHVILLE, Tenn., May 2, 2012 /PRNewswire/ -- Brookdale Senior Living Inc. (NYSE: BKD) (the "Company") today reported financial and operating results for the first quarter of 2012.
- Cash From Facility Operations ("CFFO") was $58.5 million, or $0.48 per share, excluding $3.9 million of integration and transaction-related costs in the first quarter of 2012.
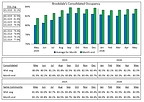
- Average occupancy was 87.8%, a 60 basis point increase from 87.2% in the first quarter of 2011 and flat with the fourth quarter of 2011.
- Average monthly revenue per unit improved by 1.6% to $4,684 for the first quarter of 2012 from $4,609 for the first quarter of 2011.
- Resident and management fee revenue for the first quarter increased $35.4 million, or 6.2%, from the first quarter of 2011.
- Adjusted EBITDA was $100.5 million, excluding integration and transaction-related costs in the first quarter of 2012, as compared to $102.8 million in the first quarter of 2011.
Bill Sheriff, Brookdale's CEO, said, "The first quarter of 2012 proved to be a very solid start to the year. We are encouraged by the occupancy and rate growth trends we experienced. Occupancy was up 60 basis points over last year's first quarter and was flat sequentially – a good accomplishment given historical seasonal patterns. Underlying pricing remained steady as same community revenue per unit for the senior housing business, excluding skilled nursing and ancillary services, increased 2.3% versus the prior year. We also made significant progress in several key initiatives, including growth of our ancillary services footprint and integration of the Horizon Bay communities. We are confident we are positioning Brookdale to provide the best of service and value to our residents and attractive returns to our shareholders."
Mark Ohlendorf, Co-President and CFO of Brookdale, commented, "The Company's cash generation, balance sheet and access to capital should provide us with the ability to execute on acquisition opportunities as they become available, and more importantly to invest in our own assets to enhance returns and CFFO. Our top capital deployment priority remains reinvestment in our existing portfolio through our Program Max initiative, where we expect to generate double digit returns."
Financial Results
Total revenue for the first quarter was $683.5 million, an increase of $96.6 million, or 16.5%, from the first quarter of 2011. Resident and management fee revenue for the first quarter increased $35.4 million, or 6.2%, from the first quarter of 2011. Revenue from "reimbursed costs incurred on behalf of managed communities" increased $61.2 million, primarily due to the addition of managed communities from the Horizon Bay acquisition.
Beginning October 1, 2011, the Company was impacted by a reduction in the reimbursement rate for Medicare skilled nursing patients and home health patients as well as a negative change in the allowable method for delivering therapy services to skilled nursing patients. For the first quarter, the negative financial impact of these changes was approximately $7.2 million of revenue (composed of $4.8 million for the Medicare skilled nursing reimbursement rate reduction and approximately $2.4 million for the Medicare home health rate reduction) and approximately $1.6 million of expense for the increased therapy labor required. This impact is reflected in the financial results presented throughout this release and, in particular, increased expense and decreased revenue, Facility Operating Income, Adjusted EBITDA and Cash From Facility Operations.
Average monthly revenue per unit was $4,684 in the first quarter, an increase of $75, or 1.6%, over the first quarter of 2011. Average occupancy for all consolidated communities for the first quarter of 2012 was 87.8%, compared to 87.2% for the first quarter of 2011 and 87.8% for the fourth quarter of 2011. For the managed community portfolio, average occupancy for the first quarter was 84.3%.
Facility operating expenses for the first quarter were $399.2 million, an increase of $28.3 million, or 7.6%, from the first quarter of 2011. Expenses from "reimbursed costs incurred on behalf of managed communities" increased $61.2 million, primarily due to the addition of managed communities from the Horizon Bay acquisition.
General and administrative expenses for the first quarter were $45.0 million. Excluding integration and transaction-related costs of $3.9 million from the first quarter of 2012 and non-cash stock-based compensation expense from both periods, general and administrative expenses were $34.6 million in the first quarter of 2012 versus $29.0 million for the prior year same period. Demonstrating the Company's efficient platform, this was 4.6% of revenue (including revenues under management) in the first quarter of 2012.
Brookdale's management utilizes Adjusted EBITDA and Cash From Facility Operations to evaluate the Company's performance and liquidity because these metrics exclude non-cash expenses such as depreciation and amortization, non-cash stock-based compensation expense and straight-line lease expense, net of deferred gain amortization. First quarter Adjusted EBITDA and Cash From Facility Operations included integration and transaction-related costs of $3.9 million. Brookdale also uses Facility Operating Income to assess the performance of its communities.
For the quarter ended March 31, 2012, Facility Operating Income was $191.2 million, a decrease of $0.1 million from the first quarter of 2011, and Adjusted EBITDA was $100.5 million, excluding the integration and transaction-related costs in 2012, a decrease of $2.3 million, or 2.2%, over the first quarter of 2011. Cash From Facility Operations was $54.6 million for the first quarter of 2012, or $0.45 per share, and, excluding the integration and transaction-related costs, was $58.5 million for the first quarter of 2012, or $0.48 per share, a decrease of $3.3 million, or 5.3%, from CFFO of $61.8 million, or $0.51 per share, for the first quarter of 2011.
Net loss for the first quarter of 2012 was $(10.3) million, or $(0.09) per diluted common share. The loss for the quarter includes non-cash items for depreciation and amortization, asset impairment, non-cash stock-based compensation expense, loss on acquisition, gain on facility lease termination and straight-line lease expense, net of deferred gain amortization.
Operating Activities
For the quarter ended March 31, 2012, same community revenues grew 2.1% over the same period in 2011 as revenue per unit increased by 1.5% and occupancy grew by 0.5%. Same community Facility Operating Income for the quarter decreased by 2.4% when compared to the first quarter of 2011 as expenses grew by 4.4%.
The same community results for senior housing, excluding ancillary services, for the three months ended March 31, 2012 showed revenues grew 1.7% over the corresponding period in 2011 as revenue per unit increased by 1.1%. Same community Facility Operating Income for senior housing (excluding ancillary services) decreased by 0.5% over the first quarter of 2011. Excluding the change in Medicare skilled nursing due to reimbursement rate reductions and elimination of group therapy, same community senior housing revenue per unit increased by 1.9% and same community senior housing Facility Operating Income increased by 2.7% over the corresponding period in 2011.
By the end of the first quarter, the Company's ancillary services programs provided outpatient therapy services to approximately 35,900 Brookdale units. At the end of the quarter, the Company's home health agencies were serving approximately 32,600 units across the total consolidated Brookdale portfolio, up from approximately 27,000 units served a year ago. Outpatient therapy and home health services produced $110 of monthly Facility Operating Income per occupied unit in the first quarter across all units served, down from $156 per month a year ago, driven primarily by reimbursement rate reductions and the start-up of new operations in Horizon Bay communities.
Balance Sheet
Brookdale had $42.1 million of unrestricted cash and cash equivalents and $93.8 million of restricted cash on its balance sheet at the end of the first quarter. As of March 31, 2012, the Company had an available secured line of credit with a $230.0 million commitment and $199.8 million of availability (of which $85.0 million had been drawn as of that date). The Company also had secured and unsecured letter of credit facilities of up to $82.7 million in the aggregate as of March 31, 2012. $77.8 million of letters of credit had been issued under these facilities as of that date.
On January 5, 2012, the Company obtained a $63.0 million first mortgage loan, secured by one of the Company's communities. The loan bears interest at a variable rate equal to 30-day LIBOR plus a margin of 300 basis points and matures in January 2017. In connection with the transaction, the Company repaid $62.8 million of existing variable rate debt.
On August 11, 2011, the Company's board of directors approved a share repurchase program that authorizes the Company to purchase up to $100.0 million in the aggregate of the Company's common stock. Pursuant to this authorization, 1,217,100 shares had been purchased as of March 31, 2012, at a cost of approximately $17.6 million, or a weighted average price of approximately $14.44 per share. No shares were purchased during the first quarter. As of March 31, 2012, approximately $82.4 million remains available under this share repurchase authorization.
Acquisitions
As previously announced, effective February 2, 2012, the Company acquired the underlying real estate associated with nine communities that were previously leased for an aggregate purchase price of $121.3 million. The Company financed the transaction with $77.9 million of first mortgage financing secured by seven of the communities and $15.0 million of seller-financing secured by two of the communities. The $77.9 million first mortgage facility has a ten year term. 75% of the facility bears interest at a fixed rate of 4.2% and the remaining 25% of the facility bears interest at a variable rate of 30 day LIBOR plus a margin of 276 basis points. The $15.0 million mortgage loan has a two year term and bears interest at a fixed rate of 7.0%.
During the three months ended March 31, 2012, the Company purchased two home health agencies as part of its growth strategy for an aggregate purchase price of approximately $3.7 million.
2012 Outlook
For the full year 2012, the Company continues to expect Cash From Facility Operations to range between $2.10 and $2.20 per share (excluding integration and transaction-related costs). These estimates do not include the impact on operating results from possible future acquisitions or dispositions.
Supplemental Information
The Company will shortly post on the Investor Relations section of the Company's website at www.brookdaleliving.com supplemental information relating to the Company's first quarter 2012 results. This information will also be furnished in a Form 8-K to be filed with the SEC.
Earnings Conference Call
Brookdale's management will conduct a conference call to review the financial results of its first quarter ended March 31, 2012 on Thursday, May 3, 2012 at 9:30 AM ET. The conference call can be accessed by dialing (866) 900-2996 (from within the U.S.) or (706) 643-2685 (from outside of the U.S.) ten minutes prior to the scheduled start and referencing the "Brookdale Senior Living First Quarter Earnings Call."
A webcast of the conference call will be available to the public on a listen-only basis at www.brookdaleliving.com. Please allow extra time prior to the call to visit the site and download the necessary software required to listen to the internet broadcast. A replay of the webcast will be available through the website for three months following the call.
For those who cannot listen to the live call, a replay will be available until 11:59 PM ET on May 10, 2012 by dialing (855) 859-2056 (from within the U.S.) or (404) 537-3406 (from outside of the U.S.) and referencing access code "73380621". A copy of this earnings release is posted on the Investor Relations page of the Brookdale website (www.brookdaleliving.com).
About Brookdale Senior Living
Brookdale Senior Living Inc. is a leading owner and operator of senior living communities throughout the United States. The Company is committed to providing an exceptional living experience through properties that are designed, purpose-built and operated to provide the highest-quality service, care and living accommodations for residents. Currently the Company operates independent living, assisted living, and dementia-care communities and continuing care retirement centers, with 646 communities in 35 states and the ability to serve approximately 67,000 residents.
Safe Harbor
Certain items in this press release and the associated earnings conference call may constitute forward-looking statements within the meaning of the Private Securities Litigation Reform Act of 1995. Those forward-looking statements are subject to various risks and uncertainties and include all statements that are not historical statements of fact and those regarding our intent, belief or expectations, including, but not limited to, statements relating to our operational initiatives and our expectations regarding their effect on our results; our expectations regarding the economy, occupancy, revenue, cash flow, expenses, capital expenditures, Program Max opportunities, cost savings, the demand for senior housing, expansion and development activity, acquisition opportunities, asset dispositions, our share repurchase program, taxes, returns on re-invested capital and CFFO; our belief regarding the value of our common stock and our expectations regarding returns to shareholders and our growth prospects; our expectations concerning the future performance of recently acquired communities and the effects of acquisitions on our financial results; our ability to secure financing or repay, replace or extend existing debt at or prior to maturity; our ability to remain in compliance with all of our debt and lease agreements (including the financial covenants contained therein); our expectations regarding liquidity; our plans to deleverage; our expectations regarding financings and refinancings of assets (including the timing thereof) and their effect on our results; our expectations regarding changes in government reimbursement programs and their effect on our results (including all statements relating to our expectations regarding the effect of recent Medicare reimbursement rate and therapy service delivery changes on our results and cash flow); our plans to generate growth organically through occupancy improvements, increases in annual rental rates and the achievement of operating efficiencies and cost savings; our plans to expand our offering of ancillary services (therapy, home health and hospice); our plans to expand, redevelop and reposition existing communities; our plans to acquire additional communities, asset portfolios, operating companies and home health agencies; the expected project costs for our expansion, redevelopment and repositioning program; our expected levels of expenditures and reimbursements (and the timing thereof); our expectations for the performance of our entrance fee communities; our ability to anticipate, manage and address industry trends and their effect on our business; and our ability to increase revenues, earnings, Adjusted EBITDA, Cash From Facility Operations, and/or Facility Operating Income. Forward-looking statements are generally identifiable by use of forward-looking terminology such as "may," "will," "should," "potential," "intend," "expect," "endeavor," "seek," "anticipate," "estimate," "overestimate," "underestimate," "believe," "could," "would," "project," "predict," "continue," "plan" or other similar words or expressions. Forward-looking statements are based on certain assumptions or estimates, discuss future expectations, describe future plans and strategies, contain projections of results of operations or of financial condition, or state other forward-looking information. Our ability to predict results or the actual effect of future plans or strategies is inherently uncertain. Although we believe that the expectations reflected in such forward-looking statements are based on reasonable assumptions, actual results and performance could differ materially from those set forth in the forward-looking statements. Factors which could have a material adverse effect on our operations and future prospects or which could cause events or circumstances to differ from these forward-looking statements include, but are not limited to, the risk that we may not be able to successfully integrate the new Horizon Bay communities into our operations; our determination from time to time to purchase any shares under the repurchase program; our ability to fund any repurchases; the risk associated with the current global economic crisis and its impact upon capital markets and liquidity; our inability to extend (or refinance) debt (including our credit and letter of credit facilities) as it matures; the risk that we may not be able to satisfy the conditions precedent to exercising the extension options associated with certain of our debt agreements; events which adversely affect the ability of seniors to afford our monthly resident fees or entrance fees; the conditions of housing markets in certain geographic areas; our ability to generate sufficient cash flow to cover required interest and long-term operating lease payments; the effect of our indebtedness and long-term operating leases on our liquidity; the risk of loss of property pursuant to our mortgage debt and long-term lease obligations; the possibilities that changes in the capital markets, including changes in interest rates and/or credit spreads, or other factors could make financing more expensive or unavailable to us; changes in governmental reimbursement programs; our ability to effectively manage our growth; our ability to maintain consistent quality control; delays in obtaining regulatory approvals; the risk that we may not be able to expand, redevelop and reposition our communities in accordance with our plans; our ability to complete acquisitions and integrate them into our operations; competition for the acquisition of assets; our ability to obtain additional capital on terms acceptable to us; a decrease in the overall demand for senior housing; our vulnerability to economic downturns; acts of nature in certain geographic areas; terminations of our resident agreements and vacancies in the living spaces we lease; increased competition for skilled personnel; increased union activity; departure of our key officers; increases in market interest rates; environmental contamination at any of our facilities; failure to comply with existing environmental laws; an adverse determination or resolution of complaints filed against us; the cost and difficulty of complying with increasing and evolving regulation; and other risks detailed from time to time in our filings with the Securities and Exchange Commission, including our Annual Report on Form 10-K and Quarterly Reports on Form 10-Q. When considering forward-looking statements, you should keep in mind the risk factors and other cautionary statements in such SEC filings. Readers are cautioned not to place undue reliance on any of these forward-looking statements, which reflect our management's views as of the date of this press release and/or the associated earnings conference call. The factors discussed above and the other factors noted in our SEC filings from time to time could cause our actual results to differ significantly from those contained in any forward-looking statement. We cannot guarantee future results, levels of activity, performance or achievements and we expressly disclaim any obligation to release publicly any updates or revisions to any forward-looking statements contained herein to reflect any change in our expectations with regard thereto or change in events, conditions or circumstances on which any statement is based.
| Condensed Consolidated Statements of Operations |
||||
| Three Months Ended |
||||
| March 31, |
||||
| 2012 |
2011 |
|||
| Revenue |
||||
| Resident fees |
$ 596,886 |
$ 568,035 |
||
| Management fees |
7,924 |
1,405 |
||
| Reimbursed cost incurred on behalf of managed communities |
78,715 |
17,480 |
||
| Total revenue |
683,525 |
586,920 |
||
| Expense |
||||
| Facility operating expense (excluding depreciation and amortization of $57,936 and $58,959, respectively) |
399,249 |
370,954 |
||
| General and administrative expense (including non-cash stock-based compensation expense of $6,435 and $4,540, respectively) |
44,973 |
33,543 |
||
| Facility lease expense |
71,445 |
66,315 |
||
| Depreciation and amortization |
63,344 |
71,782 |
||
| Asset impairment |
1,083 |
14,846 |
||
| Loss on acquisition |
636 |
- |
||
| Gain on facility lease termination |
(2,780) |
- |
||
| Costs incurred on behalf of managed communities |
78,715 |
17,480 |
||
| Total operating expense |
656,665 |
574,920 |
||
| Income from operations |
26,860 |
12,000 |
||
| Interest income |
852 |
625 |
||
| Interest expense: |
||||
| Debt |
(32,050) |
(31,561) |
||
| Amortization of deferred financing costs and debt discount |
(4,473) |
(2,704) |
||
| Change in fair value of derivatives and amortization |
(233) |
(8) |
||
| Loss on extinguishment of debt, net |
(221) |
(2,894) |
||
| Equity in earnings of unconsolidated ventures |
99 |
266 |
||
| Other non-operating (loss) income |
(111) |
817 |
||
| Loss before income taxes |
(9,277) |
(23,459) |
||
| (Provision) benefit for income taxes |
(1,061) |
11,154 |
||
| Net loss |
(10,338) |
(12,305) |
||
| Basic and diluted loss per share |
$ (0.09) |
$ (0.10) |
||
| Weighted average shares used in |
||||
| computing basic and diluted net loss per share |
121,145 |
120,792 |
||
| Condensed Consolidated Balance Sheets |
||||
| March 31, 2012 |
December 31, 2011 |
|||
| (Unaudited) |
||||
| Cash and cash equivalents |
$ 42,113 |
$ 30,836 |
||
| Cash and escrow deposits - restricted |
44,867 |
45,903 |
||
| Accounts receivable, net |
102,568 |
98,697 |
||
| Other current assets |
107,993 |
105,439 |
||
| Total current assets |
297,541 |
280,875 |
||
| Property, plant and equipment and |
||||
| leasehold intangibles, net |
3,793,384 |
3,694,064 |
||
| Other assets, net |
485,184 |
491,122 |
||
| Total assets |
$ 4,576,109 |
$ 4,466,061 |
||
| Current liabilities |
$ 687,513 |
$ 620,950 |
||
| Long-term debt, less current portion |
2,465,926 |
2,415,971 |
||
| Other liabilities |
384,854 |
388,932 |
||
| Total liabilities |
3,538,293 |
3,425,853 |
||
| Stockholders' equity |
1,037,816 |
1,040,208 |
||
| Total liabilities and stockholders' equity |
$ 4,576,109 |
$ 4,466,061 |
||
| Condensed Consolidated Statements of Cash Flows |
||||
| Three Months Ended March 31, |
||||
| 2012 |
2011 |
|||
| Cash Flows from Operating Activities |
||||
| Net loss |
$ (10,338) |
$ (12,305) |
||
| Adjustments to reconcile net loss to net cash provided by operating activities: |
||||
| Loss on extinguishment of debt |
221 |
2,894 |
||
| Depreciation and amortization |
67,817 |
74,486 |
||
| Asset impairment |
1,083 |
14,846 |
||
| Equity in earnings of unconsolidated ventures |
(99) |
(266) |
||
| Distributions from unconsolidated ventures from cumulative share of net earnings |
206 |
- |
||
| Amortization of deferred gain |
(1,093) |
(1,093) |
||
| Amortization of entrance fees |
(6,403) |
(5,762) |
||
| Proceeds from deferred entrance fee revenue |
7,000 |
6,361 |
||
| Deferred income tax benefit |
(4) |
(11,841) |
||
| Change in deferred lease liability |
1,642 |
1,726 |
||
| Change in fair value of derivatives and amortization |
233 |
8 |
||
| Loss (gain) on sale of assets |
114 |
(1,315) |
||
| Loss on acquisition |
636 |
- |
||
| Gain on facility lease termination |
(2,780) |
- |
||
| Non-cash stock-based compensation |
6,435 |
4,540 |
||
| Changes in operating assets and liabilities: |
||||
| Accounts receivable, net |
(5,317) |
(105) |
||
| Prepaid expenses and other assets, net |
(3,621) |
(7,104) |
||
| Accounts payable and accrued expenses |
(23,705) |
8,453 |
||
| Tenant refundable fees and security deposits |
(442) |
310 |
||
| Deferred revenue |
12,168 |
11,269 |
||
| Other |
1,940 |
7,564 |
||
| Net cash provided by operating activities |
45,693 |
92,666 |
||
| Cash Flows from Investing Activities |
||||
| (Increase) decrease in lease security deposits and lease acquisition deposits, net |
(2,217) |
941 |
||
| Decrease in cash and escrow deposits — restricted |
8,442 |
54,455 |
||
| Purchase of marketable securities — restricted |
(399) |
(26,409) |
||
| Sale of marketable securities — restricted |
- |
809 |
||
| Additions to property, plant and equipment and leasehold intangibles, |
||||
| net of related payables |
(41,533) |
(28,589) |
||
| Acquisition of assets, net of related payables and cash received |
(104,984) |
(51,330) |
||
| (Issuance of) payment on notes receivable, net |
(439) |
403 |
||
| Distributions received from unconsolidated ventures |
100 |
60 |
||
| Proceeds from sale of assets |
- |
23,147 |
||
| Other |
(362) |
(164) |
||
| Net cash used in investing activities |
(141,392) |
(26,677) |
||
| Cash Flows from Financing Activities |
||||
| Proceeds from debt |
175,838 |
28,000 |
||
| Repayment of debt and capital lease obligations |
(86,068) |
(134,550) |
||
| Proceeds from line of credit |
130,000 |
40,000 |
||
| Repayment of line of credit |
(110,000) |
(40,000) |
||
| Payment of financing costs, net of related payables |
(2,378) |
(2,575) |
||
| Other |
(86) |
(184) |
||
| Refundable entrance fees: |
||||
| Proceeds from refundable entrance fees |
7,989 |
6,080 |
||
| Refunds of entrance fees |
(8,102) |
(4,930) |
||
| Cash portion of loss on extinguishment of debt |
(118) |
(2,861) |
||
| Recouponing and payment of swap termination |
(99) |
(64) |
||
| Net cash provided by (used in) financing activities |
106,976 |
(111,084) |
||
| Net increase (decrease) in cash and cash equivalents |
11,277 |
(45,095) |
||
| Cash and cash equivalents at beginning of period |
30,836 |
81,827 |
||
| Cash and cash equivalents at end of period |
$ 42,113 |
$ 36,732 |
||
Non-GAAP Financial Measures
Adjusted EBITDA
Adjusted EBITDA is a measure of operating performance that is not calculated in accordance with U.S. generally accepted accounting principles ("GAAP"). Adjusted EBITDA should not be considered in isolation or as a substitute for net income, income from operations or cash flows provided by or used in operations, as determined in accordance with GAAP. Adjusted EBITDA is a key measure of the Company's operating performance used by management to focus on operating performance and management without mixing in items of income and expense that relate to long-term contracts and the financing and capitalization of the business. We define Adjusted EBITDA as net income (loss) before provision (benefit) for income taxes, non-operating (income) expense items, (gain) loss on sale or acquisition of communities (including gain (loss) on facility lease termination), depreciation and amortization (including non-cash impairment charges), straight-line lease expense (income), amortization of deferred gain, amortization of deferred entrance fees, non-cash stock-based compensation expense, and change in future service obligation and including entrance fee receipts and refunds (excluding (i) first generation entrance fee receipts from the sale of units at a recently opened entrance fee CCRC prior to stabilization and (ii) first generation entrance fee refunds not replaced by second generation entrance fee receipts at the recently opened community prior to stabilization).
In the first quarter of 2012, we revised the definition of Adjusted EBITDA to clarify the point at which first generation entrance fee receipts and refunds at recently opened entrance fee CCRCs will be included. We determine the stabilization date of recently opened entrance fee communities to be the first day of the first full fiscal quarter occurring two years subsequent to the community's opening date for occupancy of all levels of care on the campus.
As a result of this change, we will prospectively include all net entrance fee activity from a recently opened entrance fee CCRC in our non-GAAP financial measures. For the three months ended March 31, 2012, first generation net entrance fee receipts which would have been excluded under the previous definition of Adjusted EBITDA were $0.5 million.
We believe Adjusted EBITDA is useful to investors in evaluating our performance, results of operations and financial position for the following reasons:
- It is helpful in identifying trends in our day-to-day performance because the items excluded have little or no significance to our day-to-day operations;
- It provides an assessment of controllable expenses and affords management the ability to make decisions which are expected to facilitate meeting current financial goals as well as achieve optimal financial performance; and
- It is an indication to determine if adjustments to current spending decisions are needed.
The table below reconciles Adjusted EBITDA from net loss for the three months ended March 31, 2012 and 2011 (in thousands):
| Three Months Ended March 31, (1) |
||||
| 2012 |
2011 |
|||
| Net loss |
$ (10,338) |
$ (12,305) |
||
| Provision (benefit) for income taxes |
1,061 |
(11,154) |
||
| Equity in earnings of unconsolidated ventures |
(99) |
(266) |
||
| Loss on extinguishment of debt, net |
221 |
2,894 |
||
| Other non-operating loss (income) |
111 |
(817) |
||
| Interest expense: |
||||
| Debt |
24,340 |
23,553 |
||
| Capitalized lease obligation |
7,710 |
8,008 |
||
| Amortization of deferred financing costs and debt discount |
4,473 |
2,704 |
||
| Change in fair value of derivatives and amortization |
233 |
8 |
||
| Interest income |
(852) |
(625) |
||
| Income from operations |
26,860 |
12,000 |
||
| Gain on facility lease termination |
(2,780) |
- |
||
| Loss on acquisition |
636 |
- |
||
| Depreciation and amortization |
63,344 |
71,782 |
||
| Asset impairment |
1,083 |
14,846 |
||
| Straight-line lease expense |
1,642 |
1,726 |
||
| Amortization of deferred gain |
(1,093) |
(1,093) |
||
| Amortization of entrance fees |
(6,403) |
(5,762) |
||
| Non-cash stock-based compensation expense |
6,435 |
4,540 |
||
| Entrance fee receipts (2) |
14,989 |
12,441 |
||
| First generation entrance fees received (3) |
- |
(2,729) |
||
| Entrance fee disbursements |
(8,102) |
(4,930) |
||
| Adjusted EBITDA |
$ 96,611 |
$ 102,821 |
||
| (1) The calculation of Adjusted EBITDA includes integration and transaction-related costs of $3.9 million for the three months ended March 31, 2012. There were no such costs for the three months ended March 31, 2011.
(2) Includes the receipt of refundable and nonrefundable entrance fees.
(3) First generation entrance fees received represents initial entrance fees received from the sale of units at a recently opened entrance fee CCRC prior to stabilization. |
||||
Cash From Facility Operations
Cash From Facility Operations (CFFO) is a measurement of liquidity that is not calculated in accordance with GAAP and should not be considered in isolation as a substitute for cash flows provided by or used in operations, as determined in accordance with GAAP. We define CFFO as net cash provided by (used in) operating activities adjusted for changes in operating assets and liabilities, deferred interest and fees added to principal, refundable entrance fees received, first generation entrance fee receipts at a recently opened entrance fee CCRC prior to stabilization, entrance fee refunds disbursed adjusted for first generation entrance fee refunds not replaced by second generation entrance fee receipts at the recently opened community prior to stabilization, lease financing debt amortization with fair market value or no purchase options, gain (loss) on facility lease termination, recurring capital expenditures (net), distributions from unconsolidated ventures from cumulative share of net earnings, CFFO from unconsolidated ventures, and other. Recurring capital expenditures include routine expenditures capitalized in accordance with GAAP that are funded from current operations. Amounts excluded from recurring capital expenditures consist primarily of major projects, renovations, community repositionings, expansions, systems projects or other non-recurring or unusual capital items (including integration capital expenditures) or community purchases that are funded using lease or financing proceeds, available cash and/or proceeds from the sale of communities that are held for sale.
In the first quarter of 2012, we revised the definition of CFFO to clarify the point at which first generation entrance fee receipts and refunds at recently opened entrance fee CCRCs will be included. We determine the stabilization date of recently opened entrance fee communities to be the first day of the first full fiscal quarter occurring two years subsequent to the community's opening date for occupancy of all levels of care on the campus.
As a result of this change, we will prospectively include all net entrance fee activity from a recently opened entrance fee CCRC in our non-GAAP financial measures. For the three months ended March 31, 2012, first generation net entrance fee receipts which would have been excluded under the previous definition of CFFO were $0.5 million.
We believe CFFO is useful to investors in evaluating our liquidity for the following reasons:
- It provides an assessment of our ability to facilitate meeting current financial and liquidity goals.
- To assess our ability to:
- service our outstanding indebtedness;
- pay dividends; and
- make regular recurring capital expenditures to maintain and improve our facilities.
The table below reconciles CFFO from net cash provided by operating activities for the three months ended March 31, 2012 and 2011 (in thousands):
| Three Months Ended March 31, (1) |
||||
| 2012 |
2011 |
|||
| Net cash provided by operating activities |
$ 45,693 |
$ 92,666 |
||
| Changes in operating assets and liabilities |
18,977 |
(20,387) |
||
| Refundable entrance fees received (2) |
7,989 |
6,080 |
||
| First generation entrance fees received (3) |
- |
(2,729) |
||
| Entrance fee refunds disbursed |
(8,102) |
(4,930) |
||
| Recurring capital expenditures, net |
(8,064) |
(7,057) |
||
| Lease financing debt amortization with fair market value or no purchase options |
(2,929) |
(2,533) |
||
| Distributions from unconsolidated ventures from cumulative share of net earnings |
(206) |
- |
||
| CFFO from unconsolidated ventures |
1,228 |
641 |
||
| Cash From Facility Operations |
$ 54,586 |
$ 61,751 |
||
| (1) The calculation of CFFO includes integration and transaction-related costs of $3.9 million for the three months ended March 31, 2012. There were no such costs for the three months ended March 31, 2011.
(2) Total entrance fee receipts for the three months ended March 31, 2012 and 2011 were $15.0 million and $12.4 million, respectively, including $7.0 million and $6.4 million, respectively, of non-refundable entrance fee receipts included in net cash provided by operating activities.
(3) First generation entrance fees received represents initial entrance fees received from the sale of units at a recently opened entrance fee CCRC prior to stabilization. |
||||
The calculation of CFFO per share is based on weighted average outstanding common shares for the period, excluding any unvested restricted shares. Annual CFFO per share for all periods is calculated as the sum of the quarterly amounts for the year.
Facility Operating Income
Facility Operating Income is not a measurement of operating performance calculated in accordance with GAAP and should not be considered in isolation as a substitute for net income, income from operations, or cash flows provided by or used in operations, as determined in accordance with GAAP. We define Facility Operating Income as net income (loss) before provision (benefit) for income taxes, non-operating (income) expense items, (gain) loss on sale or acquisition of communities (including gain (loss) on facility lease termination), depreciation and amortization (including non-cash impairment charges), facility lease expense, general and administrative expense, including non-cash stock-based compensation expense, change in future service obligation, amortization of deferred entrance fee revenue and management fees.
We believe Facility Operating Income is useful to investors in evaluating our facility operating performance for the following reasons:
- It is helpful in identifying trends in our day-to-day facility performance;
- It provides an assessment of our revenue generation and expense management; and
- It provides an indicator to determine if adjustments to current spending decisions are needed.
The table below reconciles Facility Operating Income from net loss for the three months ended March 31, 2012 and 2011 (in thousands):
| Three Months Ended March 31, |
||||
| 2012 |
2011 |
|||
| Net loss |
$ (10,338) |
$ (12,305) |
||
| Provision (benefit) for income taxes |
1,061 |
(11,154) |
||
| Equity in earnings of unconsolidated ventures |
(99) |
(266) |
||
| Loss on extinguishment of debt, net |
221 |
2,894 |
||
| Other non-operating loss (income) |
111 |
(817) |
||
| Interest expense: |
||||
| Debt |
24,340 |
23,553 |
||
| Capitalized lease obligation |
7,710 |
8,008 |
||
| Amortization of deferred financing costs and debt discount |
4,473 |
2,704 |
||
| Change in fair value of derivatives and amortization |
233 |
8 |
||
| Interest income |
(852) |
(625) |
||
| Income from operations |
26,860 |
12,000 |
||
| Gain on facility lease termination |
(2,780) |
- |
||
| Depreciation and amortization |
63,344 |
71,782 |
||
| Asset impairment |
1,083 |
14,846 |
||
| Loss on acquisition |
636 |
- |
||
| Facility lease expense |
71,445 |
66,315 |
||
| General and administrative (including non-cash |
||||
| stock-based compensation expense) |
44,973 |
33,543 |
||
| Amortization of entrance fees |
(6,403) |
(5,762) |
||
| Management fees |
(7,924) |
(1,405) |
||
| Facility Operating Income |
$ 191,234 |
$ 191,319 |
||
SOURCE Brookdale Senior Living Inc.


Share this article