Caterpillar Reports Second-Quarter 2020 Results

DEERFIELD, Ill., July 31, 2020 /PRNewswire/ --
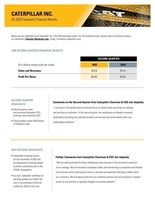
- Second-quarter sales and revenues decreased 31%; profit per share declined 70%
- Strong balance sheet; $8.8 billion of enterprise cash
Second Quarter |
|||
($ in billions except profit per share) |
2020 |
2019 |
|
Sales and Revenues |
$10.0 |
$14.4 |
|
Profit Per Share |
$0.84 |
$2.83 |
|
Caterpillar Inc. (NYSE: CAT) today announced second-quarter 2020 sales and revenues of $10.0 billion, a 31% decrease compared with $14.4 billion in the second quarter of 2019. The decline was due to lower sales volume driven by lower end-user demand and the impact from changes in dealer inventories. Dealers decreased machine and engine inventories about $1.4 billion during the second quarter of 2020, compared with an increase of about $500 million during the second quarter of 2019.
Second-quarter 2020 profit per share was $0.84, compared with $2.83 profit per share in the second quarter of 2019. Profit per share in the second quarter of 2020 included pre-tax remeasurement losses of $122 million, or $0.19 per share, resulting from the settlements of pension obligations.
Operating profit margin was 7.8% for the second quarter of 2020, compared with 15.3% for the second quarter of 2019.
For the first half of 2020, enterprise operating cash flow was $2.5 billion. Caterpillar ended the second quarter with $8.8 billion of enterprise cash and $18.5 billion of available liquidity sources. In July, Cat Financial issued $1.5 billion of new three-year and 18-month medium-term notes to supplement its liquidity position.
Response to COVID-19 and Global Business Conditions
"I am proud of the global team's continued focus on safety while executing our strategy and serving our customers," said Caterpillar Chairman and CEO Jim Umpleby. "In the second quarter, our employees and dealers remained dedicated to providing the essential products and services the world needs under very challenging conditions."
Operational Status
Caterpillar continues to implement safeguards in its facilities to protect team members, including increased frequency of cleaning and disinfecting, social distancing practices and other measures consistent with specific regulatory requirements and guidance from health authorities.
As of mid-July 2020, globally and across Caterpillar's three primary segments, nearly all of the company's primary production facilities continued to operate. This continues to fluctuate as conditions warrant, including the pace of economic recovery and the potential for additional COVID-related temporary shutdowns.
The company has continued to take actions to reduce costs and prioritize its spending to provide for investment in services and expanded offerings, key elements of its strategy for profitable growth, which was introduced in 2017.
Outlook
Caterpillar's financial results for the remainder of 2020 will be impacted by continued global economic uncertainty due to the COVID-19 pandemic. As such, Caterpillar withdrew its earnings guidance on March 26 and is not providing a financial outlook for 2020 at this time.
"We are well positioned for these challenging times because of the successful execution of our strategy," said Umpleby. "We are focused on employee safety and maintaining a competitive and flexible cost structure while continuing to invest in services and expanded offerings to better serve our customers. We will adjust production as conditions warrant and are prepared to respond quickly to any positive or negative changes in customer demand."
CONSOLIDATED RESULTS
Consolidated Sales and Revenues
Consolidated Sales and Revenues Comparison
Second Quarter 2020 vs. Second Quarter 2019
To access this chart, go to https://investors.caterpillar.com/financials/quarterly-results/default.aspx for the downloadable version of Caterpillar second-quarter 2020 earnings.
The chart above graphically illustrates reasons for the change in consolidated sales and revenues between the second quarter of 2019 (at left) and the second quarter of 2020 (at right). Caterpillar management utilizes these charts internally to visually communicate with the company's Board of Directors and employees.
Total sales and revenues for the second quarter of 2020 were $9.997 billion, a decrease of $4.435 billion, or 31%, compared with $14.432 billion in the second quarter of 2019. The decline was due to lower sales volume driven by lower end-user demand and the impact from changes in dealer inventories. Dealers decreased machine and engine inventories about $1.4 billion during the second quarter of 2020, compared with an increase of about $500 million during the second quarter of 2019. The changes in dealer inventories came primarily in Construction Industries and Resource Industries.
Unfavorable price realization also contributed to the sales decline due to the geographic mix of sales and competitive market conditions in China. Sales were lower across all regions and in the three primary segments.
Sales and Revenues by Segment |
|||||||||||||||||||||||||||||
(Millions of dollars) |
Second |
Sales Volume |
Price Realization |
Currency |
Inter- |
Second |
$ Change |
% Change |
|||||||||||||||||||||
Construction Industries |
$ |
6,467 |
$ |
(2,075) |
$ |
(258) |
$ |
(81) |
$ |
(5) |
$ |
4,048 |
$ |
(2,419) |
(37%) |
||||||||||||||
Resource Industries |
2,819 |
(933) |
(23) |
(45) |
8 |
1,826 |
(993) |
(35%) |
|||||||||||||||||||||
Energy & Transportation |
5,486 |
(942) |
23 |
(64) |
(354) |
4,149 |
(1,337) |
(24%) |
|||||||||||||||||||||
All Other Segment |
125 |
(5) |
— |
(1) |
(4) |
115 |
(10) |
(8%) |
|||||||||||||||||||||
Corporate Items and Eliminations |
(1,226) |
43 |
(1) |
1 |
355 |
(828) |
398 |
||||||||||||||||||||||
Machinery, Energy & Transportation |
13,671 |
(3,912) |
(259) |
(190) |
— |
9,310 |
(4,361) |
(32%) |
|||||||||||||||||||||
Financial Products Segment |
873 |
— |
— |
— |
(110) |
763 |
(110) |
(13%) |
|||||||||||||||||||||
Corporate Items and Eliminations |
(112) |
— |
— |
— |
36 |
(76) |
36 |
||||||||||||||||||||||
Financial Products Revenues |
761 |
— |
— |
— |
(74) |
687 |
(74) |
(10%) |
|||||||||||||||||||||
Consolidated Sales and Revenues |
$ |
14,432 |
$ |
(3,912) |
$ |
(259) |
$ |
(190) |
$ |
(74) |
$ |
9,997 |
$ |
(4,435) |
(31%) |
||||||||||||||
Sales and Revenues by Geographic Region |
|||||||||||||||||||||||||||||||||||||||||
North America |
Latin America |
EAME |
Asia/Pacific |
External Sales |
Inter-Segment |
Total Sales |
|||||||||||||||||||||||||||||||||||
(Millions of dollars) |
$ |
% Chg |
$ |
% Chg |
$ |
% Chg |
$ |
% Chg |
$ |
% Chg |
$ |
% Chg |
$ |
% Chg |
|||||||||||||||||||||||||||
Second Quarter 2020 |
|||||||||||||||||||||||||||||||||||||||||
Construction Industries |
$ |
1,604 |
(54%) |
$ |
212 |
(46%) |
$ |
933 |
(16%) |
$ |
1,283 |
(10%) |
$ |
4,032 |
(37%) |
$ |
16 |
(24%) |
$ |
4,048 |
(37%) |
||||||||||||||||||||
Resource Industries |
507 |
(52%) |
270 |
(40%) |
379 |
(15%) |
554 |
(27%) |
1,710 |
(37%) |
116 |
7% |
1,826 |
(35%) |
|||||||||||||||||||||||||||
Energy & Transportation |
1,816 |
(21%) |
197 |
(39%) |
929 |
(20%) |
599 |
(19%) |
3,541 |
(22%) |
608 |
(37%) |
4,149 |
(24%) |
|||||||||||||||||||||||||||
All Other Segment |
7 |
(50%) |
1 |
—% |
5 |
25% |
15 |
—% |
28 |
(18%) |
87 |
(4%) |
115 |
(8%) |
|||||||||||||||||||||||||||
Corporate Items and Eliminations |
2 |
(1) |
— |
(2) |
(1) |
(827) |
(828) |
||||||||||||||||||||||||||||||||||
Machinery, Energy & Transportation |
3,936 |
(42%) |
679 |
(42%) |
2,246 |
(17%) |
2,449 |
(17%) |
9,310 |
(32%) |
— |
—% |
9,310 |
(32%) |
|||||||||||||||||||||||||||
Financial Products Segment |
493 |
(12%) |
60 |
(21%) |
96 |
(6%) |
114 |
(14%) |
763 |
(13%) |
— |
—% |
763 |
(13%) |
|||||||||||||||||||||||||||
Corporate Items and Eliminations |
(43) |
(9) |
(9) |
(15) |
(76) |
— |
(76) |
||||||||||||||||||||||||||||||||||
Financial Products Revenues |
450 |
(8%) |
51 |
(22%) |
87 |
(6%) |
99 |
(12%) |
687 |
(10%) |
— |
—% |
687 |
(10%) |
|||||||||||||||||||||||||||
Consolidated Sales and Revenues |
$ |
4,386 |
(40%) |
$ |
730 |
(41%) |
$ |
2,333 |
(17%) |
$ |
2,548 |
(17%) |
$ |
9,997 |
(31%) |
$ |
— |
—% |
$ |
9,997 |
(31%) |
||||||||||||||||||||
Second Quarter 2019 |
|||||||||||||||||||||||||||||||||||||||||
Construction Industries |
$ |
3,513 |
$ |
392 |
$ |
1,108 |
$ |
1,433 |
$ |
6,446 |
$ |
21 |
$ |
6,467 |
|||||||||||||||||||||||||||
Resource Industries |
1,058 |
448 |
446 |
759 |
2,711 |
108 |
2,819 |
||||||||||||||||||||||||||||||||||
Energy & Transportation |
2,297 |
325 |
1,160 |
742 |
4,524 |
962 |
5,486 |
||||||||||||||||||||||||||||||||||
All Other Segment |
14 |
1 |
4 |
15 |
34 |
91 |
125 |
||||||||||||||||||||||||||||||||||
Corporate Items and Eliminations |
(39) |
(2) |
(5) |
2 |
(44) |
(1,182) |
(1,226) |
||||||||||||||||||||||||||||||||||
Machinery, Energy & Transportation |
6,843 |
1,164 |
2,713 |
2,951 |
13,671 |
— |
13,671 |
||||||||||||||||||||||||||||||||||
Financial Products Segment |
563 |
76 |
102 |
132 |
873 |
— |
873 |
||||||||||||||||||||||||||||||||||
Corporate Items and Eliminations |
(72) |
(11) |
(9) |
(20) |
(112) |
— |
(112) |
||||||||||||||||||||||||||||||||||
Financial Products Revenues |
491 |
65 |
93 |
112 |
761 |
— |
761 |
||||||||||||||||||||||||||||||||||
Consolidated Sales and Revenues |
$ |
7,334 |
$ |
1,229 |
$ |
2,806 |
$ |
3,063 |
$ |
14,432 |
$ |
— |
$ |
14,432 |
|||||||||||||||||||||||||||
Consolidated Operating Profit
Consolidated Operating Profit Comparison
Second Quarter 2020 vs. Second Quarter 2019
To access this chart, go to https://investors.caterpillar.com/financials/quarterly-results/default.aspx for the downloadable version of Caterpillar second-quarter 2020 earnings.
The chart above graphically illustrates reasons for the change in consolidated operating profit between the second quarter of 2019 (at left) and the second quarter of 2020 (at right). Caterpillar management utilizes these charts internally to visually communicate with the company's Board of Directors and employees. The bar titled Other includes consolidating adjustments and Machinery, Energy & Transportation's other operating (income) expenses.
Operating profit for the second quarter of 2020 was $784 million, a decrease of $1.429 billion, or 65%, compared with $2.213 billion in the second quarter of 2019. The decrease was due to lower sales volume and unfavorable price realization, partially offset by favorable manufacturing costs and lower selling, general and administrative (SG&A) and research and development (R&D) expenses.
Favorable manufacturing costs were mostly driven by lower period manufacturing costs. Both period manufacturing costs and SG&A/R&D expenses benefited from reduced short-term incentive compensation expense and other cost reductions related to lower sales volumes.
Profit (Loss) by Segment |
||||||||||||||
(Millions of dollars) |
Second |
Second |
$ Change |
% Change |
||||||||||
Construction Industries |
$ |
518 |
$ |
1,247 |
$ |
(729) |
(58%) |
|||||||
Resource Industries |
152 |
481 |
(329) |
(68%) |
||||||||||
Energy & Transportation |
624 |
886 |
(262) |
(30%) |
||||||||||
All Other Segment |
(3) |
11 |
(14) |
n/a |
||||||||||
Corporate Items and Eliminations |
(542) |
(441) |
(101) |
|||||||||||
Machinery, Energy & Transportation |
749 |
2,184 |
(1,435) |
(66%) |
||||||||||
Financial Products Segment |
148 |
193 |
(45) |
(23%) |
||||||||||
Corporate Items and Eliminations |
(38) |
(50) |
12 |
|||||||||||
Financial Products |
110 |
143 |
(33) |
(23%) |
||||||||||
Consolidating Adjustments |
(75) |
(114) |
39 |
|||||||||||
Consolidated Operating Profit |
$ |
784 |
$ |
2,213 |
$ |
(1,429) |
(65%) |
|||||||
Other Profit/Loss and Tax Items
- Other income (expense) in the second quarter of 2020 was income of $29 million, compared with income of $68 million in the second quarter of 2019. The change was primarily due to the unfavorable impact of pension and other postemployment benefit (OPEB) plans, including $122 million of remeasurement losses resulting from the settlements of pension obligations, partially offset by favorable impacts from foreign currency exchange gains (losses), primarily due to the Australian dollar.
- The provision for income taxes for the second quarter of 2020 reflected an estimated annual tax rate of 31%, excluding a $21 million discrete tax benefit related to the $122 million of remeasurement losses resulting from the settlements of pension obligations. The tax rate was 26% for the second quarter of 2019. The increase in the estimated annual tax rate was primarily related to changes in the expected geographic mix of profits from a tax perspective for 2020, including the impact of U.S. tax on non-U.S. earnings as a result of U.S. tax reform.
CONSTRUCTION INDUSTRIES |
|||||||||||||||||||||||||||||||
(Millions of dollars) |
|||||||||||||||||||||||||||||||
Segment Sales |
|||||||||||||||||||||||||||||||
Second |
Sales |
Price |
Currency |
Inter- |
Second |
$ Change |
% Change |
||||||||||||||||||||||||
Total Sales |
$ |
6,467 |
$ |
(2,075) |
$ |
(258) |
$ |
(81) |
$ |
(5) |
$ |
4,048 |
$ |
(2,419) |
(37%) |
||||||||||||||||
Sales by Geographic Region |
|||||||||||||||||||||||||||||||
Second |
Second |
$ Change |
% Change |
||||||||||||||||||||||||||||
North America |
$ |
1,604 |
$ |
3,513 |
$ |
(1,909) |
(54%) |
||||||||||||||||||||||||
Latin America |
212 |
392 |
(180) |
(46%) |
|||||||||||||||||||||||||||
EAME |
933 |
1,108 |
(175) |
(16%) |
|||||||||||||||||||||||||||
Asia/Pacific |
1,283 |
1,433 |
(150) |
(10%) |
|||||||||||||||||||||||||||
External Sales |
4,032 |
6,446 |
(2,414) |
(37%) |
|||||||||||||||||||||||||||
Inter-segment |
16 |
21 |
(5) |
(24%) |
|||||||||||||||||||||||||||
Total Sales |
$ |
4,048 |
$ |
6,467 |
$ |
(2,419) |
(37%) |
||||||||||||||||||||||||
Segment Profit |
|||||||||||||||||||||||||||||||
Second |
Second |
Change |
% Change |
||||||||||||||||||||||||||||
Segment Profit |
$ |
518 |
$ |
1,247 |
$ |
(729) |
(58%) |
||||||||||||||||||||||||
Segment Profit Margin |
12.8% |
19.3% |
(6.5 pts) |
||||||||||||||||||||||||||||
Construction Industries' total sales were $4.048 billion in the second quarter of 2020, a decrease of $2.419 billion, or 37%, compared with $6.467 billion in the second quarter of 2019. The decrease was due to lower sales volume, driven by lower end-user demand and the impact from changes in dealer inventories. In all regions, dealers decreased inventories during the second quarter of 2020, compared with an increase during the second quarter of 2019. Unfavorable price realization also contributed to the sales decline due to the geographic mix of sales and competitive market conditions in China.
- In North America, sales decreased mostly due to lower sales volume driven by lower end-user demand and the impact from changes in dealer inventories. The lower end-user demand was driven primarily by pipeline and road construction.
- Sales declined in Latin America primarily due to lower end-user demand across the region, the impact from changes in dealer inventories and unfavorable currency impacts from a weaker Brazilian real.
- In EAME, sales decreased mostly because of lower sales volume across the region, driven by lower end-user demand and the impact from changes in dealer inventories.
- Sales declined in Asia/Pacific primarily due to unfavorable price realization and currency impacts from a weaker Chinese yuan. In China, sales were about flat as higher end-user demand was mostly offset by the impact of changes in dealer inventories and unfavorable price realization.
Construction Industries' profit was $518 million in the second quarter of 2020, a decrease of $729 million, or 58%, compared with $1.247 billion in the second quarter of 2019. The decrease was mainly due to lower sales volume and unfavorable price realization, partially offset by favorable manufacturing costs and lower SG&A/R&D expenses. Favorable manufacturing costs were primarily attributed to lower period manufacturing costs. Both period manufacturing costs and SG&A/R&D expenses benefited from reduced short-term incentive compensation expense and other cost reductions related to lower sales volumes.
RESOURCE INDUSTRIES |
|||||||||||||||||||||||||||||||
(Millions of dollars) |
|||||||||||||||||||||||||||||||
Segment Sales |
|||||||||||||||||||||||||||||||
Second |
Sales |
Price |
Currency |
Inter- |
Second |
$ Change |
% Change |
||||||||||||||||||||||||
Total Sales |
$ |
2,819 |
$ |
(933) |
$ |
(23) |
$ |
(45) |
$ |
8 |
$ |
1,826 |
$ |
(993) |
(35)% |
||||||||||||||||
Sales by Geographic Region |
|||||||||||||||||||||||||||||||
Second |
Second |
$ Change |
% Change |
||||||||||||||||||||||||||||
North America |
$ |
507 |
$ |
1,058 |
$ |
(551) |
(52%) |
||||||||||||||||||||||||
Latin America |
270 |
448 |
(178) |
(40%) |
|||||||||||||||||||||||||||
EAME |
379 |
446 |
(67) |
(15%) |
|||||||||||||||||||||||||||
Asia/Pacific |
554 |
759 |
(205) |
(27%) |
|||||||||||||||||||||||||||
External Sales |
1,710 |
2,711 |
(1,001) |
(37%) |
|||||||||||||||||||||||||||
Inter-segment |
116 |
108 |
8 |
7% |
|||||||||||||||||||||||||||
Total Sales |
$ |
1,826 |
$ |
2,819 |
$ |
(993) |
(35%) |
||||||||||||||||||||||||
Segment Profit |
|||||||||||||||||||||||||||||||
Second |
Second |
Change |
% Change |
||||||||||||||||||||||||||||
Segment Profit |
$ |
152 |
$ |
481 |
$ |
(329) |
(68%) |
||||||||||||||||||||||||
Segment Profit Margin |
8.3% |
17.1% |
(8.8 pts) |
||||||||||||||||||||||||||||
Resource Industries' total sales were $1.826 billion in the second quarter of 2020, a decrease of $993 million, or 35%, compared with $2.819 billion in the second quarter of 2019. The decrease was due to lower sales volume, driven by changes in dealer inventories and lower end-user demand. Dealers decreased inventories during the second quarter of 2020, compared with an increase during the second quarter of 2019. Lower end-user demand was primarily driven by equipment supporting non-residential construction and quarry and aggregates. Mining equipment end-user demand was down in the quarter, though to a lesser extent. The company's mining customers faced production disruptions impacting machine utilization and aftermarket parts demand.
Resource Industries' profit was $152 million in the second quarter of 2020, a decrease of $329 million, or 68%, compared with $481 million in the second quarter of 2019. The decrease was mainly because of lower sales volume, partially offset by favorable manufacturing costs. Favorable manufacturing costs were mostly due to lower period manufacturing costs driven by lower short-term incentive compensation expense, other cost-reduction actions implemented in response to lower sales volumes and the benefits of prior restructuring programs.
ENERGY & TRANSPORTATION |
|||||||||||||||||||||||||||||||
(Millions of dollars) |
|||||||||||||||||||||||||||||||
Segment Sales |
|||||||||||||||||||||||||||||||
Second |
Sales |
Price |
Currency |
Inter- |
Second |
$ Change |
% Change |
||||||||||||||||||||||||
Total Sales |
$ |
5,486 |
$ |
(942) |
$ |
23 |
$ |
(64) |
$ |
(354) |
$ |
4,149 |
$ |
(1,337) |
(24%) |
||||||||||||||||
Sales by Application |
|||||||||||||||||||||||||||||||
Second |
Second |
$ Change |
% Change |
||||||||||||||||||||||||||||
Oil and Gas |
$ |
1,027 |
$ |
1,305 |
$ |
(278) |
(21%) |
||||||||||||||||||||||||
Power Generation |
895 |
1,021 |
(126) |
(12%) |
|||||||||||||||||||||||||||
Industrial |
678 |
957 |
(279) |
(29%) |
|||||||||||||||||||||||||||
Transportation |
941 |
1,241 |
(300) |
(24%) |
|||||||||||||||||||||||||||
External Sales |
3,541 |
4,524 |
(983) |
(22%) |
|||||||||||||||||||||||||||
Inter-segment |
608 |
962 |
(354) |
(37%) |
|||||||||||||||||||||||||||
Total Sales |
$ |
4,149 |
$ |
5,486 |
$ |
(1,337) |
(24%) |
||||||||||||||||||||||||
Segment Profit |
|||||||||||||||||||||||||||||||
Second |
Second |
Change |
% Change |
||||||||||||||||||||||||||||
Segment Profit |
$ |
624 |
$ |
886 |
$ |
(262) |
(30%) |
||||||||||||||||||||||||
Segment Profit Margin |
15.0% |
16.2% |
(1.2 pts) |
||||||||||||||||||||||||||||
Energy & Transportation's total sales were $4.149 billion in the second quarter of 2020, a decrease of $1.337 billion, or 24%, compared with $5.486 billion in the second quarter of 2019. Sales declined across all applications and inter-segment engine sales.
- Oil and Gas – Sales decreased mainly due to lower demand in North America for reciprocating engines used in gas compression and decreased sales of engine aftermarket parts, partially offset by higher sales of turbines and turbine-related services.
- Power Generation – Sales decreased primarily due to lower sales volume in small reciprocating engine applications and engine aftermarket parts.
- Industrial – Sales decreased due to lower demand across all regions.
- Transportation – Sales declined in rail due to lower deliveries of locomotives and related services and in marine applications, primarily in EAME and Asia/Pacific.
Energy & Transportation's profit was $624 million in the second quarter of 2020, a decrease of $262 million, or 30%, compared with $886 million in the second quarter of 2019. The decrease was due to lower sales volume, partially offset by lower manufacturing costs and SG&A/R&D expenses. Manufacturing costs and SG&A/R&D expenses were both impacted by a reduction in short-term incentive compensation expense and other cost reductions related to lower sales volumes.
FINANCIAL PRODUCTS SEGMENT |
|||||||||||||||||||||||
(Millions of dollars) |
|||||||||||||||||||||||
Revenues by Geographic Region |
|||||||||||||||||||||||
Second |
Second |
$ Change |
% Change |
||||||||||||||||||||
North America |
$ |
493 |
$ |
563 |
$ |
(70) |
(12%) |
||||||||||||||||
Latin America |
60 |
76 |
(16) |
(21%) |
|||||||||||||||||||
EAME |
96 |
102 |
(6) |
(6%) |
|||||||||||||||||||
Asia/Pacific |
114 |
132 |
(18) |
(14%) |
|||||||||||||||||||
Total Revenues |
$ |
763 |
$ |
873 |
$ |
(110) |
(13%) |
||||||||||||||||
Segment Profit |
|||||||||||||||||||||||
Second |
Second |
Change |
% Change |
||||||||||||||||||||
Segment Profit |
$ |
148 |
$ |
193 |
$ |
(45) |
(23%) |
||||||||||||||||
Financial Products' segment revenues were $763 million in the second quarter of 2020, a decrease of $110 million, or 13%, from the second quarter of 2019. The decrease was primarily because of lower average financing rates and lower average earning assets across all regions.
Financial Products' segment profit was $148 million in the second quarter of 2020, compared with $193 million in the second quarter of 2019. The decrease was due to lower net yield on average earning assets, lower average earning assets and higher provision for credit losses at Cat Financial. These unfavorable impacts were partially offset by a reduction in SG&A expenses primarily due to lower short-term incentive compensation and employee benefit expenses and a favorable impact from equity securities in Insurance Services.
At the end of the second quarter of 2020, past dues at Cat Financial were 3.74%, compared with 3.38% at the end of the second quarter of 2019. Past dues increased primarily due to the impact of the COVID-19 pandemic. Write-offs, net of recoveries, were $30 million for the second quarter of 2020, compared with $74 million for the second quarter of 2019. As of June 30, 2020, Cat Financial's allowance for credit losses totaled $515 million, or 1.92% of finance receivables, compared with $457 million, or 1.69% of finance receivables at March 31, 2020. The increase in allowance for credit losses was driven in part by expectations of the lingering impact from COVID-19. The allowance for credit losses at year-end 2019 was $424 million, or 1.50% of finance receivables.
Corporate Items and Eliminations
Expense for corporate items and eliminations was $580 million in the second quarter of 2020, an increase of $89 million from the second quarter of 2019, primarily due to an unfavorable change in fair value adjustments related to deferred compensation plans and segment reporting methodology differences.
Notes
I. Glossary of terms is included on the Caterpillar website at https://investors.caterpillar.com/overview/default.aspx.
II. End-user demand is demonstrated by the company's Rolling 3 Month Retail Sales Statistics filed in a Form 8-K on Friday, July 31, 2020.
III. Information on non-GAAP financial measures is included in the appendix on page 12.
IV. Some amounts within this report are rounded to the millions or billions and may not add.
V. Caterpillar will conduct a teleconference and live webcast, with a slide presentation, beginning at 7:30 a.m. Central Time on Friday, July 31, 2020, to discuss its 2020 second-quarter results. The accompanying slides will be available before the webcast on the Caterpillar website at https://investors.caterpillar.com/events-presentations/default.aspx.
About Caterpillar
Since 1925, Caterpillar Inc. has been helping our customers build a better world – making sustainable progress possible and driving positive change on every continent. With 2019 sales and revenues of $53.8 billion, Caterpillar is the world's leading manufacturer of construction and mining equipment, diesel and natural gas engines, industrial gas turbines and diesel-electric locomotives. Services offered throughout the product life cycle, cutting-edge technology and decades of product expertise set Caterpillar apart, providing exceptional value to help our customers succeed. The company principally operates through three primary segments – Construction Industries, Resource Industries and Energy & Transportation – and provides financing and related services through its Financial Products segment. For more information, visit caterpillar.com. To connect on social media, visit caterpillar.com/social-media.
Caterpillar's latest financial results are also available online:
https://investors.caterpillar.com/overview/default.aspx
https://investors.caterpillar.com/financials/quarterly-results/default.aspx (live broadcast/replays of quarterly conference call)
Forward-Looking Statements
Certain statements in this press release relate to future events and expectations and are forward-looking statements within the meaning of the Private Securities Litigation Reform Act of 1995. Words such as "believe," "estimate," "will be," "will," "would," "expect," "anticipate," "plan," "forecast," "target," "guide," "project," "intend," "could," "should" or other similar words or expressions often identify forward-looking statements. All statements other than statements of historical fact are forward-looking statements, including, without limitation, statements regarding our outlook, projections, forecasts or trend descriptions. These statements do not guarantee future performance and speak only as of the date they are made, and we do not undertake to update our forward-looking statements.
Caterpillar's actual results may differ materially from those described or implied in our forward-looking statements based on a number of factors, including, but not limited to: (i) global and regional economic conditions and economic conditions in the industries we serve; (ii) commodity price changes, material price increases, fluctuations in demand for our products or significant shortages of material; (iii) government monetary or fiscal policies; (iv) political and economic risks, commercial instability and events beyond our control in the countries in which we operate; (v) international trade policies and their impact on demand for our products and our competitive position, including the imposition of new tariffs or changes in existing tariff rates; (vi) our ability to develop, produce and market quality products that meet our customers' needs; (vii) the impact of the highly competitive environment in which we operate on our sales and pricing; (viii) information technology security threats and computer crime; (ix) inventory management decisions and sourcing practices of our dealers and our OEM customers; (x) a failure to realize, or a delay in realizing, all of the anticipated benefits of our acquisitions, joint ventures or divestitures; (xi) union disputes or other employee relations issues; (xii) adverse effects of unexpected events; (xiii) disruptions or volatility in global financial markets limiting our sources of liquidity or the liquidity of our customers, dealers and suppliers; (xiv) failure to maintain our credit ratings and potential resulting increases to our cost of borrowing and adverse effects on our cost of funds, liquidity, competitive position and access to capital markets; (xv) our Financial Products segment's risks associated with the financial services industry; (xvi) changes in interest rates or market liquidity conditions; (xvii) an increase in delinquencies, repossessions or net losses of Cat Financial's customers; (xviii) currency fluctuations; (xix) our or Cat Financial's compliance with financial and other restrictive covenants in debt agreements; (xx) increased pension plan funding obligations; (xxi) alleged or actual violations of trade or anti-corruption laws and regulations; (xxii) additional tax expense or exposure, including the impact of U.S. tax reform; (xxiii) significant legal proceedings, claims, lawsuits or government investigations; (xxiv) new regulations or changes in financial services regulations; (xxv) compliance with environmental laws and regulations; (xxvi) the duration and geographic spread of, business disruptions caused by, and the overall global economic impact of, the COVID-19 pandemic; and (xxvii) other factors described in more detail in Caterpillar's Forms 10-Q, 10-K and other filings with the Securities and Exchange Commission.
APPENDIX
NON-GAAP FINANCIAL MEASURES
The following definitions are provided for the non-GAAP financial measures. These non-GAAP financial measures have no standardized meaning prescribed by U.S. GAAP and therefore are unlikely to be comparable to the calculation of similar measures for other companies. Management does not intend these items to be considered in isolation or as a substitute for the related GAAP measures.
Adjusted Profit Per Share
The company believes it is important to separately quantify the profit impact of a significant item in order for the company's results to be meaningful to readers. This item is remeasurement losses resulting from the settlements of pension obligations in the second quarter of 2020. The company does not consider this item indicative of earnings from ongoing business activities and believes the non-GAAP measure provides investors with useful perspective on underlying business results and trends and aids with assessing the company's period-over-period results. The company intends to discuss adjusted profit per share for the fourth quarter and full-year 2020, excluding mark-to-market gains or losses for remeasurement of pension and other postemployment benefit plans along with any other discrete items.
Reconciliations of adjusted profit per share to the most directly comparable GAAP measure, diluted profit per share, are as follows:
Second Quarter |
|||||||
2020 |
2019 |
||||||
Profit per share |
$ |
0.84 |
$ |
2.83 |
|||
Per share remeasurement losses of pension obligations1 |
$ |
0.19 |
$ |
— |
|||
Adjusted profit per share |
$ |
1.03 |
$ |
2.83 |
|||
1 At statutory tax rates. |
||||||||||
Note: On March 26, 2020, the company withdrew its previous financial outlook due to the continued global economic uncertainty related to the COVID-19 pandemic. |
||||||||||
Machinery, Energy & Transportation
Caterpillar defines Machinery, Energy & Transportation as it is presented in the supplemental data as Caterpillar Inc. and its subsidiaries with Financial Products accounted for on the equity basis. Machinery, Energy & Transportation information relates to the design, manufacture and marketing of Caterpillar products. Financial Products' information relates to the financing to customers and dealers for the purchase and lease of Caterpillar and other equipment. The nature of these businesses is different, especially with regard to the financial position and cash flow items. Caterpillar management utilizes this presentation internally to highlight these differences. The company also believes this presentation will assist readers in understanding Caterpillar's business. Pages 13-23 reconcile Machinery, Energy & Transportation with Financial Products on the equity basis to Caterpillar Inc. consolidated financial information.
Caterpillar Inc. Condensed Consolidated Statement of Results of Operations (Unaudited) (Dollars in millions except per share data) |
|||||||||||||||
Three Months Ended June 30, |
Six Months Ended June 30, |
||||||||||||||
2020 |
2019 |
2020 |
2019 |
||||||||||||
Sales and revenues: |
|||||||||||||||
Sales of Machinery, Energy & Transportation |
$ |
9,310 |
$ |
13,671 |
$ |
19,224 |
$ |
26,395 |
|||||||
Revenues of Financial Products |
687 |
761 |
1,408 |
1,503 |
|||||||||||
Total sales and revenues |
9,997 |
14,432 |
20,632 |
27,898 |
|||||||||||
Operating costs: |
|||||||||||||||
Cost of goods sold |
7,113 |
9,941 |
14,379 |
18,944 |
|||||||||||
Selling, general and administrative expenses |
1,179 |
1,309 |
2,300 |
2,628 |
|||||||||||
Research and development expenses |
341 |
441 |
697 |
876 |
|||||||||||
Interest expense of Financial Products |
149 |
192 |
324 |
382 |
|||||||||||
Other operating (income) expenses |
431 |
336 |
744 |
648 |
|||||||||||
Total operating costs |
9,213 |
12,219 |
18,444 |
23,478 |
|||||||||||
Operating profit |
784 |
2,213 |
2,188 |
4,420 |
|||||||||||
Interest expense excluding Financial Products |
135 |
103 |
248 |
206 |
|||||||||||
Other income (expense) |
29 |
68 |
251 |
228 |
|||||||||||
Consolidated profit before taxes |
678 |
2,178 |
2,191 |
4,442 |
|||||||||||
Provision (benefit) for income taxes |
227 |
565 |
652 |
952 |
|||||||||||
Profit of consolidated companies |
451 |
1,613 |
1,539 |
3,490 |
|||||||||||
Equity in profit (loss) of unconsolidated affiliated companies |
8 |
6 |
13 |
13 |
|||||||||||
Profit of consolidated and affiliated companies |
459 |
1,619 |
1,552 |
3,503 |
|||||||||||
Less: Profit (loss) attributable to noncontrolling interests |
1 |
(1) |
2 |
2 |
|||||||||||
Profit 1 |
$ |
458 |
$ |
1,620 |
$ |
1,550 |
$ |
3,501 |
|||||||
Profit per common share |
$ |
0.84 |
$ |
2.85 |
$ |
2.85 |
$ |
6.14 |
|||||||
Profit per common share — diluted 2 |
$ |
0.84 |
$ |
2.83 |
$ |
2.83 |
$ |
6.08 |
|||||||
Weighted-average common shares outstanding (millions) |
|||||||||||||||
– Basic |
541.5 |
567.8 |
544.5 |
569.9 |
|||||||||||
– Diluted 2 |
544.5 |
573.1 |
548.2 |
575.8 |
|||||||||||
1 |
Profit attributable to common shareholders. |
2 |
Diluted by assumed exercise of stock-based compensation awards using the treasury stock method. |
Caterpillar Inc Condensed Consolidated Statement of Financial Position (Unaudited) (Millions of dollars) |
|||||||
June 30, 2020 |
December 31, 2019 |
||||||
Assets |
|||||||
Current assets: |
|||||||
Cash and short-term investments |
$ |
8,784 |
$ |
8,284 |
|||
Receivables – trade and other |
7,134 |
8,568 |
|||||
Receivables – finance |
8,781 |
9,336 |
|||||
Prepaid expenses and other current assets |
1,792 |
1,739 |
|||||
Inventories |
11,371 |
11,266 |
|||||
Total current assets |
37,862 |
39,193 |
|||||
Property, plant and equipment – net |
12,357 |
12,904 |
|||||
Long-term receivables – trade and other |
1,167 |
1,193 |
|||||
Long-term receivables – finance |
12,560 |
12,651 |
|||||
Noncurrent deferred and refundable income taxes |
1,459 |
1,411 |
|||||
Intangible assets |
1,420 |
1,565 |
|||||
Goodwill |
6,192 |
6,196 |
|||||
Other assets |
3,549 |
3,340 |
|||||
Total assets |
$ |
76,566 |
$ |
78,453 |
|||
Liabilities |
|||||||
Current liabilities: |
|||||||
Short-term borrowings: |
|||||||
-- Machinery, Energy & Transportation |
$ |
13 |
$ |
5 |
|||
-- Financial Products |
4,301 |
5,161 |
|||||
Accounts payable |
5,083 |
5,957 |
|||||
Accrued expenses |
3,547 |
3,750 |
|||||
Accrued wages, salaries and employee benefits |
958 |
1,629 |
|||||
Customer advances |
1,227 |
1,187 |
|||||
Dividends payable |
558 |
567 |
|||||
Other current liabilities |
2,143 |
2,155 |
|||||
Long-term debt due within one year: |
|||||||
-- Machinery, Energy & Transportation |
1,395 |
16 |
|||||
-- Financial Products |
6,006 |
6,194 |
|||||
Total current liabilities |
25,231 |
26,621 |
|||||
Long-term debt due after one year: |
|||||||
-- Machinery, Energy & Transportation |
9,729 |
9,141 |
|||||
-- Financial Products |
17,178 |
17,140 |
|||||
Liability for postemployment benefits |
6,285 |
6,599 |
|||||
Other liabilities |
4,366 |
4,323 |
|||||
Total liabilities |
62,789 |
63,824 |
|||||
Shareholders' equity |
|||||||
Common stock |
6,120 |
5,935 |
|||||
Treasury stock |
(25,412) |
(24,217) |
|||||
Profit employed in the business |
34,841 |
34,437 |
|||||
Accumulated other comprehensive income (loss) |
(1,815) |
(1,567) |
|||||
Noncontrolling interests |
43 |
41 |
|||||
Total shareholders' equity |
13,777 |
14,629 |
|||||
Total liabilities and shareholders' equity |
$ |
76,566 |
$ |
78,453 |
|||
Caterpillar Inc. Condensed Consolidated Statement of Cash Flow (Unaudited) (Millions of dollars) |
|||||||
Six Months Ended June 30, |
|||||||
2020 |
2019 |
||||||
Cash flow from operating activities: |
|||||||
Profit of consolidated and affiliated companies |
$ |
1,552 |
$ |
3,503 |
|||
Adjustments for non-cash items: |
|||||||
Depreciation and amortization |
1,222 |
1,288 |
|||||
Net gain on remeasurement of pension obligations |
(132) |
— |
|||||
Provision (benefit) for deferred income taxes |
(32) |
(34) |
|||||
Other |
674 |
440 |
|||||
Changes in assets and liabilities, net of acquisitions and divestitures: |
|||||||
Receivables – trade and other |
1,176 |
(166) |
|||||
Inventories |
(145) |
(487) |
|||||
Accounts payable |
(655) |
134 |
|||||
Accrued expenses |
(253) |
151 |
|||||
Accrued wages, salaries and employee benefits |
(648) |
(979) |
|||||
Customer advances |
(2) |
14 |
|||||
Other assets – net |
(7) |
(120) |
|||||
Other liabilities – net |
(229) |
(35) |
|||||
Net cash provided by (used for) operating activities |
2,521 |
3,709 |
|||||
Cash flow from investing activities: |
|||||||
Capital expenditures – excluding equipment leased to others |
(472) |
(479) |
|||||
Expenditures for equipment leased to others |
(526) |
(746) |
|||||
Proceeds from disposals of leased assets and property, plant and equipment |
382 |
422 |
|||||
Additions to finance receivables |
(6,712) |
(6,181) |
|||||
Collections of finance receivables |
6,801 |
5,902 |
|||||
Proceeds from sale of finance receivables |
31 |
119 |
|||||
Investments and acquisitions (net of cash acquired) |
(49) |
(3) |
|||||
Proceeds from sale of businesses and investments (net of cash sold) |
13 |
— |
|||||
Proceeds from sale of securities |
151 |
170 |
|||||
Investments in securities |
(369) |
(243) |
|||||
Other – net |
7 |
(40) |
|||||
Net cash provided by (used for) investing activities |
(743) |
(1,079) |
|||||
Cash flow from financing activities: |
|||||||
Dividends paid |
(1,125) |
(986) |
|||||
Common stock issued, including treasury shares reissued |
(10) |
39 |
|||||
Common shares repurchased |
(1,130) |
(2,105) |
|||||
Proceeds from debt issued (original maturities greater than three months) |
6,159 |
5,340 |
|||||
Payments on debt (original maturities greater than three months) |
(4,629) |
(4,901) |
|||||
Short-term borrowings – net (original maturities three months or less) |
(477) |
(436) |
|||||
Other – net |
(1) |
(2) |
|||||
Net cash provided by (used for) financing activities |
(1,213) |
(3,051) |
|||||
Effect of exchange rate changes on cash |
(66) |
(10) |
|||||
Increase (decrease) in cash and short-term investments and restricted cash |
499 |
(431) |
|||||
Cash and short-term investments and restricted cash at beginning of period |
8,292 |
7,890 |
|||||
Cash and short-term investments and restricted cash at end of period |
$ |
8,791 |
$ |
7,459 |
|||
All short-term investments, which consist primarily of highly liquid investments with original maturities of three months or less, are considered to be cash equivalents. |
Caterpillar Inc. Supplemental Data for Results of Operations For the Three Months Ended June 30, 2020 (Unaudited) (Millions of dollars) |
||||||||||||||||
Supplemental Consolidating Data |
||||||||||||||||
Consolidated |
Machinery, Energy & Transportation1 |
Financial Products |
Consolidating Adjustments |
|||||||||||||
Sales and revenues: |
||||||||||||||||
Sales of Machinery, Energy & Transportation |
$ |
9,310 |
$ |
9,310 |
$ |
— |
$ |
— |
||||||||
Revenues of Financial Products |
687 |
— |
780 |
(93) |
2 |
|||||||||||
Total sales and revenues |
9,997 |
9,310 |
780 |
(93) |
||||||||||||
Operating costs: |
||||||||||||||||
Cost of goods sold |
7,113 |
7,114 |
— |
(1) |
3 |
|||||||||||
Selling, general and administrative expenses |
1,179 |
984 |
201 |
(6) |
3 |
|||||||||||
Research and development expenses |
341 |
341 |
— |
— |
||||||||||||
Interest expense of Financial Products |
149 |
— |
149 |
— |
||||||||||||
Other operating (income) expenses |
431 |
122 |
320 |
(11) |
3 |
|||||||||||
Total operating costs |
9,213 |
8,561 |
670 |
(18) |
||||||||||||
Operating profit |
784 |
749 |
110 |
(75) |
||||||||||||
Interest expense excluding Financial Products |
135 |
135 |
— |
— |
||||||||||||
Other income (expense) |
29 |
(77) |
31 |
75 |
4 |
|||||||||||
Consolidated profit before taxes |
678 |
537 |
141 |
— |
||||||||||||
Provision (benefit) for income taxes |
227 |
190 |
37 |
— |
||||||||||||
Profit of consolidated companies |
451 |
347 |
104 |
— |
||||||||||||
Equity in profit (loss) of unconsolidated affiliated companies |
8 |
8 |
— |
— |
||||||||||||
Equity in profit of Financial Products' subsidiaries |
— |
99 |
— |
(99) |
5 |
|||||||||||
Profit of consolidated and affiliated companies |
459 |
454 |
104 |
(99) |
||||||||||||
Less: Profit (loss) attributable to noncontrolling interests |
1 |
(4) |
5 |
— |
||||||||||||
Profit 6 |
$ |
458 |
$ |
458 |
$ |
99 |
$ |
(99) |
||||||||
1 |
Represents Caterpillar Inc. and its subsidiaries with Financial Products accounted for on the equity basis. |
2 |
Elimination of Financial Products' revenues earned from Machinery, Energy & Transportation. |
3 |
Elimination of net expenses recorded by Machinery, Energy & Transportation paid to Financial Products. |
4 |
Elimination of discount recorded by Machinery, Energy & Transportation on receivables sold to Financial Products and of interest earned between Machinery, Energy & Transportation and Financial Products. |
5 |
Elimination of Financial Products' profit due to equity method of accounting. |
6 |
Profit attributable to common shareholders. |
Caterpillar Inc. Supplemental Data for Results of Operations For the Three Months Ended June 30, 2019 (Unaudited) (Millions of dollars) |
||||||||||||||||
Supplemental Consolidating Data |
||||||||||||||||
Consolidated |
Machinery, Energy & Transportation1 |
Financial Products |
Consolidating Adjustments |
|||||||||||||
Sales and revenues: |
||||||||||||||||
Sales of Machinery, Energy & Transportation |
$ |
13,671 |
$ |
13,671 |
$ |
— |
$ |
— |
||||||||
Revenues of Financial Products |
761 |
— |
894 |
(133) |
2 |
|||||||||||
Total sales and revenues |
14,432 |
13,671 |
894 |
(133) |
||||||||||||
Operating costs: |
||||||||||||||||
Cost of goods sold |
9,941 |
9,943 |
— |
(2) |
3 |
|||||||||||
Selling, general and administrative expenses |
1,309 |
1,102 |
209 |
(2) |
3 |
|||||||||||
Research and development expenses |
441 |
441 |
— |
— |
||||||||||||
Interest expense of Financial Products |
192 |
— |
201 |
(9) |
4 |
|||||||||||
Other operating (income) expenses |
336 |
1 |
341 |
(6) |
3 |
|||||||||||
Total operating costs |
12,219 |
11,487 |
751 |
(19) |
||||||||||||
Operating profit |
2,213 |
2,184 |
143 |
(114) |
||||||||||||
Interest expense excluding Financial Products |
103 |
105 |
— |
(2) |
4 |
|||||||||||
Other income (expense) |
68 |
(63) |
19 |
112 |
5 |
|||||||||||
Consolidated profit before taxes |
2,178 |
2,016 |
162 |
— |
||||||||||||
Provision (benefit) for income taxes |
565 |
502 |
63 |
— |
||||||||||||
Profit of consolidated companies |
1,613 |
1,514 |
99 |
— |
||||||||||||
Equity in profit (loss) of unconsolidated affiliated companies |
6 |
6 |
— |
— |
||||||||||||
Equity in profit of Financial Products' subsidiaries |
— |
94 |
— |
(94) |
6 |
|||||||||||
Profit of consolidated and affiliated companies |
1,619 |
1,614 |
99 |
(94) |
||||||||||||
Less: Profit (loss) attributable to noncontrolling interests |
(1) |
(6) |
5 |
— |
||||||||||||
Profit 7 |
$ |
1,620 |
$ |
1,620 |
$ |
94 |
$ |
(94) |
||||||||
1 |
Represents Caterpillar Inc. and its subsidiaries with Financial Products accounted for on the equity basis. |
2 |
Elimination of Financial Products' revenues earned from Machinery, Energy & Transportation. |
3 |
Elimination of net expenses recorded by Machinery, Energy & Transportation paid to Financial Products. |
4 |
Elimination of interest expense recorded between Financial Products and Machinery, Energy & Transportation. |
5 |
Elimination of discount recorded by Machinery, Energy & Transportation on receivables sold to Financial Products and of interest earned between Machinery, Energy & Transportation and Financial Products. |
6 |
Elimination of Financial Products' profit due to equity method of accounting. |
7 |
Profit attributable to common shareholders. |
Caterpillar Inc. Supplemental Data for Results of Operations For the Six Months Ended June 30, 2020 (Unaudited) (Millions of dollars) |
||||||||||||||||
Supplemental Consolidating Data |
||||||||||||||||
Consolidated |
Machinery, Energy & Transportation1 |
Financial Products |
Consolidating Adjustments |
|||||||||||||
Sales and revenues: |
||||||||||||||||
Sales of Machinery, Energy & Transportation |
$ |
19,224 |
$ |
19,224 |
$ |
— |
$ |
— |
||||||||
Revenues of Financial Products |
1,408 |
— |
1,610 |
(202) |
2 |
|||||||||||
Total sales and revenues |
20,632 |
19,224 |
1,610 |
(202) |
||||||||||||
Operating costs: |
||||||||||||||||
Cost of goods sold |
14,379 |
14,381 |
— |
(2) |
3 |
|||||||||||
Selling, general and administrative expenses |
2,300 |
1,924 |
383 |
(7) |
3 |
|||||||||||
Research and development expenses |
697 |
697 |
— |
— |
||||||||||||
Interest expense of Financial Products |
324 |
— |
325 |
(1) |
4 |
|||||||||||
Other operating (income) expenses |
744 |
132 |
640 |
(28) |
3 |
|||||||||||
Total operating costs |
18,444 |
17,134 |
1,348 |
(38) |
||||||||||||
Operating profit |
2,188 |
2,090 |
262 |
(164) |
||||||||||||
Interest expense excluding Financial Products |
248 |
247 |
— |
1 |
4 |
|||||||||||
Other income (expense) |
251 |
102 |
(16) |
165 |
5 |
|||||||||||
Consolidated profit before taxes |
2,191 |
1,945 |
246 |
— |
||||||||||||
Provision (benefit) for income taxes |
652 |
587 |
65 |
— |
||||||||||||
Profit of consolidated companies |
1,539 |
1,358 |
181 |
— |
||||||||||||
Equity in profit (loss) of unconsolidated affiliated companies |
13 |
13 |
— |
— |
||||||||||||
Equity in profit of Financial Products' subsidiaries |
— |
172 |
— |
(172) |
6 |
|||||||||||
Profit of consolidated and affiliated companies |
1,552 |
1,543 |
181 |
(172) |
||||||||||||
Less: Profit (loss) attributable to noncontrolling interests |
2 |
(7) |
9 |
— |
||||||||||||
Profit 7 |
$ |
1,550 |
$ |
1,550 |
$ |
172 |
$ |
(172) |
||||||||
1 |
Represents Caterpillar Inc. and its subsidiaries with Financial Products accounted for on the equity basis. |
2 |
Elimination of Financial Products' revenues earned from Machinery, Energy & Transportation. |
3 |
Elimination of net expenses recorded by Machinery, Energy & Transportation paid to Financial Products. |
4 |
Elimination of interest expense recorded between Financial Products and Machinery, Energy & Transportation. |
5 |
Elimination of discount recorded by Machinery, Energy & Transportation on receivables sold to Financial Products and of interest earned between Machinery, Energy & Transportation and Financial Products. |
6 |
Elimination of Financial Products' profit due to equity method of accounting. |
7 |
Profit attributable to common shareholders. |
Caterpillar Inc. Supplemental Data for Results of Operations For the Six Months Ended June 30, 2019 (Unaudited) (Millions of dollars) |
|||||||||||||||||
Supplemental Consolidating Data |
|||||||||||||||||
Consolidated |
Machinery, Energy & Transportation1 |
Financial Products |
Consolidating Adjustments |
||||||||||||||
Sales and revenues: |
|||||||||||||||||
Sales of Machinery, Energy & Transportation |
$ |
26,395 |
$ |
26,395 |
$ |
— |
$ |
— |
|||||||||
Revenues of Financial Products |
1,503 |
— |
1,764 |
(261) |
2 |
||||||||||||
Total sales and revenues |
27,898 |
26,395 |
1,764 |
(261) |
|||||||||||||
Operating costs: |
|||||||||||||||||
Cost of goods sold |
18,944 |
18,946 |
— |
(2) |
3 |
||||||||||||
Selling, general and administrative expenses |
2,628 |
2,229 |
401 |
(2) |
3 |
||||||||||||
Research and development expenses |
876 |
876 |
— |
— |
|||||||||||||
Interest expense of Financial Products |
382 |
— |
401 |
(19) |
4 |
||||||||||||
Other operating (income) expenses |
648 |
11 |
654 |
(17) |
3 |
||||||||||||
Total operating costs |
23,478 |
22,062 |
1,456 |
(40) |
|||||||||||||
Operating profit |
4,420 |
4,333 |
308 |
(221) |
|||||||||||||
Interest expense excluding Financial Products |
206 |
215 |
— |
(9) |
4 |
||||||||||||
Other income (expense) |
228 |
(44) |
60 |
212 |
5 |
||||||||||||
Consolidated profit before taxes |
4,442 |
4,074 |
368 |
— |
|||||||||||||
Provision (benefit) for income taxes |
952 |
837 |
115 |
— |
|||||||||||||
Profit of consolidated companies |
3,490 |
3,237 |
253 |
— |
|||||||||||||
Equity in profit (loss) of unconsolidated affiliated companies |
13 |
13 |
— |
— |
|||||||||||||
Equity in profit of Financial Products' subsidiaries |
— |
242 |
— |
(242) |
6 |
||||||||||||
Profit of consolidated and affiliated companies |
3,503 |
3,492 |
253 |
(242) |
|||||||||||||
Less: Profit (loss) attributable to noncontrolling interests |
2 |
(9) |
11 |
— |
|||||||||||||
Profit 7 |
$ |
3,501 |
$ |
3,501 |
$ |
242 |
$ |
(242) |
|||||||||
1 |
Represents Caterpillar Inc. and its subsidiaries with Financial Products accounted for on the equity basis. |
2 |
Elimination of Financial Products' revenues earned from Machinery, Energy & Transportation. |
3 |
Elimination of net expenses recorded by Machinery, Energy & Transportation paid to Financial Products. |
4 |
Elimination of interest expense recorded between Financial Products and Machinery, Energy & Transportation. |
5 |
Elimination of discount recorded by Machinery, Energy & Transportation on receivables sold to Financial Products and of interest earned between Machinery, Energy & Transportation and Financial Products. |
6 |
Elimination of Financial Products' profit due to equity method of accounting. |
7 |
Profit attributable to common shareholders. |
Caterpillar Inc. Supplemental Data for Financial Position At June 30, 2020 (Unaudited) (Millions of dollars) |
||||||||||||||||
Supplemental Consolidating Data |
||||||||||||||||
Consolidated |
Machinery, Energy & Transportation 1 |
Financial Products |
Consolidating Adjustments |
|||||||||||||
Assets |
||||||||||||||||
Current assets: |
||||||||||||||||
Cash and short-term investments |
$ |
8,784 |
$ |
8,030 |
$ |
754 |
$ |
— |
||||||||
Receivables – trade and other |
7,134 |
2,599 |
506 |
4,029 |
2,3 |
|||||||||||
Receivables – finance |
8,781 |
— |
13,064 |
(4,283) |
3 |
|||||||||||
Prepaid expenses and other current assets |
1,792 |
1,185 |
618 |
(11) |
4 |
|||||||||||
Inventories |
11,371 |
11,371 |
— |
— |
||||||||||||
Total current assets |
37,862 |
23,185 |
14,942 |
(265) |
||||||||||||
Property, plant and equipment – net |
12,357 |
8,250 |
4,107 |
— |
||||||||||||
Long-term receivables – trade and other |
1,167 |
274 |
194 |
699 |
2,3 |
|||||||||||
Long-term receivables – finance |
12,560 |
— |
13,277 |
(717) |
3 |
|||||||||||
Investments in Financial Products subsidiaries |
— |
4,257 |
— |
(4,257) |
5 |
|||||||||||
Noncurrent deferred and refundable income taxes |
1,459 |
1,990 |
106 |
(637) |
6 |
|||||||||||
Intangible assets |
1,420 |
1,420 |
— |
— |
||||||||||||
Goodwill |
6,192 |
6,192 |
— |
— |
||||||||||||
Other assets |
3,549 |
1,880 |
1,766 |
(97) |
7 |
|||||||||||
Total assets |
$ |
76,566 |
$ |
47,448 |
$ |
34,392 |
$ |
(5,274) |
||||||||
Liabilities |
||||||||||||||||
Current liabilities: |
||||||||||||||||
Short-term borrowings |
$ |
4,314 |
$ |
13 |
$ |
4,301 |
$ |
— |
||||||||
Short-term borrowings with consolidated companies |
— |
— |
99 |
(99) |
8 |
|||||||||||
Accounts payable |
5,083 |
5,046 |
196 |
(159) |
9 |
|||||||||||
Accrued expenses |
3,547 |
3,239 |
308 |
— |
||||||||||||
Accrued wages, salaries and employee benefits |
958 |
943 |
15 |
— |
||||||||||||
Customer advances |
1,227 |
1,227 |
— |
— |
||||||||||||
Dividends payable |
558 |
558 |
— |
— |
||||||||||||
Other current liabilities |
2,143 |
1,521 |
654 |
(32) |
6,10 |
|||||||||||
Long-term debt due within one year |
7,401 |
1,395 |
6,006 |
— |
||||||||||||
Total current liabilities |
25,231 |
13,942 |
11,579 |
(290) |
||||||||||||
Long-term debt due after one year |
26,907 |
9,743 |
17,178 |
(14) |
8 |
|||||||||||
Liability for postemployment benefits |
6,285 |
6,284 |
1 |
— |
||||||||||||
Other liabilities |
4,366 |
3,702 |
1,377 |
(713) |
6 |
|||||||||||
Total liabilities |
62,789 |
33,671 |
30,135 |
(1,017) |
||||||||||||
Shareholders' equity |
||||||||||||||||
Common stock |
6,120 |
6,120 |
919 |
(919) |
5 |
|||||||||||
Treasury stock |
(25,412) |
(25,412) |
— |
— |
||||||||||||
Profit employed in the business |
34,841 |
34,841 |
4,136 |
(4,136) |
5 |
|||||||||||
Accumulated other comprehensive income (loss) |
(1,815) |
(1,815) |
(977) |
977 |
5 |
|||||||||||
Noncontrolling interests |
43 |
43 |
179 |
(179) |
5 |
|||||||||||
Total shareholders' equity |
13,777 |
13,777 |
4,257 |
(4,257) |
||||||||||||
Total liabilities and shareholders' equity |
$ |
76,566 |
$ |
47,448 |
$ |
34,392 |
$ |
(5,274) |
||||||||
1 |
Represents Caterpillar Inc. and its subsidiaries with Financial Products accounted for on the equity basis. |
2 |
Elimination of receivables between Machinery, Energy & Transportation and Financial Products. |
3 |
Reclassification of Machinery, Energy & Transportation's trade receivables purchased by Financial Products and Financial Products' wholesale inventory receivables. |
4 |
Elimination of Machinery, Energy & Transportation's insurance premiums that are prepaid to Financial Products. |
5 |
Elimination of Financial Products' equity which is accounted for by Machinery, Energy & Transportation on the equity basis. |
6 |
Reclassification reflecting required netting of deferred tax assets/liabilities by taxing jurisdiction. |
7 |
Elimination of other intercompany assets between Machinery, Energy & Transportation and Financial Products. |
8 |
Elimination of debt between Machinery, Energy & Transportation and Financial Products. |
9 |
Elimination of payables between Machinery, Energy & Transportation and Financial Products. |
10 |
Elimination of prepaid insurance in Financial Products' other liabilities. |
Caterpillar Inc. Supplemental Data for Financial Position At December 31, 2019 (Unaudited) (Millions of dollars) |
||||||||||||||||
Supplemental Consolidating Data |
||||||||||||||||
Consolidated |
Machinery, Energy & Transportation 1 |
Financial Products |
Consolidating Adjustments |
|||||||||||||
Assets |
||||||||||||||||
Current assets: |
||||||||||||||||
Cash and short-term investments |
$ |
8,284 |
$ |
7,299 |
$ |
985 |
$ |
— |
||||||||
Receivables – trade and other |
8,568 |
3,737 |
451 |
4,380 |
2,3 |
|||||||||||
Receivables – finance |
9,336 |
— |
14,489 |
(5,153) |
3 |
|||||||||||
Prepaid expenses and other current assets |
1,739 |
1,290 |
529 |
(80) |
4 |
|||||||||||
Inventories |
11,266 |
11,266 |
— |
— |
||||||||||||
Total current assets |
39,193 |
23,592 |
16,454 |
(853) |
||||||||||||
Property, plant and equipment – net |
12,904 |
8,606 |
4,298 |
— |
||||||||||||
Long-term receivables – trade and other |
1,193 |
348 |
152 |
693 |
2,3 |
|||||||||||
Long-term receivables – finance |
12,651 |
— |
13,354 |
(703) |
3 |
|||||||||||
Investments in Financial Products subsidiaries |
— |
4,260 |
— |
(4,260) |
5 |
|||||||||||
Noncurrent deferred and refundable income taxes |
1,411 |
2,002 |
117 |
(708) |
6 |
|||||||||||
Intangible assets |
1,565 |
1,565 |
— |
— |
||||||||||||
Goodwill |
6,196 |
6,196 |
— |
— |
||||||||||||
Other assets |
3,340 |
1,868 |
1,572 |
(100) |
7 |
|||||||||||
Total assets |
$ |
78,453 |
$ |
48,437 |
$ |
35,947 |
$ |
(5,931) |
||||||||
Liabilities |
||||||||||||||||
Current liabilities: |
||||||||||||||||
Short-term borrowings |
$ |
5,166 |
$ |
5 |
$ |
5,161 |
$ |
— |
||||||||
Short-term borrowings with consolidated companies |
— |
— |
600 |
(600) |
8 |
|||||||||||
Accounts payable |
5,957 |
5,918 |
212 |
(173) |
9 |
|||||||||||
Accrued expenses |
3,750 |
3,415 |
335 |
— |
||||||||||||
Accrued wages, salaries and employee benefits |
1,629 |
1,580 |
49 |
— |
||||||||||||
Customer advances |
1,187 |
1,187 |
— |
— |
||||||||||||
Dividends payable |
567 |
567 |
— |
— |
||||||||||||
Other current liabilities |
2,155 |
1,689 |
566 |
(100) |
6,10 |
|||||||||||
Long-term debt due within one year |
6,210 |
16 |
6,194 |
— |
||||||||||||
Total current liabilities |
26,621 |
14,377 |
13,117 |
(873) |
||||||||||||
Long-term debt due after one year |
26,281 |
9,151 |
17,140 |
(10) |
8 |
|||||||||||
Liability for postemployment benefits |
6,599 |
6,599 |
— |
— |
||||||||||||
Other liabilities |
4,323 |
3,681 |
1,430 |
(788) |
6 |
|||||||||||
Total liabilities |
63,824 |
33,808 |
31,687 |
(1,671) |
||||||||||||
Shareholders' equity |
||||||||||||||||
Common stock |
5,935 |
5,935 |
919 |
(919) |
5 |
|||||||||||
Treasury stock |
(24,217) |
(24,217) |
— |
— |
||||||||||||
Profit employed in the business |
34,437 |
34,437 |
3,997 |
(3,997) |
5 |
|||||||||||
Accumulated other comprehensive income (loss) |
(1,567) |
(1,567) |
(828) |
828 |
5 |
|||||||||||
Noncontrolling interests |
41 |
41 |
172 |
(172) |
5 |
|||||||||||
Total shareholders' equity |
14,629 |
14,629 |
4,260 |
(4,260) |
||||||||||||
Total liabilities and shareholders' equity |
$ |
78,453 |
$ |
48,437 |
$ |
35,947 |
$ |
(5,931) |
||||||||
1 |
Represents Caterpillar Inc. and its subsidiaries with Financial Products accounted for on the equity basis. |
2 |
Elimination of receivables between Machinery, Energy & Transportation and Financial Products. |
3 |
Reclassification of Machinery, Energy & Transportation's trade receivables purchased by Financial Products and Financial Products' wholesale inventory receivables. |
4 |
Elimination of Machinery, Energy & Transportation's insurance premiums that are prepaid to Financial Products. |
5 |
Elimination of Financial Products' equity which is accounted for by Machinery, Energy & Transportation on the equity basis. |
6 |
Reclassification reflecting required netting of deferred tax assets/liabilities by taxing jurisdiction. |
7 |
Elimination of other intercompany assets between Machinery, Energy & Transportation and Financial Products. |
8 |
Elimination of debt between Machinery, Energy & Transportation and Financial Products. |
9 |
Elimination of payables between Machinery, Energy & Transportation and Financial Products. |
10 |
Elimination of prepaid insurance in Financial Products' other liabilities. |
Caterpillar Inc. Supplemental Data for Cash Flow For the Six Months Ended June 30, 2020 (Unaudited) (Millions of dollars) |
||||||||||||||||
Supplemental Consolidating Data |
||||||||||||||||
Consolidated |
Machinery, Energy & Transportation1 |
Financial Products |
Consolidating Adjustments |
|||||||||||||
Cash flow from operating activities: |
||||||||||||||||
Profit of consolidated and affiliated companies |
$ |
1,552 |
$ |
1,543 |
$ |
181 |
$ |
(172) |
2 |
|||||||
Adjustments for non-cash items: |
||||||||||||||||
Depreciation and amortization |
1,222 |
805 |
417 |
— |
||||||||||||
Undistributed profit of Financial Products |
— |
(152) |
— |
152 |
3 |
|||||||||||
Net gain on remeasurement of pension obligations |
(132) |
(132) |
— |
— |
||||||||||||
Provision (benefit) for deferred income taxes |
(32) |
40 |
(72) |
— |
||||||||||||
Other |
674 |
347 |
145 |
182 |
4 |
|||||||||||
Changes in assets and liabilities, net of acquisitions and divestitures: |
||||||||||||||||
Receivables – trade and other |
1,176 |
539 |
(77) |
714 |
4, 5 |
|||||||||||
Inventories |
(145) |
(137) |
— |
(8) |
4 |
|||||||||||
Accounts payable |
(655) |
(664) |
(5) |
14 |
4 |
|||||||||||
Accrued expenses |
(253) |
(237) |
(16) |
— |
||||||||||||
Accrued wages, salaries and employee benefits |
(648) |
(614) |
(34) |
— |
||||||||||||
Customer advances |
(2) |
(2) |
— |
— |
||||||||||||
Other assets – net |
(7) |
30 |
30 |
(67) |
4 |
|||||||||||
Other liabilities – net |
(229) |
(391) |
84 |
78 |
4 |
|||||||||||
Net cash provided by (used for) operating activities |
2,521 |
975 |
653 |
893 |
||||||||||||
Cash flow from investing activities: |
||||||||||||||||
Capital expenditures – excluding equipment leased to others |
(472) |
(465) |
(7) |
— |
||||||||||||
Expenditures for equipment leased to others |
(526) |
1 |
(540) |
13 |
4 |
|||||||||||
Proceeds from disposals of leased assets and property, plant and equipment |
382 |
104 |
283 |
(5) |
4 |
|||||||||||
Additions to finance receivables |
(6,712) |
— |
(7,352) |
640 |
5 |
|||||||||||
Collections of finance receivables |
6,801 |
— |
7,442 |
(641) |
5 |
|||||||||||
Net intercompany purchased receivables |
— |
— |
920 |
(920) |
5 |
|||||||||||
Proceeds from sale of finance receivables |
31 |
— |
31 |
— |
||||||||||||
Net intercompany borrowings |
— |
500 |
2 |
(502) |
6 |
|||||||||||
Investments and acquisitions (net of cash acquired) |
(49) |
(49) |
— |
— |
||||||||||||
Proceeds from sale of businesses and investments (net of cash sold) |
13 |
13 |
— |
— |
||||||||||||
Proceeds from sale of securities |
151 |
12 |
139 |
— |
||||||||||||
Investments in securities |
(369) |
(10) |
(359) |
— |
||||||||||||
Other – net |
7 |
(15) |
22 |
— |
||||||||||||
Net cash provided by (used for) investing activities |
(743) |
91 |
581 |
(1,415) |
||||||||||||
Cash flow from financing activities: |
||||||||||||||||
Dividends paid |
(1,125) |
(1,125) |
(20) |
20 |
7 |
|||||||||||
Common stock issued, including treasury shares reissued |
(10) |
(10) |
— |
— |
||||||||||||
Common shares repurchased |
(1,130) |
(1,130) |
— |
— |
||||||||||||
Net intercompany borrowings |
— |
(2) |
(500) |
502 |
6 |
|||||||||||
Proceeds from debt issued > 90 days |
6,159 |
1,991 |
4,168 |
— |
||||||||||||
Payments on debt > 90 days |
(4,629) |
(12) |
(4,617) |
— |
||||||||||||
Short-term borrowings – net < 90 days |
(477) |
8 |
(485) |
— |
||||||||||||
Other – net |
(1) |
(1) |
— |
— |
||||||||||||
Net cash provided by (used for) financing activities |
(1,213) |
(281) |
(1,454) |
522 |
||||||||||||
Effect of exchange rate changes on cash |
(66) |
(54) |
(12) |
— |
||||||||||||
Increase (decrease) in cash and short-term investments and restricted cash |
499 |
731 |
(232) |
— |
||||||||||||
Cash and short-term investments and restricted cash at beginning of period |
8,292 |
7,302 |
990 |
— |
||||||||||||
Cash and short-term investments and restricted cash at end of period |
$ |
8,791 |
$ |
8,033 |
$ |
758 |
$ |
— |
||||||||
1 |
Represents Caterpillar Inc. and its subsidiaries with Financial Products accounted for on the equity basis. |
2 |
Elimination of Financial Products' profit after tax due to equity method of accounting. |
3 |
Elimination of non-cash adjustment for the undistributed earnings from Financial Products. |
4 |
Elimination of non-cash adjustments and changes in assets and liabilities related to consolidated reporting. |
5 |
Reclassification of Financial Products' cash flow activity from investing to operating for receivables that arose from the sale of inventory. |
6 |
Elimination of net proceeds and payments to/from Machinery, Energy & Transportation and Financial Products. |
7 |
Elimination of dividend from Financial Products to Machinery, Energy & Transportation. |
Caterpillar Inc. Supplemental Data for Cash Flow For the Six Months Ended June 30, 2019 (Unaudited) (Millions of dollars) |
||||||||||||||||
Supplemental Consolidating Data |
||||||||||||||||
Consolidated |
Machinery, Energy & Transportation1 |
Financial Products |
Consolidating Adjustments |
|||||||||||||
Cash flow from operating activities: |
||||||||||||||||
Profit of consolidated and affiliated companies |
$ |
3,503 |
$ |
3,492 |
$ |
253 |
$ |
(242) |
2 |
|||||||
Adjustments for non-cash items: |
||||||||||||||||
Depreciation and amortization |
1,288 |
855 |
433 |
— |
||||||||||||
Undistributed profit of Financial Products |
— |
(242) |
— |
242 |
3 |
|||||||||||
Provision (benefit) for deferred income taxes |
(34) |
(16) |
(18) |
— |
||||||||||||
Other |
440 |
264 |
(51) |
227 |
4 |
|||||||||||
Changes in assets and liabilities, net of acquisitions and divestitures: |
||||||||||||||||
Receivables – trade and other |
(166) |
161 |
(5) |
(322) |
4, 5 |
|||||||||||
Inventories |
(487) |
(489) |
— |
2 |
4 |
|||||||||||
Accounts payable |
134 |
(94) |
279 |
(51) |
4 |
|||||||||||
Accrued expenses |
151 |
158 |
(5) |
(2) |
4 |
|||||||||||
Accrued wages, salaries and employee benefits |
(979) |
(978) |
(1) |
— |
||||||||||||
Customer advances |
14 |
18 |
— |
(4) |
4 |
|||||||||||
Other assets – net |
(120) |
(165) |
61 |
(16) |
4 |
|||||||||||
Other liabilities – net |
(35) |
(144) |
89 |
20 |
4 |
|||||||||||
Net cash provided by (used for) operating activities |
3,709 |
2,820 |
1,035 |
(146) |
||||||||||||
Cash flow from investing activities: |
||||||||||||||||
Capital expenditures – excluding equipment leased to others |
(479) |
(468) |
(11) |
— |
||||||||||||
Expenditures for equipment leased to others |
(746) |
(24) |
(725) |
3 |
4 |
|||||||||||
Proceeds from disposals of leased assets and property, plant and equipment |
422 |
97 |
367 |
(42) |
4 |
|||||||||||
Additions to finance receivables |
(6,181) |
— |
(7,027) |
846 |
5 |
|||||||||||
Collections of finance receivables |
5,902 |
— |
6,548 |
(646) |
5 |
|||||||||||
Net intercompany purchased receivables |
— |
— |
15 |
(15) |
5 |
|||||||||||
Proceeds from sale of finance receivables |
119 |
— |
119 |
— |
||||||||||||
Net intercompany borrowings |
— |
213 |
1 |
(214) |
6 |
|||||||||||
Investments and acquisitions (net of cash acquired) |
(3) |
(3) |
— |
— |
||||||||||||
Proceeds from sale of securities |
170 |
13 |
157 |
— |
||||||||||||
Investments in securities |
(243) |
(12) |
(231) |
— |
||||||||||||
Other – net |
(40) |
(9) |
(31) |
— |
||||||||||||
Net cash provided by (used for) investing activities |
(1,079) |
(193) |
(818) |
(68) |
||||||||||||
Cash flow from financing activities: |
||||||||||||||||
Dividends paid |
(986) |
(986) |
— |
— |
||||||||||||
Common stock issued, including treasury shares reissued |
39 |
39 |
— |
— |
||||||||||||
Common shares repurchased |
(2,105) |
(2,105) |
— |
— |
||||||||||||
Net intercompany borrowings |
— |
(1) |
(213) |
214 |
6 |
|||||||||||
Proceeds from debt issued > 90 days |
5,340 |
— |
5,340 |
— |
||||||||||||
Payments on debt > 90 days |
(4,901) |
(4) |
(4,897) |
— |
||||||||||||
Short-term borrowings – net < 90 days |
(436) |
— |
(436) |
— |
||||||||||||
Other – net |
(2) |
(2) |
— |
— |
||||||||||||
Net cash provided by (used for) financing activities |
(3,051) |
(3,059) |
(206) |
214 |
||||||||||||
Effect of exchange rate changes on cash |
(10) |
(8) |
(2) |
— |
||||||||||||
Increase (decrease) in cash and short-term investments and restricted cash |
(431) |
(440) |
9 |
— |
||||||||||||
Cash and short-term investments and restricted cash at beginning of period |
7,890 |
6,994 |
896 |
— |
||||||||||||
Cash and short-term investments and restricted cash at end of period |
$ |
7,459 |
$ |
6,554 |
$ |
905 |
$ |
— |
||||||||
1 |
Represents Caterpillar Inc. and its subsidiaries with Financial Products accounted for on the equity basis. |
2 |
Elimination of Financial Products' profit after tax due to equity method of accounting. |
3 |
Elimination of non-cash adjustment for the undistributed earnings from Financial Products. |
4 |
Elimination of non-cash adjustment and changes in assets and liabilities related to consolidated reporting. |
5 |
Reclassification of Financial Products' cash flow activity from investing to operating for receivables that arose from the sale of inventory. |
6 |
Elimination of net proceeds and payments to/from Machinery, Energy & Transportation and Financial Products. |
SOURCE Caterpillar Inc.


Share this article