Fewer Americans 'Going Green'
New poll shows decrease in "Green" behaviors since 2009

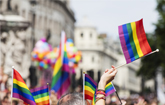
NEW YORK, Jan. 10, 2011 /PRNewswire/ -- When it comes to the environment, there is an interesting difference in who is and who is not green. Lesbian, gay, bisexual and/or transgender (LGBT) adults are "greener" than their heterosexual counterparts – LGBT adults are more likely to express concern for the environment, describe themselves in green terms (e.g., environmentalist, "green," conservationist), and say environmental issues are important to their voting and purchasing decisions.
(Logo: http://photos.prnewswire.com/prnh/20100517/NY06256LOGO )
However, while LGBT adults are increasing their commitment to the environment, American adults overall are now less likely than they were in the summer of 2009 to espouse certain "green" attitudes and engage in various environmentally-friendly activities.
These are some of the results of The Harris Poll of 2,352 U.S. adults (ages 18 and over), surveyed online between November 8 and November 15, 2010 by Harris Interactive.
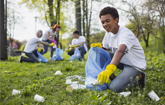
A comparison between the 2010 and 2009 surveys reveals that fewer Americans are now "going green." Specifically, compared to 2009, adults in America are now less likely to engage in various green behaviors in their daily life, including:
- Making an effort to use less water (60% 2009 vs. 57% 2010);
- Purchasing locally grown produce (39% 2009 vs. 33% 2010);
- Purchasing locally manufactured products (26% 2009 vs. 23% 2010);
- Purchasing organic products (17% 2009 vs. 15% 2010); and,
- Composting food and organic waste (17% 2009 vs. 15% 2010).
And, U.S. adults are also less likely to have adopted certain environmental activities in the past year, including:
- Purchased Energy Star appliances (36% 2009 vs. 30% 2010);
- Donated or recycled electronics (41% 2009 vs. 32% 2010);
- Switched from bottled to tap water (29% 2009 vs. 23% 2010);
- Installed a low-flow showerhead or toilet (25% 2009 vs. 20% 2010); and,
- Purchased a hybrid or more fuel-efficient car (13% 2009 vs. 8% 2010).
Not only are fewer Americans behaving in environmentally-friendly ways, but many are now also less likely to embrace, or be influenced by, "green" attitudes – just over 1 in 3 U.S. adults (36%) say they are concerned about the planet they are leaving behind for future generations, compared to more than 2 in 5 adults (43%) who said so in 2009. And, only 28% of adults say environmental issues are very or extremely important to them when deciding how to vote for political candidates, compared to more than 1 in 3 adults (36%) who said this was important to them in 2009.
Despite the aforementioned declines in Americans' attitudes and actions concerning environmental issues, U.S. adults are now more likely to describe themselves as conservationist (20% 2010 vs. 17% 2009), "green" (18% 2010 vs. 13% 2009), and environmentalist (16% 2010 vs. 13% 2009) than they were previously.
So What?
It is difficult to draw conclusions from these paradoxical results: on the one hand, only minorities of U.S. adults – even fewer now than in 2009 – think or act green. On the other hand, though still only a minority, more adults than before now label themselves in environmental terms. Only time will tell if Americans are just paying lip service to trendy buzz words like "green" and "environmentalist," or if these are signs of a gradually expanding small but vocal "green movement." One point to consider, though, is the economy: it's possible that, in economic hard times, environmental enthusiasm wanes as people face tougher financial problems.
TABLE 1A FREQUENCY OF VARIOUS GREEN BEHAVIORS "How often do you do each of the following in your daily life?" Base: All adults |
||||||||
Always/ Often (NET) |
Always |
Often |
Sometimes |
Rarely/ Never (NET) |
Rarely |
Never |
||
% |
% |
% |
% |
% |
% |
% |
||
Keep unneeded lights off or turn lights off when leaving a room |
81 |
47 |
34 |
15 |
4 |
2 |
2 |
|
Recycle |
68 |
43 |
25 |
19 |
13 |
7 |
6 |
|
Reuse things that I have instead of throwing them away or buying new items |
63 |
23 |
40 |
25 |
11 |
7 |
4 |
|
Make an effort to use less water |
57 |
24 |
34 |
27 |
16 |
10 |
6 |
|
Unplug electrical appliances when I am not using them |
39 |
15 |
25 |
27 |
34 |
17 |
16 |
|
Purchase locally grown produce |
33 |
6 |
27 |
44 |
23 |
15 |
9 |
|
Buy food in bulk |
32 |
7 |
25 |
37 |
31 |
20 |
11 |
|
Purchase locally manufactured products |
23 |
4 |
19 |
48 |
28 |
19 |
9 |
|
Purchase used items rather than new |
24 |
4 |
20 |
39 |
37 |
23 |
14 |
|
Purchase all-natural products |
16 |
2 |
14 |
42 |
41 |
27 |
14 |
|
Purchase organic products |
15 |
2 |
13 |
36 |
49 |
28 |
21 |
|
Compost food and organic waste |
15 |
7 |
8 |
15 |
70 |
16 |
54 |
|
Carpool or take public transportation |
16 |
7 |
9 |
17 |
67 |
23 |
44 |
|
Walk or ride a bike instead of driving or using public transportation |
15 |
3 |
11 |
22 |
64 |
23 |
41 |
|
Note: Percentages may not add to 100% due to rounding. |
||||||||
TABLE 1B FREQUENCY OF VARIOUS GREEN BEHAVIORS "How often do you do each of the following in your daily life?" Summary of those saying "Always" or "Often" Base: All adults |
|||
2009 Total |
2010 Total |
||
% |
% |
||
Keep unneeded lights off or turn lights off when leaving a room |
83 |
81 |
|
Recycle |
68 |
68 |
|
Reuse things that I have instead of throwing them away or buying new items |
65 |
63 |
|
Make an effort to use less water |
60 |
57 |
|
Unplug electrical appliances when I am not using them |
40 |
39 |
|
Purchase locally grown produce |
39 |
33 |
|
Buy food in bulk |
33 |
32 |
|
Purchase locally manufactured products |
26 |
23 |
|
Purchase used items rather than new |
25 |
24 |
|
Purchase all-natural products |
18 |
16 |
|
Purchase organic products |
17 |
15 |
|
Compost food and organic waste |
17 |
15 |
|
Carpool or take public transportation |
16 |
16 |
|
Walk or ride a bike instead of driving or using public transportation |
15 |
15 |
|
Note: Percentages may not add to 100% due to rounding. |
|||
TABLE 2 ENVIRONMENTAL ACTIVITIES IN LAST YEAR "Which of the following environmental activities, if any, have you done within the past year?" Base: All adults |
|||
2009 Total |
2010 Total |
||
% |
% |
||
Energy-Efficient Lighting/Appliances (NET) |
69 |
66 |
|
Replaced regular light bulbs with more energy-efficient lighting (e.g., CFLs, LEDs) |
63 |
61 |
|
Purchased energy-efficient (e.g., Energy Star) appliances |
36 |
30 |
|
Paperless Statements/Online Bill Pay (NET) |
53 |
54 |
|
Started paying bills online for my personal financial accounts |
46 |
44 |
|
Switched to paperless statements for my personal financial accounts |
40 |
41 |
|
Donated or recycled a computer, cell phone or other electronic device or its parts |
41 |
32 |
|
Switched from bottled water to filtered tap water |
29 |
23 |
|
Low-Flow Showerhead/Toilet (NET) |
25 |
20 |
|
Installed a low-flow showerhead |
17 |
13 |
|
Installed a low-flow toilet |
16 |
13 |
|
Patronized/Avoided a Business (NET) |
15 |
15 |
|
Patronized a business because of their environmental activities |
11 |
10 |
|
Avoided patronizing a business because of their environmental activities (or lack thereof) |
9 |
10 |
|
Made home improvements that enabled me to take advantage of a "green" government tax credit (e.g., installed dual-pane windows, solar panels, insulation) |
14 |
13 |
|
Hybrid/Fuel-Efficient Car (NET) |
13 |
8 |
|
Purchased a more fuel-efficient car that is not a hybrid |
11 |
7 |
|
Purchased a hybrid car |
2 |
1 |
|
None |
13 |
16 |
|
Note: Percentages may not add to 100% due to rounding, the acceptance of multiple responses, and the exclusion of "other." |
|||
TABLE 3A ENVIRONMENTAL LABELS "To what extent, if any, does each of the following statements describe you?" Base: All adults |
||||||||
Very well/ Completely (NET) |
Completely |
Very well |
Fairly well |
Somewhat well/Does not describe me (NET) |
Somewhat well |
Does not describe me at all |
||
% |
% |
% |
% |
% |
% |
% |
||
I am concerned about the planet we are leaving behind for future generations. |
36 |
16 |
20 |
27 |
38 |
26 |
11 |
|
I personally care a great deal about the current state, and future, of the environment. |
34 |
14 |
20 |
27 |
39 |
29 |
10 |
|
I am environmentally-conscious. |
29 |
10 |
20 |
29 |
42 |
31 |
11 |
|
I feel a personal responsibility for taking care of the environment. |
29 |
10 |
19 |
26 |
45 |
30 |
15 |
|
I encourage others to be more environmentally-friendly. |
25 |
9 |
16 |
25 |
50 |
28 |
23 |
|
I am a conservationist. |
20 |
7 |
13 |
26 |
54 |
30 |
24 |
|
I am "green". |
18 |
6 |
13 |
24 |
58 |
32 |
26 |
|
I am an environmentalist. |
16 |
6 |
11 |
20 |
63 |
28 |
35 |
|
Note: Percentages may not add to 100% due to rounding. |
||||||||
TABLE 3B ENVIRONMENTAL LABELS "To what extent, if any, does each of the following statements describe you?" Summary of those saying "Very well" or "Completely" Base: All adults |
|||
2009 Total |
2010 Total |
||
% |
% |
||
I am concerned about the planet we are leaving behind for future generations. |
43 |
36 |
|
I personally care a great deal about the current state, and future, of the environment. |
36 |
34 |
|
I am environmentally-conscious. |
30 |
29 |
|
I feel a personal responsibility for taking care of the environment. |
29 |
29 |
|
I encourage others to be more environmentally-friendly. |
26 |
25 |
|
I am a conservationist. |
17 |
20 |
|
I am "green". |
13 |
18 |
|
I am an environmentalist. |
13 |
16 |
|
Note: Percentages may not add to 100% due to rounding. |
|||
TABLE 4A ENVIRONMENTAL DECISIONS "How important are environmental issues to you when it comes to making decisions about…?" Base: All adults |
||||||||
Extremely/ Very Important (NET) |
Extremely Important |
Very Important |
Fairly Important |
Somewhat/ Not at all Important (NET) |
Somewhat Important |
Not at all important |
||
% |
% |
% |
% |
% |
% |
% |
||
How you vote for political candidates |
28 |
11 |
17 |
23 |
49 |
27 |
23 |
|
Which products or services you purchase |
27 |
7 |
20 |
26 |
48 |
30 |
18 |
|
What company or business you work for, or apply for a job at |
18 |
6 |
12 |
21 |
62 |
26 |
36 |
|
Note: Percentages may not add to 100% due to rounding. |
||||||||
TABLE 4B ENVIRONMENTAL DECISIONS "How important are environmental issues to you when it comes to making decisions about…?" Summary of those saying "Extremely important" or "Very important" Base: All adults |
|||
2009 Total |
2010 Total |
||
% |
% |
||
How you vote for political candidates |
36 |
28 |
|
Which products or services you purchase |
26 |
27 |
|
What company or business you work for, or apply for a job at |
17 |
18 |
|
Note: Percentages may not add to 100% due to rounding. |
|||
Methodology
This Harris Poll was conducted online within the United States between November 8 to 15, 2010 among 2,352 adults (aged 18 and over). Figures for age, sex, race/ethnicity, education, region and household income were weighted where necessary to bring them into line with their actual proportions in the population. Propensity score weighting was also used to adjust for respondents' propensity to be online.
All sample surveys and polls, whether or not they use probability sampling, are subject to multiple sources of error which are most often not possible to quantify or estimate, including sampling error, coverage error, error associated with nonresponse, error associated with question wording and response options, and post-survey weighting and adjustments. Therefore, Harris Interactive avoids the words "margin of error" as they are misleading. All that can be calculated are different possible sampling errors with different probabilities for pure, unweighted, random samples with 100% response rates. These are only theoretical because no published polls come close to this ideal.
Respondents for this survey were selected from among those who have agreed to participate in Harris Interactive surveys. The data have been weighted to reflect the composition of the adult population. Because the sample is based on those who agreed to participate in the Harris Interactive panel, no estimates of theoretical sampling error can be calculated.
These statements conform to the principles of disclosure of the National Council on Public Polls.
The results of this Harris Poll may not be used in advertising, marketing or promotion without the prior written permission of Harris Interactive.
J38848
Q860, 865, 875, 880
The Harris Poll® #3, January 10, 2011
By Kathy Steinberg, Sr. Research Manager, Public Affairs and Policy Research, Harris Interactive
About Harris Interactive
Harris Interactive is one of the world's leading custom market research firms, leveraging research, technology, and business acumen to transform relevant insight into actionable foresight. Known widely for the Harris Poll and for pioneering innovative research methodologies, Harris offers expertise in a wide range of industries including healthcare, technology, public affairs, energy, telecommunications, financial services, insurance, media, retail, restaurant, and consumer package goods. Serving clients in over 215 countries and territories through our North American, European, and Asian offices and a network of independent market research firms, Harris specializes in delivering research solutions that help us – and our clients – stay ahead of what's next. For more information, please visit www.harrisinteractive.com.
Press Contacts: |
|
Corporate Communications |
|
Harris Interactive |
|
212-539-9600 |
|
SOURCE The Harris Poll


Share this article